
Abstract: Although suffering from the decline of return on capital (ROC) like what Japan, South Korea, Taiwan (China) and other East Asian economies have experienced been during their economic transitions, China, however, haven’t witnessed the fall of interest rate like the other countries have. This may be attributed to the PBC’s previous moves to maintain relatively low interest rate to overcome the appreciation of RMB, expanded demand for capital for infrastructure investment, and high leverage by households and real estate firms under expectations to higher housing price. In the future, China’s interest rate will go through systematic changes. Considering the continuing decline of ROC and relatively high savings rate, the nominal interest rate of China’s long-term government bonds may fall to around 2% by 2030; the downward trend of all types of interest rates is highly possible. This could be good news to equity market and private sectors, and conducive to economic efficiency.
I. Economic growth and development process is a repetition.
Long-term economic forecast is a challenge, as the elusive evolution of economic parameters makes it difficult to predict the features of future economic structure.
Our analysis is therefore based on the assumption that economic development is basically a repeating journey. In particular, the catching-up economies tend to repeat the growth of the economies who have achieved longstanding high growth and high per capita income.
If we put China’s growth in the recent 30 years in the context of the economic transitions in East Asian economies, it would be hard to be oblivious of the similarities between the economic structure parameters of China and other East Asian economies.
For example, impacted by Confucianism, these economies advocate frugality, hence sustaining high saving rates which have been stimulating the capital accumulation; human capital growth has accelerated in East Asia because it sets great store on education; and, with the tendency to value the present life, people in East Asia generally work hard. These factors are helpful to the rapid economic growth.
After comparing the economic parameters of East Asian economies by per capita GDP, the proportion of the secondary industry relative to the tertiary industry and other indicators, we come to a basic conclusion: China’s economic development, per capita income, and living standard in 2010 are roughly close to that of Japan around 1968, Korea around 1991, and Taiwan (China) around 1987.
Table 1: Benchmark Analysis of the development phases of China, Japan, South Korea, and Taiwan (China)

Source: Essence Securities
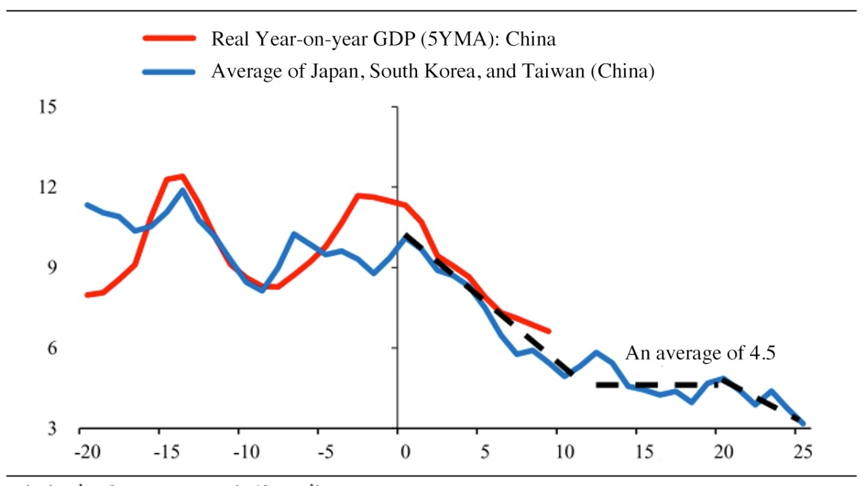
We compare their respective growth rates by taking the benchmark year as the first year, and as shown in Figure 1, since the first benchmark year (China 2010), China has shown long-term economic downturn with some fluctuations, with the growth rate dropping from 9-10% to around 5%.
When comparing this decade-long dip with the average real growth rate during the benchmark period of Japan, South Korea and Taiwan (China), it is found that after the per capita income level reaches a high level, the economic growth rate would go down for a long time.
Looking back, although China had panicked and worried when the growth rate declined, it is not that startling. China’s data, including the declined growth rate and the slope of the fall, are like those of neighboring East Asian economies. It is quite normal in an international context.
Figure 1: Real GDP Growth Rate in East Asia Economic Transition, %
Sources: Wind and Essence Securities
II. What happened before and after the transition of East Asian economy?
Based on these comparisons, it seems reasonable to understand China's economic process as a repetition of that of the East Asian economies. This may help us to understand and predict China’s economic growth.
And based on this conclusion, there are at least two questions:
First, why did all the East Asian economies experience long-term deceleration after benchmark year, that is, after the economic transition?
Second, why did such systematic decline happen in exactly the point of time?
For the first question, people then were not fully prepared for the early deceleration and tried to find various explanations, such as the rise of the service industry, its slower technological progress, or the impact of global financial crisis.
These explanations could be summarized as a universal law of economic analysis – diminishing marginal returns on capital. This law means that given constant levels of technological development, education, labor force, etc. of an economy, with the expansion of capital stock, its economic aggregate increases, but the growth rate of the aggregate slows down, resulting in smaller marginal returns on capital.
This theory is a cardinal and basic answer to the first question, hard to be observed when capital stock is low, but will always show up sometime in the future.
This stage is usually accompanied by a systematic decline in economic growth, most of which start after the Lewis turning point – a potentially most important answer to the second question.
To be more specific, prior to the Lewis turning point, the real income (adjusted for inflation) of the agricultural labor forces who have entered the industrial or service sectors is almost invariant; after the point, the income starts to escalate.
With the invariable real wage, the continuous replenishment of labor offsets the decline in marginal returns on capital, stabilizing the ratio before the turning point. After the turning point, non-agricultural sectors find it harder to obtain labor at this price and therefore the cost becomes higher and higher, reinforcing the impact of diminishing marginal returns on capital, leading to economic downturn.
Based on previous research and documents, China reached the Lewis turning point between 2005 and 2010, Japan, in the mid-1960s, South Korea and Taiwan (China), around the mid-to-late 1980s.
Ultimately, the fall of growth rates in East Asia after the benchmark year could be attributed to the explicit impact of diminishing marginal returns on capital after reaching the Lewis turning point.
So, how could we see this change in data?
Considering the data availability, calculation simplicity, and cross-country comparability, we deal with an important indicator: the Incremental Capital-Output Ratio, or ICOR.
It represents the amount of investment paid for one-dollar increase of output. The higher the ICOR, the more capital to be invested for output increase.
As shown in Figure 2, before 2007 China's ICOR was at around 3-4, but since then, this ratio has been rising. Before the outbreak of COVID-19, China’s ICOR rose to over 8, almost doubling in ten years, while the economic growth rate in the same period dropped from 9% to 6%.
Figure 2: The Incremental Capital-Output Ratio (ICOR) of China
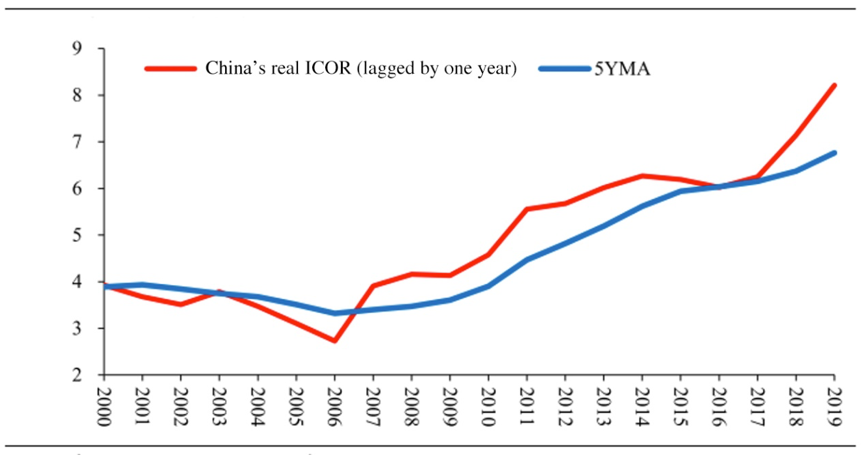
Note: An example of the algorithm of ICOR with one-year lag: 2000 ICOR = 2000 current price gross fixed capital formation / (2001 nominal GDP/2001 deflator-2000 nominal GDP). The 2019 ICOR is estimated with the adjusted 2020 GDP and deflator (calculated by geometric average growth rate in 2019-2021).
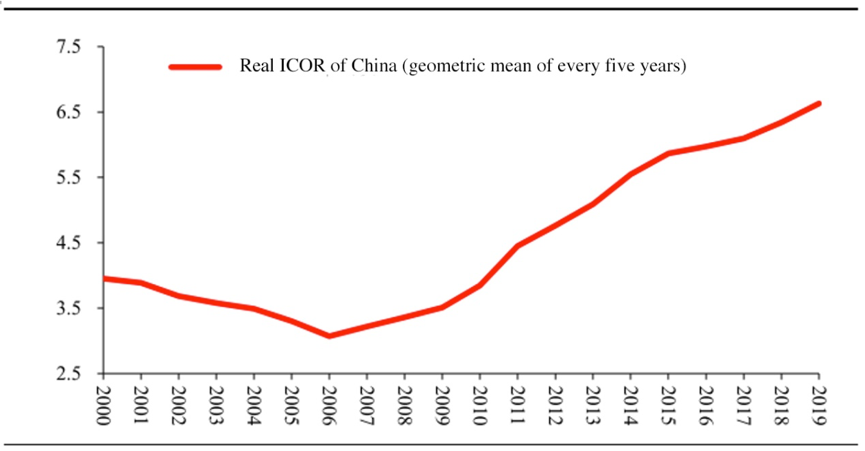
Considering the short-term disturbing factors to the data, in addition to annual data, we also calculate the five-year geometric average ICOR. As shown in Figure 3, the result is consistent with the former one, that is, China's ICOR has continued to rise in the past decade. It manifests the diminishing marginal returns on Chinese capital, which is also consistent with the downward trend of China's economic growth.
Figure 3: the Incremental Capital-Output Ratio (ICOR) of China (geometric mean of every five years)
Sources: Wind and Essence Securities
Note: The calculation of five-year geometric mean is the total of five-year fixed asset aggregate at constant price divided by five-year addition of GDP at constant price with one-year lag. The 2019 ICOR is estimated with adjusted 2020 real GDP.
How should we evaluate the significant decline in the marginal returns on China’s capital in the past decade?
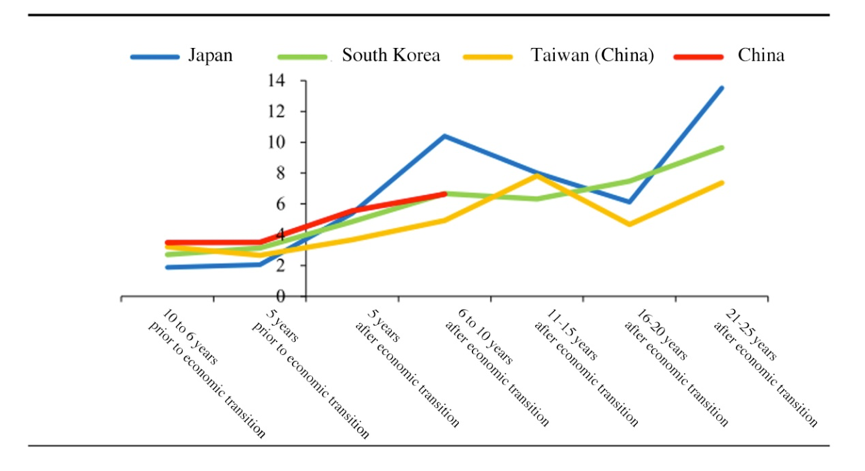
Following the same method, China is evaluated in the context of East Asia economic transition and benchmarked with Japan, South Korea, and Taiwan (China). As shown in Figure 4, before the transition, China’s ICOR was close to theirs at 3-4; afterwards the ICORs of the East Asian economies have experienced a longstanding rise, implying their continuous deterioration of the marginal returns on capital.
Therefore, the deterioration of China's ICOR after the transition is not significantly different from that of other East Asian economies. In the context of East Asian economic transition, the diminishing of China's marginal returns on capital is at a relatively normal level.
Figure 4: Benchmark ICOR during the Economic Transition in East Asian Economies (geometric mean every five years)
Sources: Wind and Securities
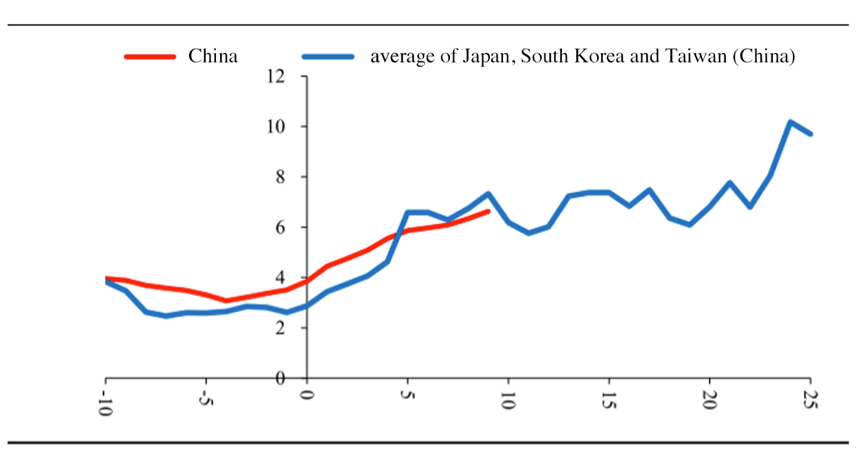
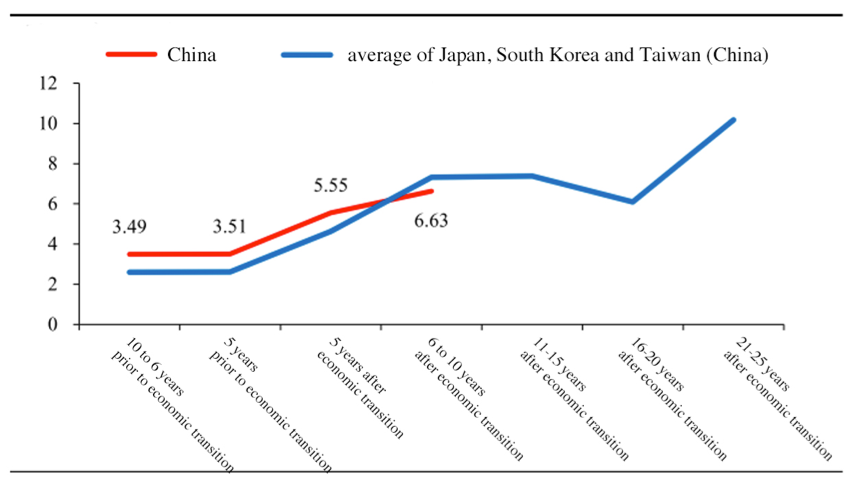
Besides, if comparing the moving average of each year and the vertical average of Japan, South Korea, and Taiwan (China), with the data of China, we can still find, as shown in Figure 5-6, that prior to the transition, China had similar marginal returns on capital with them at around 3-4; after the transition, the deterioration, its slope, and current situations are also basically normal.
Figure 5: Benchmark ICOR during the Economic Transition in East Asian Economies
(five-year geometric mean of each year)
Sources: Wind and Essence Securities
Figure 6: Benchmark ICOR during the Economic Transition in East Asian Economies
(five-year geometric mean)
Sources: Wind and Essence Securities
Diminishing marginal returns on capital means that each additional dollar of investment leads to less output, and therefore another way to observe this data is to study the returns on capital (ROC), calculated by dividing the income gained from capital by the amount of effective capital.
With a certain amount of capital stock, part of the benefits in the output of economic activities goes to the laborers, some to the government, and others to the capital holders. These benefits therefore include interests on debt capital, profits on equity capital, and some depreciation and production taxes. In this sense, the numerator of the ROC is the benefits that capital owners receive each year, and the denominator is the capital stock of the economy.
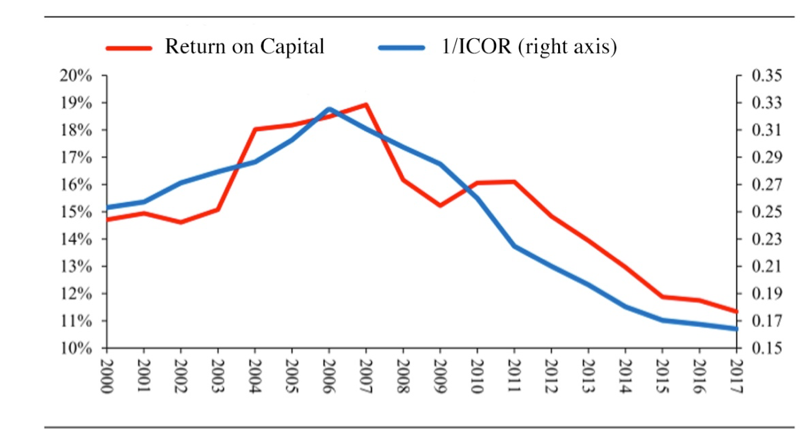
After processing the inflation and other data, the ROC calculated by this method, as shown in Figure 7, is close to the reciprocal of ICOR: before 2007, the average ROC of China was at a high level, especially in 2004-2008, but after 2010, China has suffered a ROC plummet, which clearly reflects the diminishing marginal returns on capital.
If the ROC is more direct than ICOR, why not use it in international comparison?
Statistically, due to consistent investment, fixed asset depreciation, inflation, etc. it is hard to account the capital stock of an economy, especially amid international comparisons. In the case of China, though the ICOR and ROC are not exactly synchronized, their potential trends are basically the same. The ICOR is an alternative to verify the ROC tendency.
Figure 7: China’s ROC and the reciprocal of the ICOR
Sources: Wind and Essence Securities
The above studies are all carried out from a macro perspective, but we believe that the ROC has a similar declining tendency at the micro level.
When regarding the social capital stock in practice, the capital holders include the SOEs, private enterprises, listed companies and other companies. The ROC at the macro and aggregate level then corresponds to the return on assets (ROA) of these enterprises.
To observe this micro-level change while considering typical individual samples, the research objects include the ROA of the listed companies, state-owned enterprises, and industrial enterprises (state- and non-state-owned enterprises).
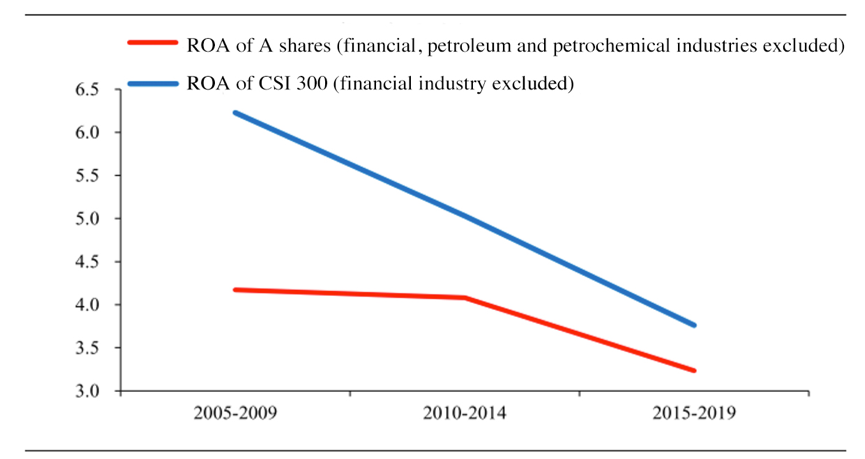
To avoid the disturbance of the pandemic, financial tsunami, policy stimulus, and other short-term factors, we take a five-year average for a more accurate reflection of the phased trend. As shown in Figure 8-10, in the samples of listed companies and state-owned enterprises (according to the list made by the Ministry of Finance), their ROAs have shown a downward trend in the past decade. It is worth noting that the ROA of non-state-owned industrial enterprises rose and fell, which may be related to the continuous changes of the sample; the stable ROA decline of the industrial SOEs could be attributed to the stability of the sample.
Figure 8: ROA of listed companies, % (average of every five years)
Sources: Wind, Essence Securities
Figure 9: ROA of state-owned and central government-owned enterprises
(according to the Ministry of Finance, average of each period)
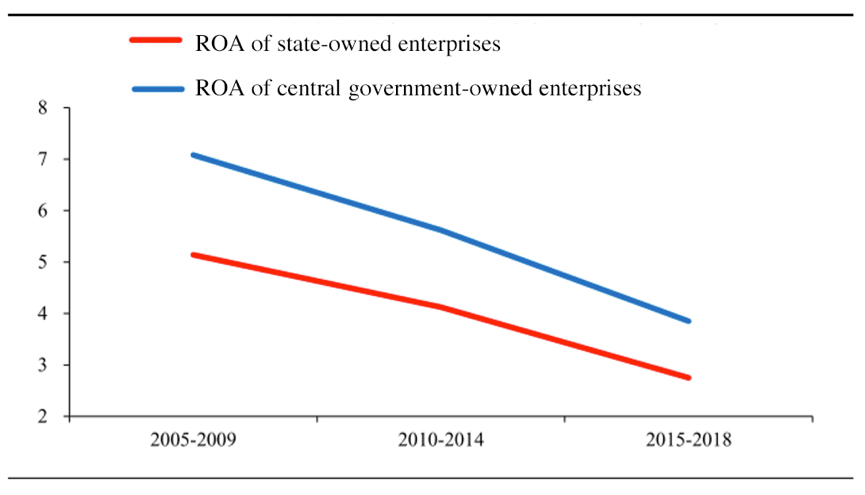
Sources: Wind, Essence Securities, as of 2018
Figure 10: Real ROA of industrial enterprises: state-owned and non-state enterprises, % (average of every 5 years)
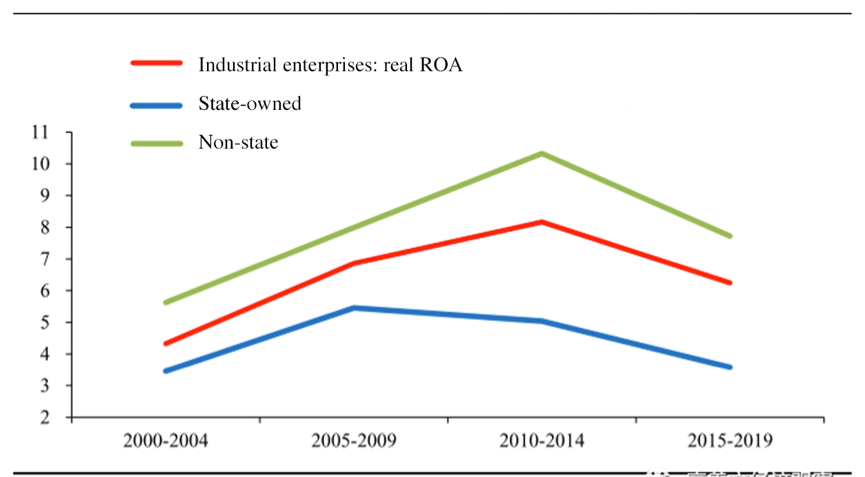
Sources: Wind, Essence Securities
The above data can lead to a conclusion that the ICOR and return on capital of the whole society have shown a declining trend, which is also consistent with most micro-fields represented by the ROA.
III. Anti-trend interest rates in China
During the past 15 years of China’s economic development, the universal law of diminishing marginal capital return has led to a slowdown in economic growth at the macro level and a corresponding drop in the rate of return on corporate assets at the micro level.
The return on capital is one of the key determinants of interest rates. In the context of its long-term downward trend, should interest rates go up or down?
According to accounting definitions, the return on assets of an enterprise is distributed to creditors and shareholders. The portion distributed to creditors forms interest, and that to shareholders profit. With the continuous decline in the rate of return on assets, the capital return faced by creditors and shareholders diminishes relative to the total amount of capital.
If interest rates remain unchanged or even rise, it means that creditors won’t see their return decrease. However, the shareholders will receive less given that the total capital return decreases. The reasonable approach should be the returns to both creditors and shareholders diminish simultaneously, which will cause the interest rates to drop accordingly. But is this inference in line with the reality?
First, given the representativeness of the interest rates of government bonds, we take the nominal interest rate of one-year government bonds as a sample and use the same benchmarking method mentioned above to study the interest rate performance of East Asian economies during the economic transition period. As shown in Figure 11, in a rather long period after the economic transition, with the decline in the marginal return of capital, interest rates of the one-year nominal government bonds in Japan, South Korea, and Taiwan (China) have shown a very clear and consistent downward trend.
Figure 11: Nominal interest rate of one-year government bonds during the economic transition of Japan, South Korea and Taiwan (China)
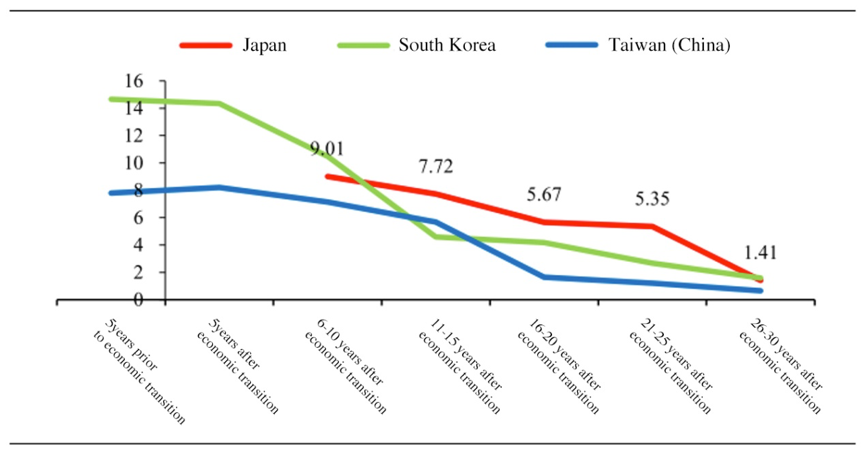
Sources: Wind, Essence Securities
Note: Interest rates in Japan were heavily affected by the interest rate control during its economic transition, so Japan’s data of this period was excluded.
However, when we look at the situation in China during its economic transition, as shown in Figure 12, the result is surprising. The nominal interest rate of China's one-year government bond experienced a very significant rise in the past 15 years. The interest rate was around 2.2% during the five years prior to the economic transition, while during the five years after the transition, it rose to 2.8% or even a higher level. This interest rate rise deviated from the trend of return on assets, and it was also against the trend of interest rates in other East Asian economies.
Figure 12: Nominal interest rate of the one-year government bond of China during economic transition, %
(average value of every five years)
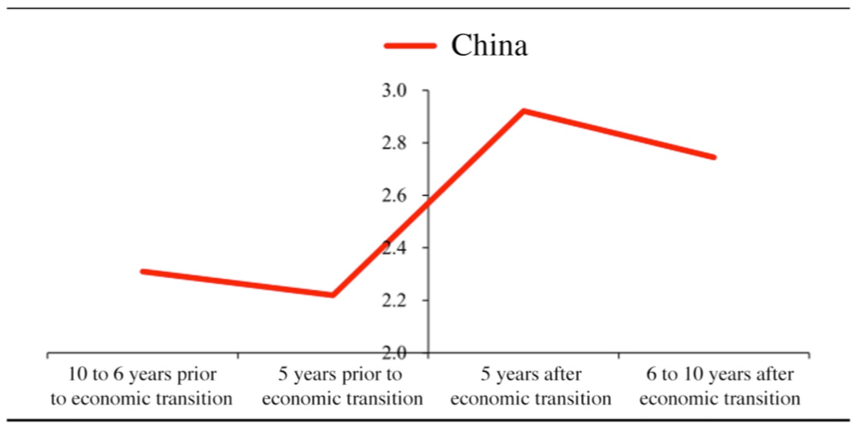
Sources: Wind, Essence Securities
There are problems with using nominal interest rates as the research sample here, that is, the impact of inflation cannot be eliminated. The most important way for inflation to affect the level of interest rates is by influencing capital prices through inflation expectations.
However, it is difficult to know inflation expectations from direct observation, and long-term inflation expectations are relatively sticky. For example, for long-term US government bonds such as 10-year Treasury Bond, the inflation expectations measured after deducting TIPS tend to overestimate the real inflation in some periods.
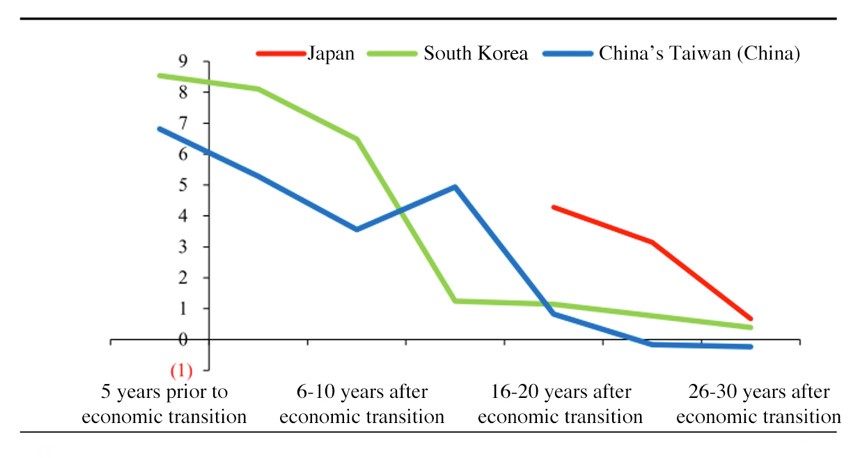
Therefore, we adopt a relatively simple method instead, which is to directly use the real inflation level (CPI) of the year as inflation expectations, so as to extract the real interest rate data from the nominal interest rate sample. As shown in Figure 13, from the interest rate changes of East Asian economies, we can see that this method does not affect the general conclusion, that is, in the long run, the interest rates of East Asian economies during the economic transition period all dropped constantly.
Figure 13: Real interest rate of one-year government bonds during the economic transition of Japan, South Korea and Taiwan (China) (average value of every five years)
Sources: Wind, Essence Securities
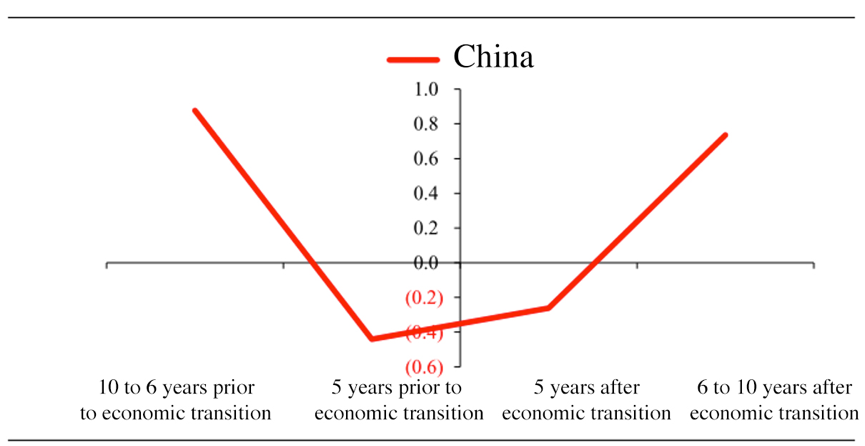
The performance of China's interest rates obtained by the same method is also consistent with previous conclusions. As shown in Figure 14, the real interest rate of China's one-year government bond after the country’s economic transition rose compared to that during the five years prior to the transition, and the increase grew more significantly in the later period.
Although the approach of eliminating inflation expectations has technical flaws, the trends reflected by this result are consistent, so we believe they are credible.
Figure 14: Real interest rate of the one-year government bond of China during economic transition, %
(average of every five years)
Sources: Wind, Essence Securities
Interest rates of government bonds only reflect the risk-free interest rate level of the entire economy, and in the context of the bank-dominated financial system of East Asian economies, the government bond interest rates are easy to be affected by factors such as bank controls. Moreover, for enterprises and a large number of private economic activities, the interest rate reflected by the yield of government bonds is not very representative, because enterprises are more faced with interest rates of loans and bonds in the credit market, which can better reflect the real financing costs.
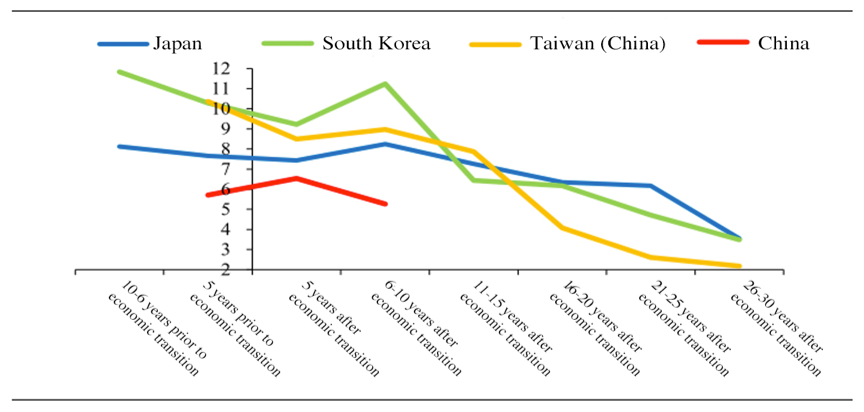
Therefore, we decide to have a look at the interest rates in the credit markets of East Asian economies. As shown in Figure 15, in the context of economic transition, the long-term downward trend of loan interest rates in Japan, South Korea and Taiwan (China) is clear and significant.
However, China's nominal loan interest rate rose in the first five years after the transition, and then fell slightly. However, this fall is relatively slight compared to the interest rate level of the five years before the transition and to the decline in the return on capital.
Figure 15: Nominal loan interest rates of Eastern Asian economies during economic transition, %
(average of every five years)
Sources: Wind, Essence Securities
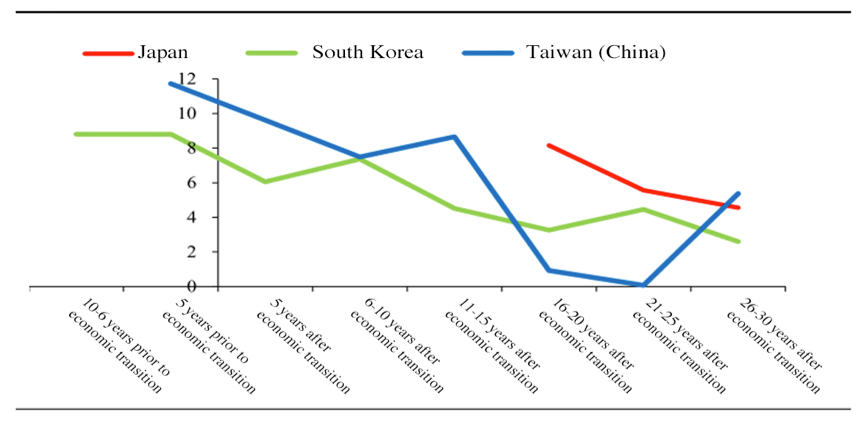
Similarly, after excluding the inflation factor, as shown in Figure 16, the real loan interest rates in East Asian economies showed a similar trend.
Figure 16: Real loan interest rates of Eastern Asian economies during economic transition, %
(average value of every five years)
Sources: Wind, Essence Securities
Note: Samples of Japan during interest rate control period are excluded. Real loan interest rates are calculated with PPI being excluded.
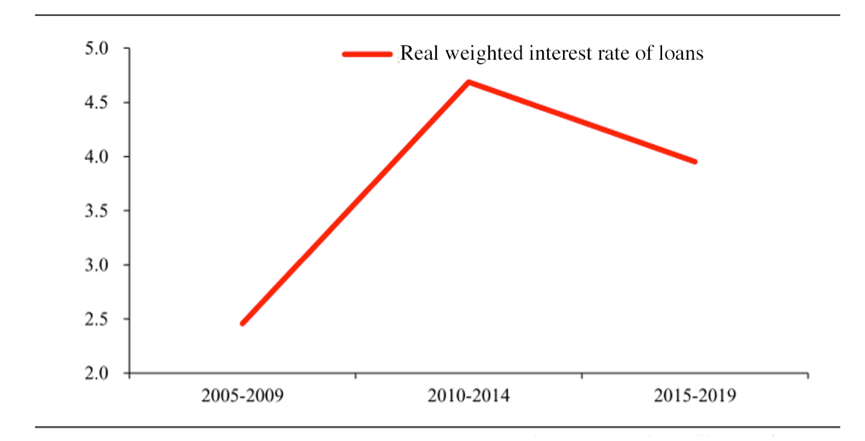
However, while the interest rates of other East Asian economies all saw a declining trend during the economic transition, China's real loan interest rate witnessed a sharp rise after the economic transition.
As shown in Figure 17, although it had experienced a decline in the five to ten years after the transition (2015-2019), the interest rate at that time was still higher than that before the economic transition. At the same time, the macro-level return on capital and the micro-level corporate return on capital were much lower than before. That is, the level of China’s loan interest rate did not decrease with the diminishing marginal return of capital, but instead it experienced a sharp rise.
Figure 17: Real weighted interest rate of loans in China during its economic transition, %
(average value of every five years)
Sources: Wind, Essence Securities
Note: The real weighted interest rate of loans is a weighted average of interest rates of financial institution loans, corporate bonds and trust.
During the later period of economic transition of East Asian economies, the downward trend of interest rate in the context of rising ICOR is rather obvious. However, China's data goes against the general trend, that is, against an economic slowdown and declining return on capital, China's interest rate has not seen a significant fall, but even witnessed an increase by some standards.
IV. Why is the anti-trend interest rate in China?
Why does the interest rate in China rise, instead of falling, contrary to other countries’ experiences?
What are the implications for the future trend of interest rate? How is it related to the many important structural changes in China's macro economy in the past 15 years?
To further study this issue, we will have some discussions next. These discussions will help us predict the trend of China’s interest rates in the next ten years and better understand China’s economic growth, capital market, real estate, and changes of economic policies over the past ten years.
The first important question, why is China's interest rate significantly lower than that of other East Asian economies both in the market of government bond and credit market at any point?
Perhaps this phenomenon can be attributed to the influence of interest rate control in the very early stage, but this influence has gone weak in the past decade.
We tend to believe that China's high savings rate is the main reason for this phenomenon.
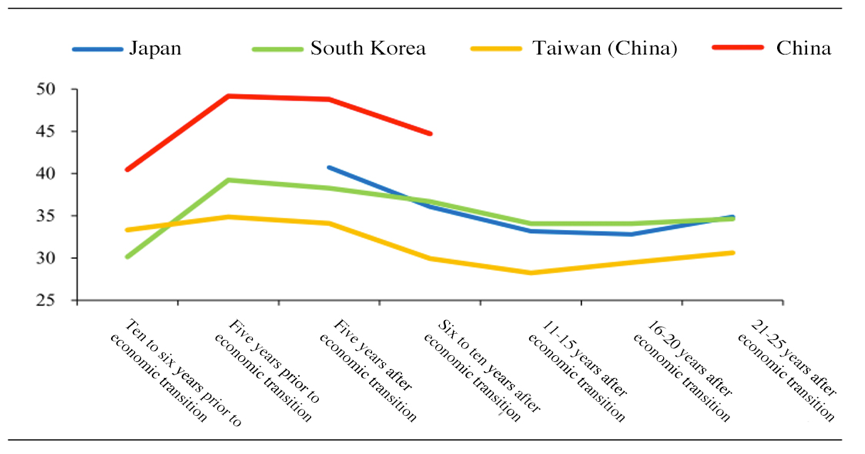
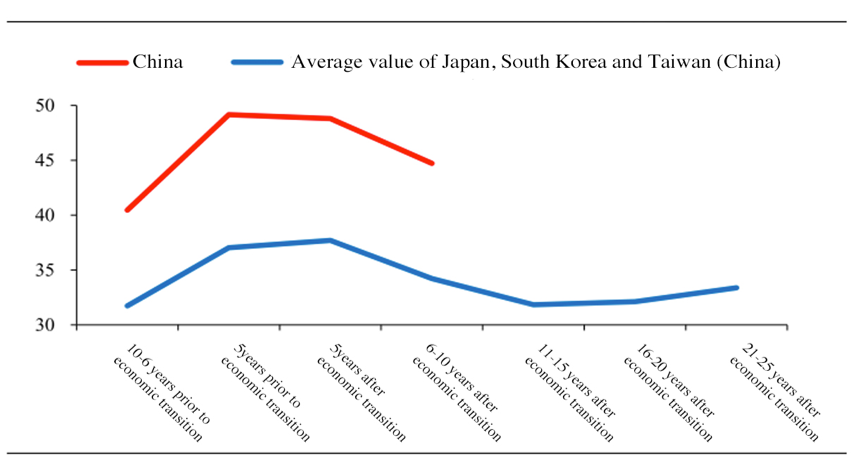
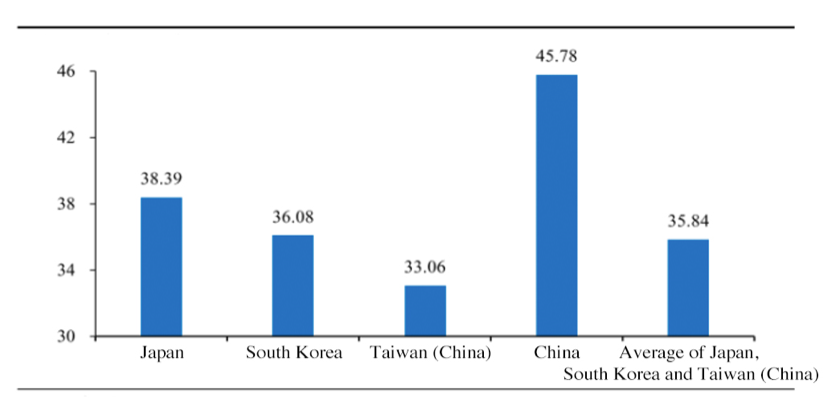
As we all know, the savings rate of East Asian Confucian economies is nearly 20% higher than that of European and American countries, or even more. However, as shown in Figure 18-20, the national savings rate of Chinese mainland is significantly higher than that of Japan, South Korea and Taiwan (China). A higher national savings rate means more capital supply, which in turn leads to a relatively lower interest rate level.
Moreover, the significantly higher national savings rate in China is not a temporary factor, the development of which is affected by many complex variables. Even in the medium and long term, its development remains slow. In the next ten or twenty years, we have every reason to believe that China's national savings rate will remain at a significantly higher position compared to other East Asian economies.
Figure 18: National savings rate of East Asian economies during economic transition, % (average value of every five years)
Sources: Wind, Essence Securities
Figure 19: National savings rate of East Asian economies during economic transition, % (average of every five years)
Sources: Wind, Essence Securities
Figure 20: National savings rate of East Asian economies during economic transition, % (20-year average)
Sources: Wind, Essence Securities
In addition, now we do not consider the possible impact of regional differences, and make samples of Japan, South Korea, and Taiwan (China) as a mixed data. Then let’s observe the long-term relationship between ICOR and the interest rates of government bonds and loans.
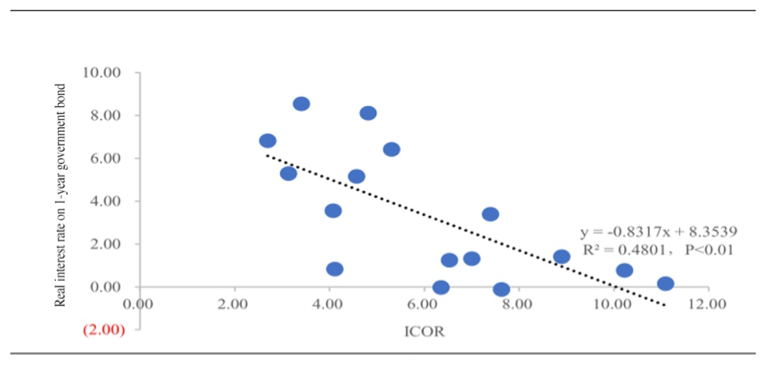
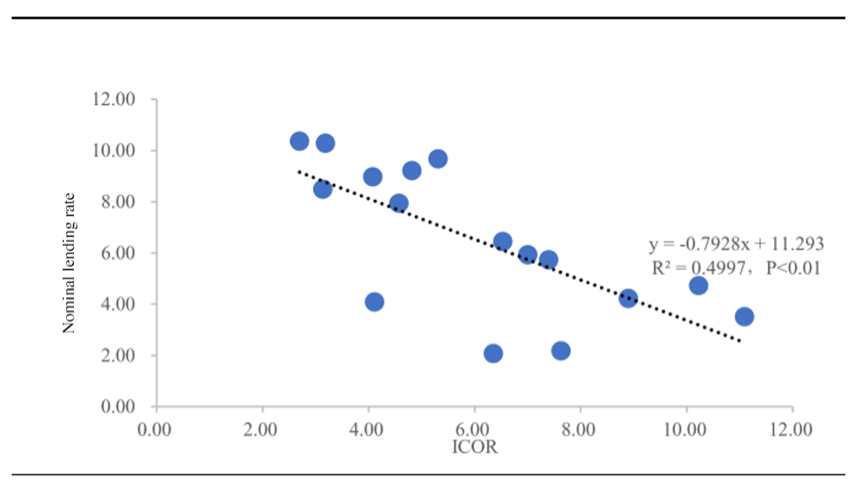
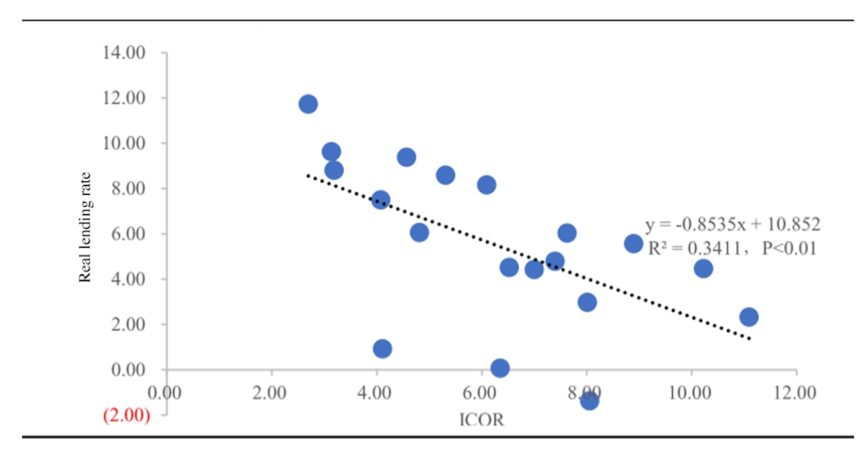
As shown in Figure 21-23, ICOR has a strong negative correlation with both the 1-year government bond interest rate and the lending rate. In other words, interest rate in general should be falling as return on capital declines.
Figure 21: ICOR and real interest rate on one-year government bond (average of every five years)
Sources: Wind; Essence Securities.
Note: three samples in Japan dating back to the 1970-80s when interest rate control was imposed have been excluded.
Figure 22: ICOR and the nominal lending rate (average of every five years)
Sources: Wind; Essence Securities.
Note: three samples in Japan dating back to the 1970-80s when interest rate control was imposed have been excluded.
Figure 23: ICOR and the real lending rate (average of every five years)
Sources: Wind; Essence Securities.
Note: Samples in Japan during periods with interest rate control are included.
We can have a clearer observation of the interest rate data in China.
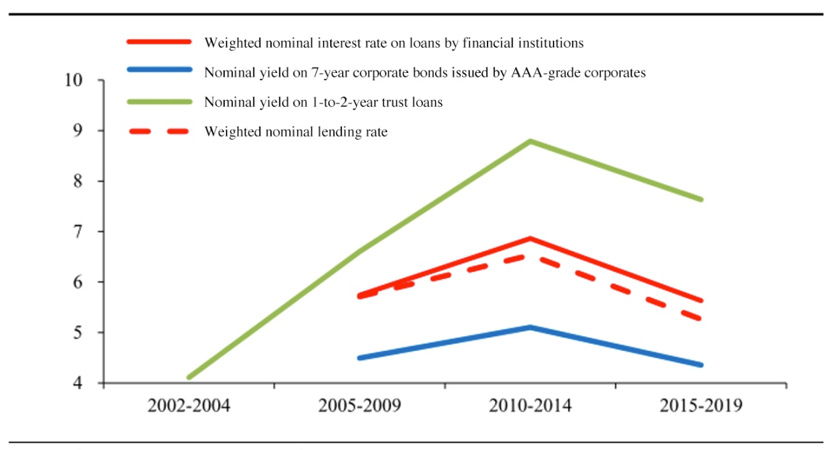
There are many types of loans available on the lending market in China, such as corporate debts, financial institution loans and trust loans. Given that China was still imposing interest rate control during 2000 and 2005, we mainly focus on the data after 2005.
As shown in Figure 24-25, the average interest rate of the different types of loans in China have basically gone up to various extents. Similar upward trend can be seen in the real interest rate after excluding inflation.
Figure 24: Loans, bonds and trust lending in China: Nominal interest rate (%, phased average)
Sources: Wind; Essence Securities
Notes:
(1) The weighted nominal lending rate is calculated by weighting the lending rate of financial institutions, the corporate bond rate and the interest rate on trust loans;
(2) Trust loan in 2018 and after is not weighted because it has been seeing negative growth since then.
Figure 25: Loans, bonds and trust lending in China: Real interest rate (%, average of each period)
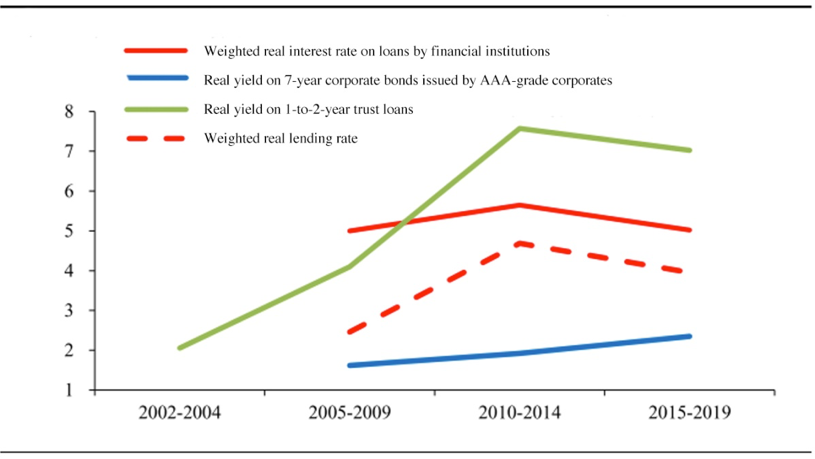
Sources: Wind; Essence Securities
Notes:
(1) The weighted real lending rate is calculated by weighting the lending rate of financial institutions, the corporate bond rate and the interest rate on trust loans; to be specific, CPI has been excluded in calculating the real interest rate on bonds, and PPI has been excluded in calculating that on loans;
(2) Trust loan in 2018 and after is not weighted because it has been seeing negative growth since then.
With the above in mind, let’s probe into the second issue, which is the reason why interest rate in China has risen instead of descending despite slower economic growth and a lower return on capital.
Based on the figures we have, we would like to make an important observation which is different from popular views.
Take house price for example. House price in China, especially in big cities, ballooned during 2010 and 2019, which is usually considered to be closely related or even attributed to monetary policy easing. However, our observation of the interest rate data has posed a severe challenge to this view.
If China did implement very loose monetary policy over the past decade, its interest rate should have stood at a very low level because only a low interest rate can lead the house price to surge. However, during 2005 and 2009 when interest rate was even lower, house price only went up moderately; while during 2010 and 2019 when the interest rate heightened, China witnessed sharper and wider house price hikes. This observation has challenged people’s general understanding of this issue.
The house price hike was actually speeding up when the interest rate increased. This reminds us that it would be biased to attribute the house price hike completely to monetary easing. There may be some other more deep-seated and important reasons behind.
Understanding this will help explain the performance of the Chinese economy, the capital market and the real estate market; and based on this, we would be able to make logical and more confident predictions as regards the trend of the long-term interest rate.
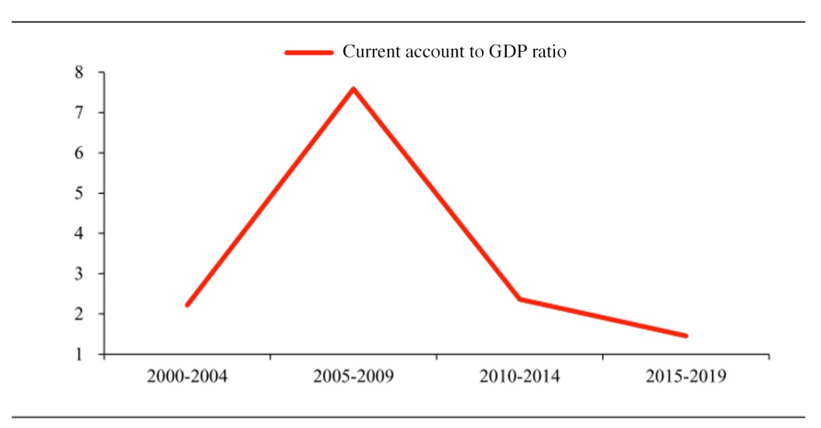
Examining fluctuations in the data over the past 15 years, we have come to the conclusion that the first key reason behind the interest rate hike in China was that RMB was under huge appreciation pressure during 2005 and 2010.
With an inflexible exchange rate formation mechanism, it was difficult to significantly adjust RMB exchange rate on a timely basis, and that translated into an extremely big current account surplus, or a huge foreign exchange reserve.
The People’s Bank of China (PBC) had to keep the interest rate low to counter the appreciation pressure on the currency.
The pressure gradually disappeared starting from 2010, owing externally to the appreciation of the US dollar and the global financial turmoil, and internally to the fact that RMB’s value had already risen much, the cyclical fluctuation of the Chinese economy, and negative changes in productivity.
These factors combined have led to a fast recovery in China’s current account to a relatively balanced status as shown in Figure 26, eliminating its repressive effect on the monetary policy and the interest rate. As a result, the interest rate experienced a compensatory rebound.
Figure 26: China’s current account to GDP ratio (%, average of every five years)
Sources: Wind; Essence Securities
The exchange rate is an important dimension when we try to understand and explain the economic statistics of China over the past decade. It also reminds us that for an economy as large as China, a flexible regime for exchange rate formation is critical. Its absence could significantly distort macroeconomic policies.
Of course, exchange rate alone was not enough to explain all the interest rate changes. Many other factors were at play, especially for the years after 2010.
We hereby propose another two interrelated factors, reflected in data at both the macro and the micro level, that are critical to understanding the interest rate changes in the past decade.
First, the vibrant government infrastructure financing activities over the past ten years have played a part driving up the interest rate.
China’s long-term economic growth has been declining over the past decade. The Chinese government may have deemed this as a cyclical phenomenon, feeling it pressing to stabilize growth over a long period of time, and one of the most important way to this end is to boost spending on infrastructure.
The drive to expand infrastructure investment in order to stimulate aggregate demand has generated huge demand for financing at both the central and the local level, and various means of financing have appeared. Government financing is less subject to fiscal, budget, capital or interest rate constraints compared with the real economy, which is why the government sector, especially local governments, had remained insensitive to interest rate changes over a long period of time.
This has, on the one hand, led to fast increase in the leverage ratio, which has stayed high, accompanied by mounting financial and fiscal risks including shadow banking, and on the other hand, pushed up the general interest rate level that in turn crowded out the private sector and the real economy and suppressed the stock market as well.
This may have evolved into a vicious cycle, where the government pushes up the interest rate by expanding infrastructure spending in order to stabilize economic growth while massively pooling funds in the credit market, which stems private investment demand and expenditures and thus decelerates economic growth, and this would only prompt the government to further step up its financing activities in support of infrastructure building to stimulate growth.
Second, there has been strong expectation for house price hikes among households and real estate businesses.
Among Chinese households, there probably hasn’t been much expectation for inflation, but there has been strong expectation for house price hikes.
What are the reasons behind this, and what implications could it have?
Let’s start with the implications. The most important implication is that rising expectation has generated strong motivations driving households and real estate businesses to leverage up, because at this time the real interest rate they are facing is the nominal rate less the rise in house price, rather than the nominal rate less the CPI or PPI.
With strong expectation for house price rise, the real interest rate that households and real estate businesses have to bear is quite low—this has significantly boomed financing demand and elevated the lending rate; a higher interest rate will inhibit private capital expenditure and drag economic growth, leading the government to inject stimulus into the real estate market and boost infrastructure spending. This is the vicious macro cycle with its source in the real estate market that may actually exist as well.
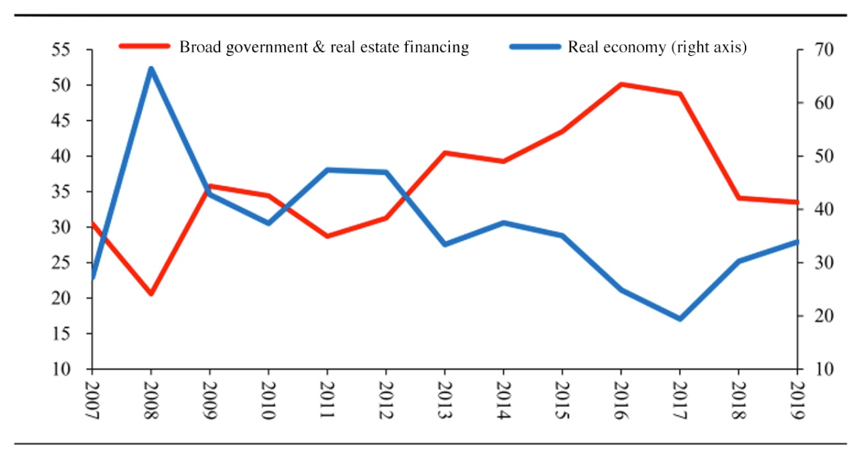
Data suggests the proportion of broad government and real estate financing in total social financing each year spiked during 2010 and 2017, as shown in Figure 27. The proportion rose from less than 30% in 2010 to over 50% in 2017; at the same time, proportion of financing by the real economy plunged.
China was having a huge marginal influx of funds into areas related to infrastructure building and real estates. The government was happy to obtain funds at very high interest rates, but they were not concerned with the return at all; real estate developers were happy with financing, too, given the rigid payment regime and the strong expectation for price hikes which was also the reason why households were willing to pay high interests as well.
All these factors combined have brought about an abnormally high level of interest rate in China over the past decade. On the macro level, this may have pared down private capital expenditures and thus, started a self-reinforcing vicious cycle.
Figure 27: Proportion of additional debt in total social financing: the real economy and broad government & real estate financing (%)
Sources: Wind; Essence Securities
Note:
(1) Broad government and real estate debt = (government debt + local government debt + loans and debts raised by local government investment and financing platforms) + (trust loans + entrusted loans) * 80% + loans for real estate development + household mortgage loans + bonds issued by China State Railway Group (formerly Ministry of Railways of China);
(2) Real economy debt = (loans + corporate debts – debts raised by local government investment and financing platforms as in the total social financing statistics) + (trust loans + entrusted loans) * 20% - loans for real estate development - bonds issued by China State Railway Group.
Let’s then go back to the first question on what have driven such high expectation for house price hikes.
To start with, monetary policy easing is not the one to blame given the high level of interest rate, and there must be other factors to explain it.
First, after 2012, despite the concentration of population in big cities, supply of residential land in these cities has not increased accordingly because of policy reasons; the supply even declined in some of the major cities compared to the pre-2010 level, which put much pressure on the fundamentals of the demand-supply balance.
Second, the Chinese government has, at least for a while, attempted to stabilize or stimulate the economy with loose policies on the real estate sector. In earlier days, the government would take expansionary measures in the real estate market whenever the economy goes down, thus raising the house price, temporarily at least.
To sum up, factors contributing to a strong expectation of house price hikes among households and real estate businesses include China’s land system, population movement, the fact that the government took real estate policy as an important anti-cyclical regulatory means, the prevailing rigid payment regime, as well as the general upward trend in the house price over the past 10 to 15 years, among others.
An analysis of all these key factors shaping the long-term interest rate in China—be it the exchange rate or the vicious cycle between infrastructure investment and real estate stimulus—demonstrates that interest rate in China has been abnormal over the past 10 to 15 years. This explains why it has been rising rather than declining, the question that we raised hereinabove.
V. Where will the long-term interest rate in China go?
Now that we’ve figured out the reasons behind the trend in the interest rate in China in the past, let’s look ahead at where the long-term rate will go. To predict the future course, we will have to answer four questions.
First, China’s had the situation where systemic RMB appreciation pressure depressed the interest rate to an extremely low level; vice versa, the disappearance of the pressure later led the interest rate to bounce back. Will this repeat in the future?
We don’t see it likely that the situation could reoccur, because the RMB exchange rate formation mechanism is already rather flexible now.
Second, will the high savings rate in China suddenly take an unusual deep dive one day with no rebound anytime soon?
Judging from the long-term data of other East Asian economies, savings rate is a rather slow variable, and so a sudden slump is unlikely to happen.
Third, will the strong expectation for house price hike and the abnormal boom in related financing demand, including the huge demand for infrastructure investments, sustain in the coming decade?
This abnormal boom might as well be brought to an end, whether in terms of the effects of the deleveraging policies the Chinese government has taken over the past years, or in terms of sustaining stable development over the long run. With the launch of the deleveraging drive in 2018, additional debts in the government and the real estate sector have remarkably fallen, while those in the real economy has risen. This indicates a critical policy turn, which is that in the future, the government will not continue to stimulate the economy with loose real estate policies and massive infrastructure investments.
Fourth, will the ICOR in China continue to rise in the coming decade? And will the marginal return on capital continue to decline?
We predict that somewhere around 2030, China’s economic growth will fall to the 4% level, and the ICOR and return on capital will thus marginally weaken accordingly.
Against such backdrop, it’s safe to conclude that the rise in the interest rate in China and the fact that it has stayed at a high level are abnormal phenomena, and these will be systemically corrected in the next five to ten years.
By “systematically corrected”, we mean that the interest rate will be pared down to where it is supposed to be had there not been any distorting factors at play over the past five to ten years, and even lower.
Given the constant rise in the ICOR and that the high savings rate in China will inevitably result in a lower interest rate, we expect the nominal interest rate of long-term government bonds to gradually fall to the 2% level in 2030, and all related interest rates will go down significantly as well.
The decline in the interest rate will have positive impacts on the equity market, on private-sector capital expenditure, and on the efficiency of the entire economy.
Download PDF