
Abstract: Lessons of the stagflation of the 1970s suggested that negative supply shocks and wrong monetary policy responses were the two necessary conditions for stagflation. Currently, many economies are experiencing the highest inflation in four decades, and the momentum of the global economy is quickly slowing. Short-term and medium to long term factors point to a perfect storm of negative supply shocks, while central banks in major developed economies are significantly behind the curve in containing inflation and may continue to make policy mistakes. Notwithstanding the important differences between today and the 1970s, the risk of global stagflation should not be underestimated. Global stagflation will impact the Chinese economy through multiple channels, therefore preparations should be made.
Key words: Stagflation, supply shock, monetary policy
I. GLOBAL STAGFLATION MAKING A COMEBACK?
Global stagflation for the purpose of this article refers to a state where the global economy experiences both slow growth and high inflation over a medium to long period of time (e.g. over the next 2-5 years), which is different from the coexistence of slowing growth and high inflation in the short run within an economic cycle (e.g. in the coming 6-12 months). That is to say, “stagflation” in this article depicts a state lasting over the medium to long run that is neither a near-term downturn with rising inflation across economic cycles nor one where there is no possibility for any short-term growth recovery or decrease in inflation.
Analysis suggests the risk of global stagflation has significantly increased, and there seems to be no ideal strategies to cope with it given the current global geopolitical and economic landscape.
1. Global inflation has been high for years, with economic slowdown inevitable
The ongoing impacts from the COVID-19 pandemic, coupled with shocks from the Ukraine crisis, monetary tightening by developed economies and cooling demand, have further exacerbated both “stagnation” and “inflation”.
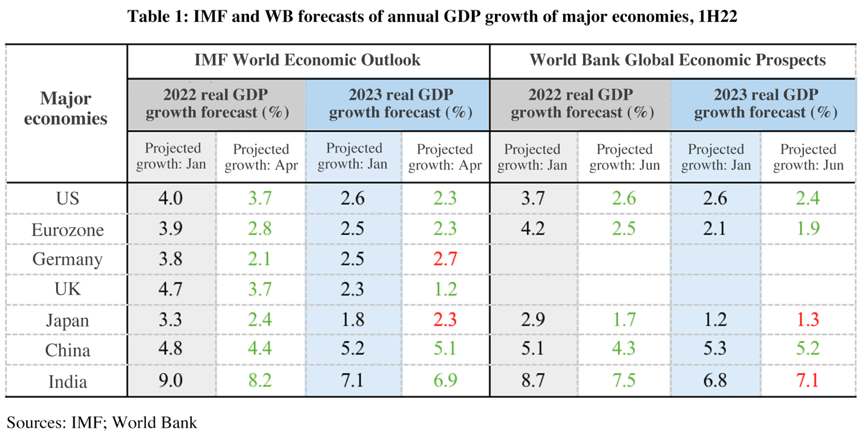
From the stagnation point of view, major international organizations (IOs) have lowered their forecasts of global GDP growth, indicating increasing pessimism toward future economic development. The World Bank reduced forecast of global GDP growth in 2022 in Global Economic Prospects it released on June 7 to 2.9% from 4.1% at the start of the year. Specifically, it predicted that GDP of developed economies would grow by 2.6%, rather than 3.8% as projected earlier, and that of emerging market economies, by 3.4%, down from 4.6% previously. On June 8, the Organization for Economic Co-operation and Development (OECD) adjusted its forecast of global economic growth in 2022 from 4.5% to 3%, while cautioning against further slowing to 2.8% in 2023.
Among major economies, Europe invited greater pessimism from IOs than others amid impacts from the Ukraine crisis. In April, the International Monetary Fund (IMF) slashed growth forecasts of major economies in 2022. Germany, the Eurozone, Japan and the United Kingdom suffered the biggest downward revision, of 1.7, 1.1, 1.1, and 1.0 percentage points respectively; while the prospects for United States, China and India were lowered by less—0.3, 0.4 and 0.8 percentage points respectively. The World Bank further pared down the growth prospects of major economies in June, with that of the Eurozone, Japan, India, the US and China respectively down by 1.7, 1.2, 1.2, 1.1 and 0.8 percentage points.
From the inflation point of view, global inflation hit 7.8% in April, the highest since the global financial crisis (GFC) in 2008. Inflation in major economies has surged since early 2021, from 0.5% in January 2021 to 7.0% in April 2022 in developed economies, and from 3.1% to 9.4% in emerging economies. Inflation in developed economies have reached a 40-year high. The US, Germany and the UK had inflation that soared from 3.8%, 2.4% and 2.5% in January 2021 to 8.4%, 7% and 7.3% in April 2022. The outbreak of the Ukraine crisis has further steepened the rise across economies.
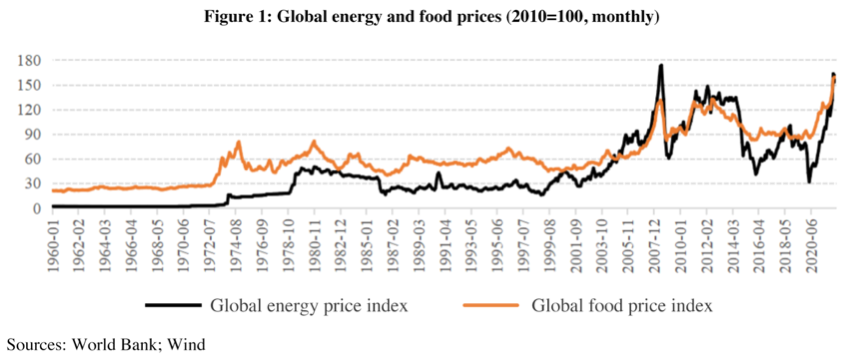
On commodities, World Bank’s energy price index rose to as high as 160.9 in May 2022, the highest since the GFC, up by 86.5% year on year. Global food price index reached a historical high of 159.0, rising 24.6% year on year.
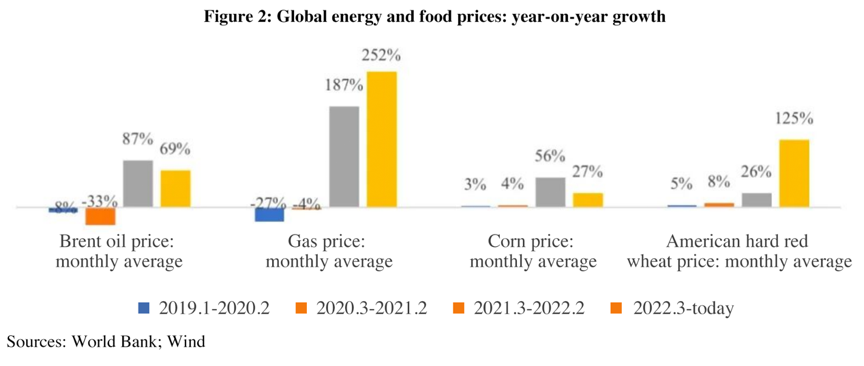
During March 2021 and February 2022, the monthly average of global Brent crude oil price and gas price jumped by 87% and 187% year on year, while the monthly average of corn and wheat price rose by 56% and 26% year on year. Since the Ukraine crisis broke out, global gas and wheat prices further surged—their monthly average increased by 252% and 125% year on year during March and May.
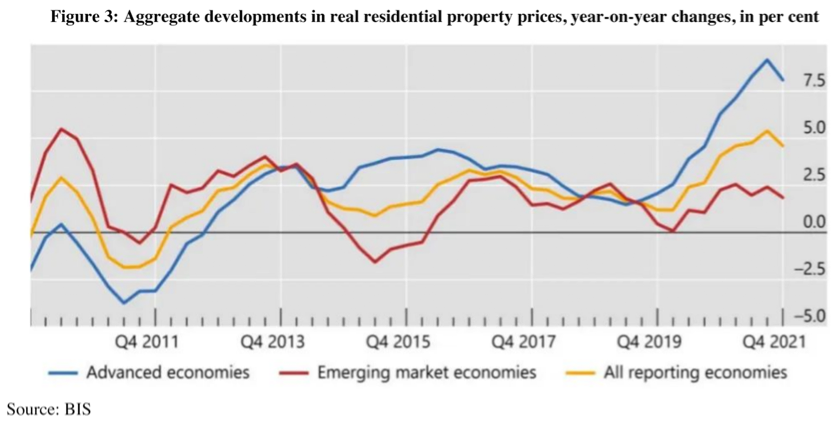
On housing, according to the Bank for International Settlements (BIS), in real terms, global house prices now exceed their immediate post-GFC average by 27%, and by 37.0% and 19.2% for advanced economies and emerging market economies, respectively. Among the G20 economies, real prices have risen the most—by more than 50% since 2010—in India, Canada, Germany, the United States and Turkey. After COVID-19 broke out, growth in global house price has further swelled significantly above the trend since 2010. In Q4 2021, year-on-year growth in global real house price, while having slowed compared to Q3 to 4.6%, was still at a historical high; the figure in developed countries have risen by over 7.5% for quarters in a row. Zhu He and Sun Zihan at CF40 previously noted that house price in some of the European countries have significantly deviated from their economic fundamentals.
Transitory inflation surge and economic slowdown at the turn of economic cycles, while also making things hard for the economy and macro policies, wouldn’t incur excessive costs beyond a normal, moderate recession, which could end in a soft landing with a bit of luck. But based on the review of the 1970s episode of stagflation hereinbefore, we believe the risk of the global economy heading into a sustained stagflation has surged amid the combination of supply-side shocks and (likely) wrong monetary policy response.
2. A supply-side perfect storm
The global economy is facing a perfect storm from supply-side shocks both in the short term and the mid to long run. There are mainly two short-term supply-side shocks:
First is the lingering impact of the COVID-19 pandemic and its short-term implications on the global supply chains. The pandemic has been disrupting the global supply chains in various ways since it broke out over two years ago.
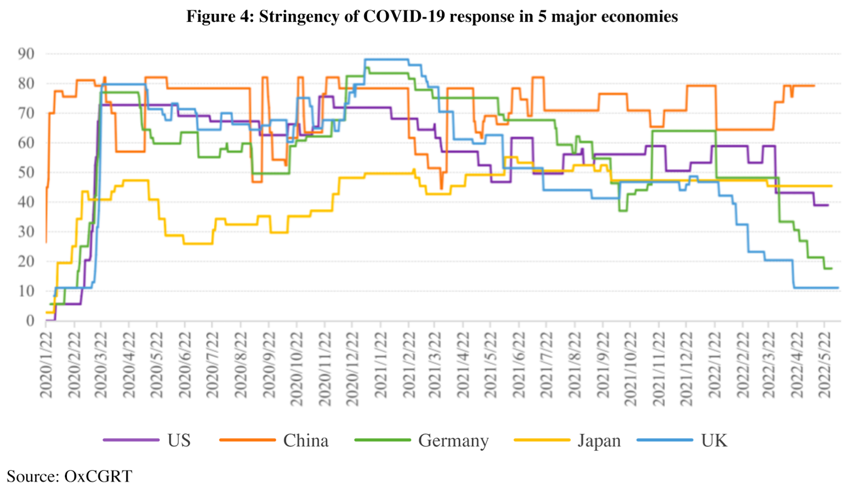
For one, COVID control policies implemented across countries have had inevitable impacts on the flow of people and goods. Figure 4 displays the level of pandemic control measured by the stringency of COVID-19 response across major economies according to the estimates of Oxford COVID-19 Government Response Tracker (OxCGRT). Among the 5 major economies, the stringency of response in China and Japan has been remarkably higher than that in the US, Germany and the UK Control measures are still in place across all these economies, and so we have yet to fully resume the pre-pandemic normal.
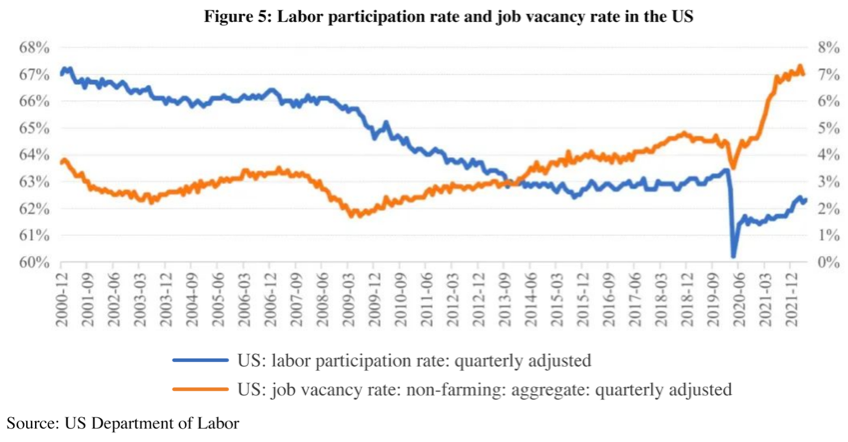
In addition, the pandemic has had lasting implications for the labor market. Hysteresis in the labor market as a result of COVID will affect labor supply over a rather long period of time, with many workers quitting or postponing the return to their posts. In the US, labor supply has been sluggish especially in comparison to the brisk demand. In January 2022, labor participation in the US bounced back to a post-pandemic high of 62.2% and has stayed above 62% ever since; but that’s still lower than the pre-pandemic level (February 2020) of 63.4%. Correspondingly, American businesses are facing a shortage of labor, with the job vacancy rate staying at a historical high of 7% and above ever since the start of 2022, considerably higher than the pre-pandemic level (February 2020) of 4.4%. The severe supply-demand imbalance in the labor market will add to short- and medium-term pressure and continue to push up inflation.
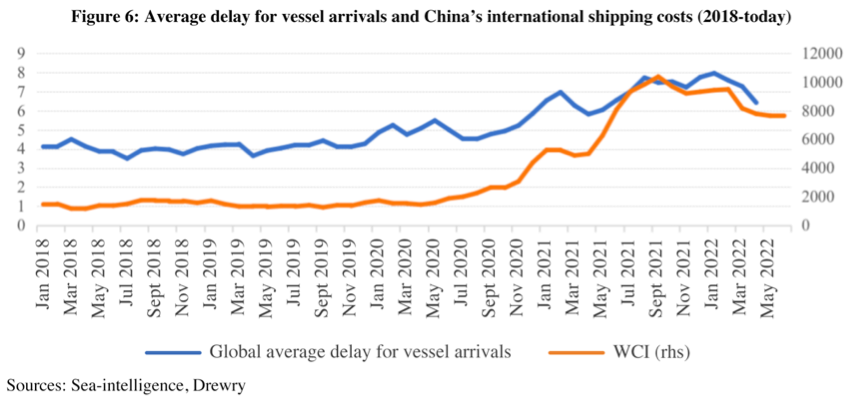
What’s more, container shortage and port congestion during the pandemic have led to skyrocketing shipping price and prolonged shipping time. COVID-induced shortage in shipping capacity has exacerbated supply-demand imbalance, driving up shipping prices. According to the Drewry World Container Index (WCI), global container price continued to surge starting from the onset of the pandemic to a historical height of 10377.2 in October 2021, after which it fell back but has yet to return to the pre-pandemic level. On shipping time, COVID control policies have congested major ports around the world. According to Sea-Intelligence, a shipping advisory institution, vessel delays have averaged around 6-8 days since the pandemic, much longer than the pre-pandemic 4 days.
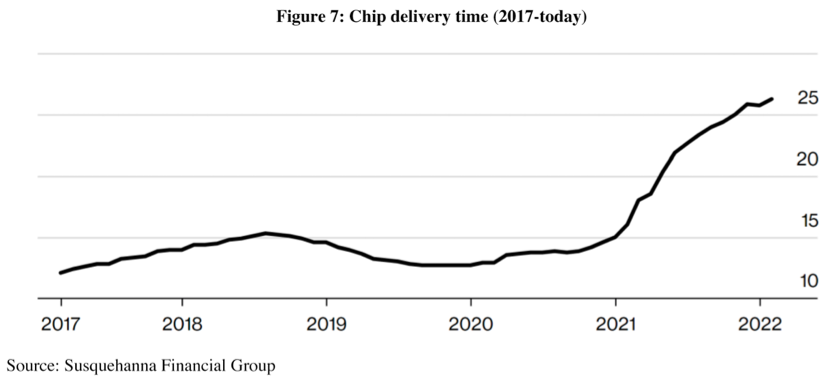
Besides, global chip shortages that have emerged in mid 2020 amid COVID’s blow have had wide impacts. Figure 7 shows the global average chip delivery time (from order placement to delivery) measured by Susquehanna Financial Group. It’s clear that delivery has been significantly delayed starting from the second half of 2020, before reaching the historical high of 27.1 weeks in May 2022, much longer than the pre-pandemic average of 15 weeks. The automobile industry has borne the brunt of the blow. With COVID controls lifted in the second half of 2020, automobile makers rebounded faster than expected, only to find themselves amid a severe chip supply shock because many chip providers had channeled spare capacity toward other industries including electronic devices. According to data from a 2021 White House report, chip shortage has bitten a whopping 110 billion USD off global car manufactures in 2021 and reduced car output by almost 4 million units. At the same time, chip shortage was beginning to infect other sectors. A total of 169 sectors have been shocked to various extents by it, including steel, concrete, air conditioner and beer production.
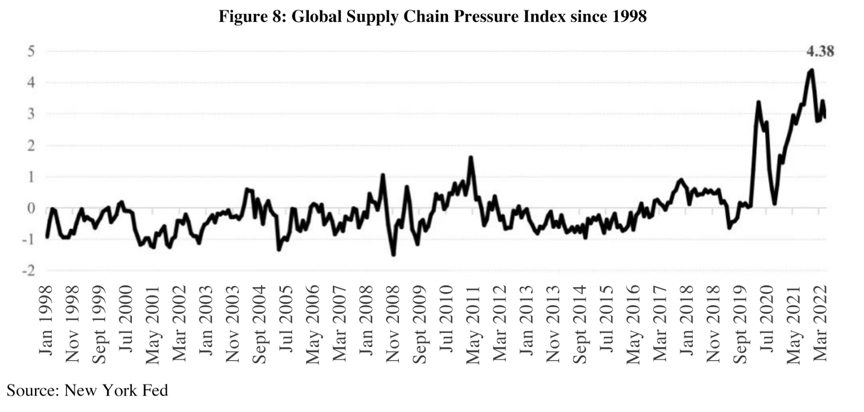
Global supply chains have been under huge strain ever since the pandemic. Figure 8 displays the Global Supply Chain Pressure Index released by the New York Federal Reserve aggregating 27 different variables. It includes statistics on global transportation costs and regional manufacturing data of seven economies to track the changes in the level of pressure on supply chains since 1997. The Index surged after COVID broke out, peaked at 4.4 at the end of 2021, and did not fall until early 2022. However, the Ukraine crisis and COVID resurgences have delayed delivery which pushed up the Index again in March 2022. All of the impacts on prices can be deemed supply-side shocks. It’s exactly because these shocks appeared to have been caused by the pandemic and were expected to subside as the pandemic wanes, major central banks including the Federal Reserve once thought inflation to be transitory.
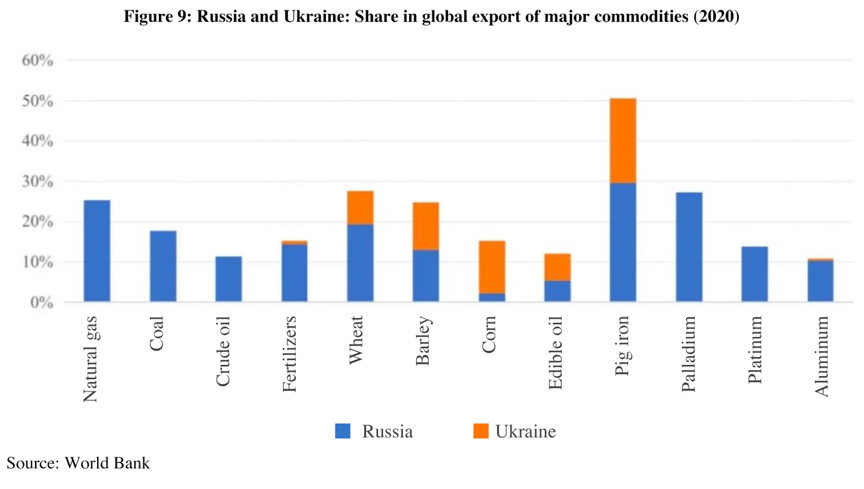
The second short-term supply shock is global energy and food crises triggered by the Ukraine crisis. Russia is a major gas and oil provider, while both Russia and Ukraine are major producers and exporters of food, oil crops, fertilizers and metals. As shown in Figure 9, both countries account for over 10% of global export of major commodities—over 20% when it comes to natural gas, wheat, barley and palladium.
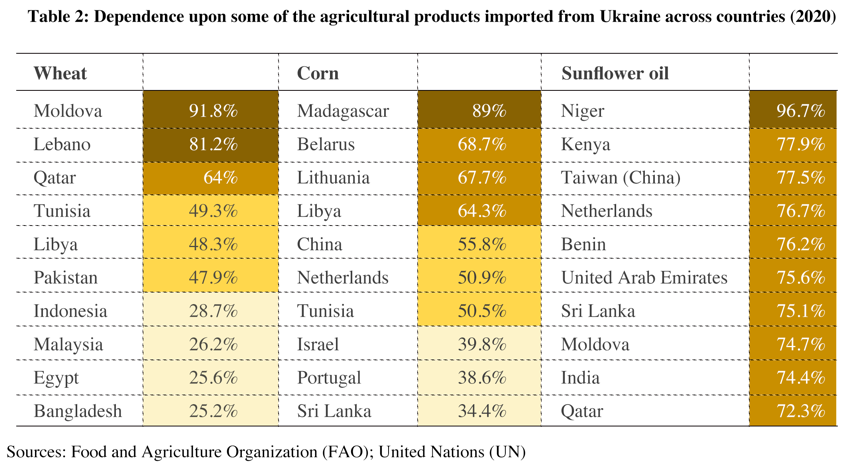
Some countries are highly dependent on exports from the two countries. Europe is highly dependent on Russian oil and gas. According to Eurostat, 12% of the oil and 8% of the gas in Europe come from Russia. Many countries rely heavily on Ukraine to provide some of the agricultural products. As shown in Table 2, Ukraine accounts for over 50% in the total food imports of some of the countries, even 80-90% for a few of them. Russia-Ukraine conflicts have undoubtedly added to global energy and food supply pressure in the short term.
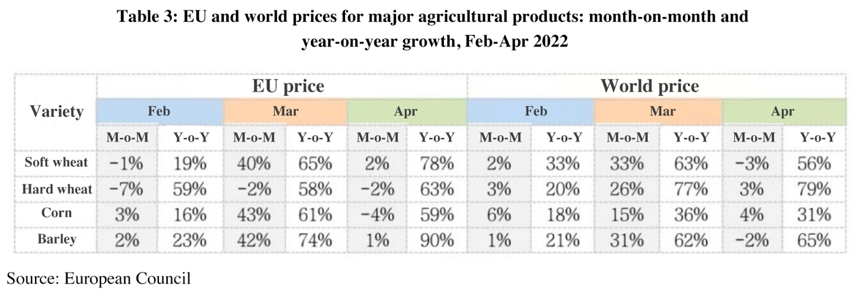
As of the end of May, Brent crude oil price and European natural gas price rose by 17.4% and 9.6% from February since the war broke out; monthly year-on-year growth in May were 235% and 65.2% respectively. Global price for (soft) wheat, corn and barley experienced two-digit month-on-month growth in March, while the growth in EU price for these agricultural products was even higher than the world average by over 10%. While month-on-month growth plunged in April, the year-on-year growth was still been much higher than before the war.
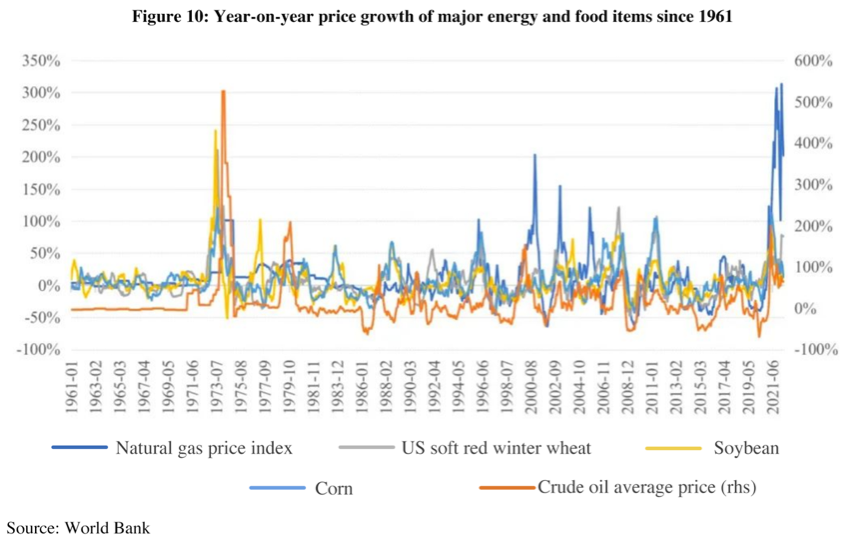
The Brief No.2 released by the UN Global Crisis Response Group (GCRG) on Food, Energy and Finance on June 8 notes that “rising food prices, rising energy prices, and tightening financial conditions” are unfortunately starting to “feed into each other creating vicious cycles”. “Higher energy prices, especially diesel and natural gas, increase the costs of fertilizers and transport, both factors increase the costs of food production. This leads to reduced farm yields and even higher food prices next season. These, in turn, add to inflation metrics.” Recent increases in the prices of crude oil, natural gas, and food are comparable to the oil and food crises that triggered stagflation in the 1970s (Figure 10).
However, what is more worrisome is how pessimistic the supply-side outlook is for the medium and long term in at least six aspects.
(1) Global productivity growth has been slowing for many years, with no reversal in sight.
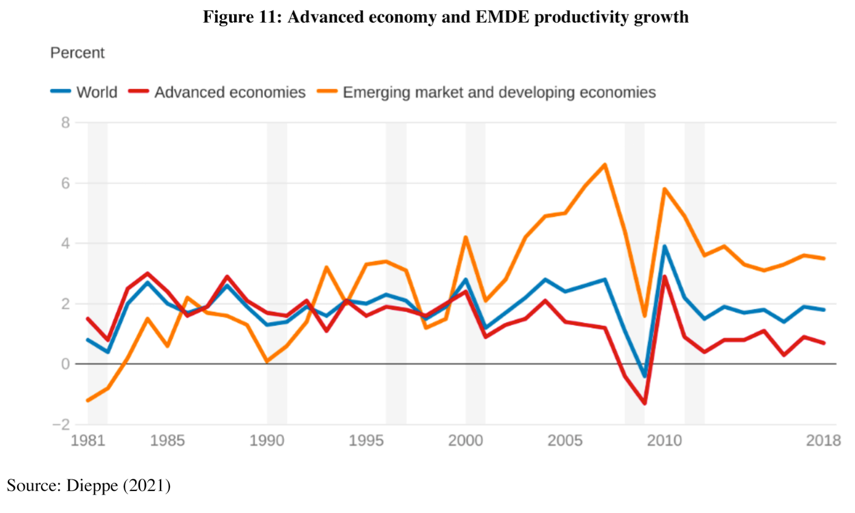
Figure 11 depicts the global productivity trends. It can be seen that since the 2008 financial crisis, both developed and developing countries have suffered steep, broad-based and prolonged productivity slowdowns (Dieppe, 2021). There are many explanations for this deceleration, but none of them seem to anticipate a fundamental change post-COVID-19.
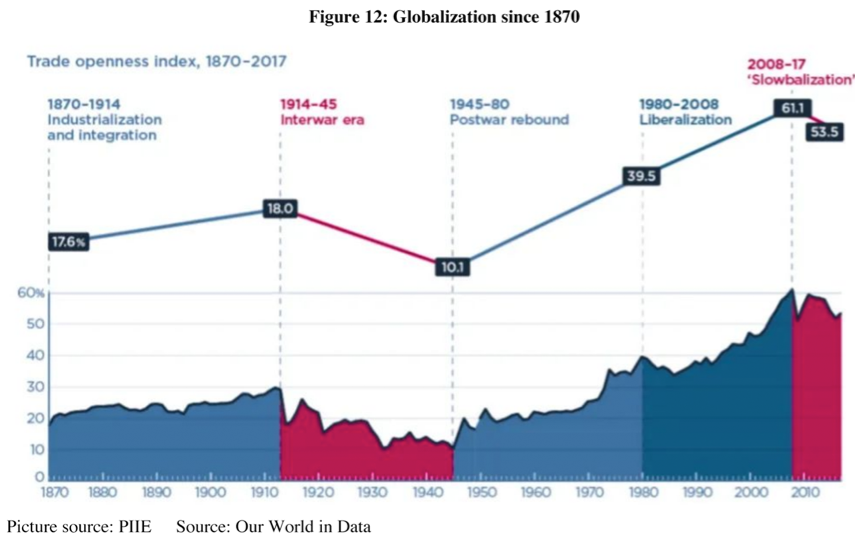
(2) Globalization has been slowing down since 2008 and such a trend is unlikely to revert. At the same time, de-globalization is gaining momentum. After World War II, globalization gathered steam and quickened pace in the 1980s, but it abruptly slowed down or even saw a trend reverse after the 2008 financial crisis, a phenomenon The Economist refers to as "Slowbalisation". Figure 12 illustrates the progress of globalization as measured by the trade openness index, which fell for the first time since World War II in 2008, and has been declining ever since. According to Antras (2020), international trade is not the only measure of globalization, other measures include global value chain trade, foreign investment and cross-border capital flows, which have all stagnated or even declined. The outbreak of the coronavirus has further shocked the globalization process represented by cross-border trade and global value chain linkages. It seems that the slowdown of globalization will continue, and there may even be deglobalization.
(3) The fragmentation of the global trade and technology system.
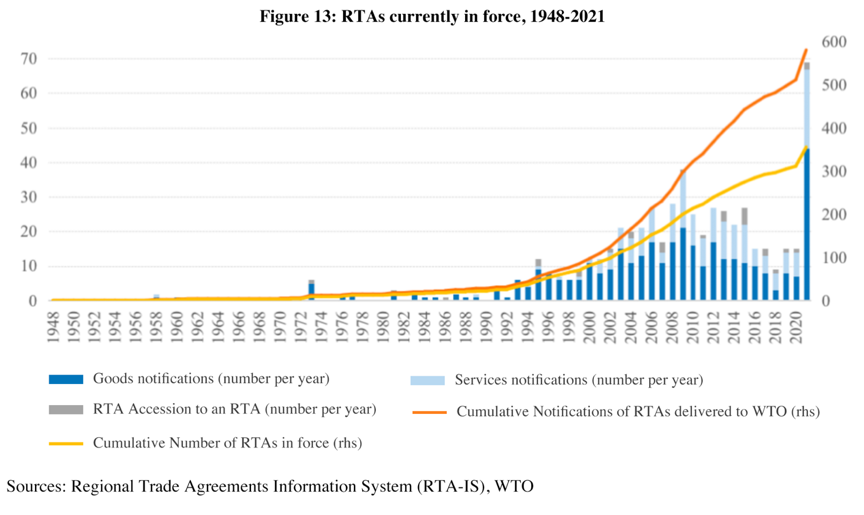
The first part is a never-ending emergence of regional trade agreements (RTAs), some of which are founded on geopolitical rather than economic considerations. Dadush (2022) noted that countries have turned to other agreements outside the WTO to seek the predictability of trade relations because of the widening geopolitical and security gaps between China and the US, the ineffectiveness of the WTO's dispute settlement mechanism, and the member states' repeated rule-breaking. For example, following the official ratification of the Regional Comprehensive Economic Partnership (RCEP), the Biden administration launched the Indo-Pacific Economic Framework for Prosperity (IPEF) in 2022, aiming for a new trade area in Asia that excludes China and US economic and trade dominance in the Asia-Pacific region.
Second, the pandemic has exposed the vulnerability of the excessive concentration of global industrial chains and supply chains, so countries and companies are now making supply chain decisions more based on safety than on efficiency. It manifests in two ways: on the one hand, the global supply chain has migrated to local and near-shore locations and switched from "just-in-time" to "just-in-case", raising the price of labor, transportation, and raw materials used in the production process. On the other hand, the war in Ukraine has made geopolitical factors more prominent in supply chain decision-making. The US and its allies are embracing a new strategy termed “friend-shoring”, which calls for multinational corporations to turn more business to friendly countries to ensure the security of supply channels of vital raw materials and components. This may result in structural price increases and profit declines for these countries as well as the further disintegration of global economic and trade systems.
Third, in recent years, Western nations—particularly the US—have increased their use of export controls and technology bans in sanctions and trade frictions. In a recent move to sanction Russia, the US Department of Commerce, for instance, substantially expanded the Foreign Directly Manufactured Product Rules, implemented re-export controls on military-related and other core technologies to Russia, and prohibited third parties from exporting to Russia products that contained technology and equipment made in the United States. The rule was first used to sanction Huawei in May 2020, which has been widely seen as a sign of the intensified 5G competition between China and the US. Since 2018, Washington has been actively reinforcing restrictions against Huawei and ZTE in an effort to stifle the development of China's 5G technology. In 2021, President Biden convened a CEO summit on semiconductors in an attempt to establish a chip development and manufacturing system without China's involvement, so as to cut China out of the high-tech field. Frequent and escalating sanctions have also had a significant impact on global technology trade. According to World Bank, global high-tech exports fell to $2.85 trillion in 2019 from $2.91 trillion in 2018, compared with the 19.47% and 9.19% year-on-year growth in the previous two years.
Whether it is trade, supply chain, or technology, placing security and politics above economic efficiency will lead to the fragmentation of the global economy, trade, and technological system, and global productivity and economic growth will also be irreversibly impacted. According to a WTO report released this April (WTO, 2022), the geopolitical-driven trading system is becoming increasingly fragmented due to the spillover effects of the Russia-Ukraine conflict. In the worst scenario, where the world economy is permanently split into two blocs, the loss of global economic output over the next 10-20 years would amount to 5%, or roughly $4.4 trillion.
(4) Population aging.
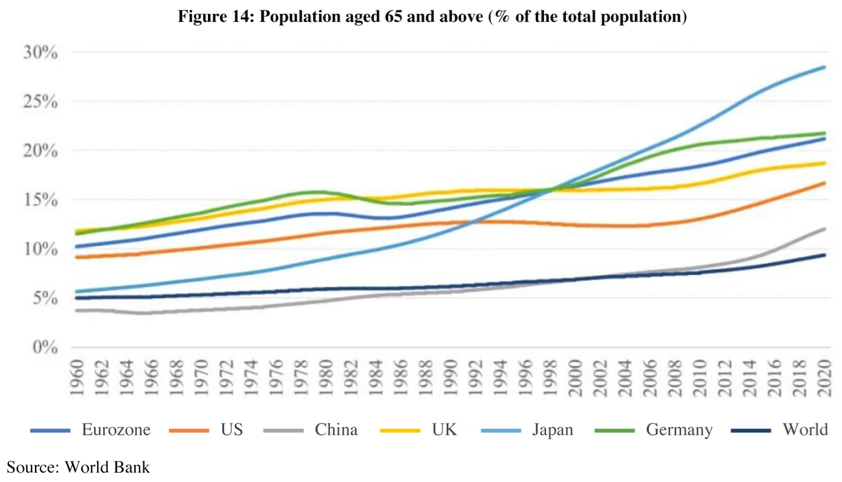
Figure 14 shows the severe aging situation facing the world. The share of population aged over 65 rose from 4.97% in 1960 to 9.32% in 2020. In major developed economies, the proportions are over 15%. According to Goodhart and Pradhan's book The Great Demographic Reversal: Ageing Societies, Waning Inequality, and an Inflation Revival, when a high number of people enter the labor force and supply growth outpaces demand growth, a de-inflationary force is created. However, when people age and exit the labor force, the dynamic reverses—the drag on supply surpasses the decline in demand, which then becomes a force for inflation.
(5) Low-carbon transition.
The core of low-carbon transition is energy transition. In the absence of major technological advances, the transition will experience shocks from rising energy prices. Using the power sector as an example, solar and wind energy have achieved "grid parity," meaning that the price of electricity per kilowatt-hour is nearly equal to that of conventional energy. Wind power even has a cost which is 20-27% lower than the least expensive coal power, according to the International Renewable Energy Agency (IRENA). However, if the stability of the power supply system is taken into account, the cost associated with the conventional energy needed for peak shaving and energy storage batteries will shore up the operating costs significantly, leading to a positive green premium. According to Mills (2021), a solar, wind, and battery system would cost roughly three times as much as a conventional electricity system to produce the same amount of power over several years. In the US, storing 12-hour electricity in the grid will cost around $1.5 trillion. The German solution of keeping roughly the same amount of shadow grid of conventional generation as a backup is also quite expensive, which explains why the electricity bill of an average German is 300% higher than that of an American. Therefore, without revolutionary technological progress, countries will continue to face structural inflationary pressures during energy transition.
(6) China's economic transformation.
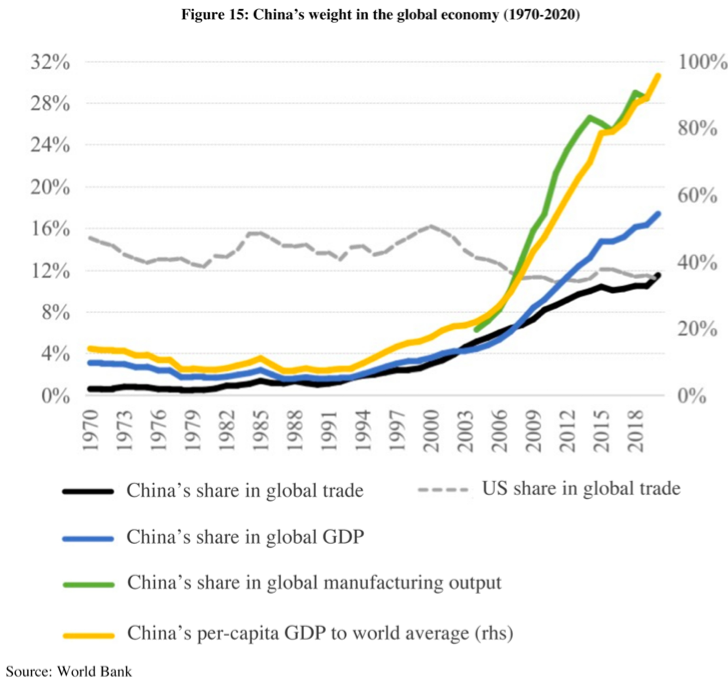
In the past two decades, China has integrated into the global economy and achieved rapid growth, improved its productivity, and established itself as a world factory. The rise of China is also the most important source of increased global supply and productivity. As shown in Figure 15, China's share of global trade and total GDP rose from 2.57% and 3.6% in 2000 to 11.5% and 17.4% in 2020, and the ratio of its per capita GDP to the world average increased from 17.3% to 95.6%. China's share of global manufacturing output stood at 28.7% in 2019, up from 8.7% in 2004, nearly 12 percentage points higher than the second-placed US. China is transitioning economically from rapid growth to high-quality growth, shifting its industrial focus from manufacturing to services (Zhang Bin, 2021), and its growth engine has changed from being driven by exports to being driven by domestic demand. This implies that while China stills has a significant impact on the global economy, it will not be able to boost global productivity and supply at the same rate it did over the previous 20 years, and its ability to stabilize global pricing will gradually deteriorate at the margin.
These short- and medium- to long-term factors form a perfect storm of negative growth and inflation shocks. If the global economy was riding the tailwind from the middle of the 1980s until the GFC that created conditions for the "Great Moderation", then for a long time to come, it will have to sail against the wind. "Stagflation" is not inevitable, provided monetary policy does not repeat the mistakes of the 1970s. But with central banks in major developed economies being slow to act, the signs so far appear to point to rising stagflation risks.
3. The (likely) wrong monetary policy response
It may be too soon to say that the central banks in major developed economies, particularly the Fed, would repeat their 1970s errors, but the indicators are not good so far. Even if they are motivated to avoid mistakes, they might not be able to do so given issues of monetary policy framework, operational problems, and objective constraints.
From the perspective of the monetary policy framework, the major central banks have just applied the old military book for the last war. After the GFC, the main headaches for the major central banks were: a "long-term stagnation" featuring "low growth and low inflation", the space for traditional monetary policy tools being limited by the "zero interest rate", and the fact that inflation has always been below target (as shown in Figure 16). Therefore, before the pandemic, major central banks were more worried about low inflation than excessive inflation, regardless of how loose their monetary policies were. Although the economy has been recovering, the growth has remained lackluster. The main issue with monetary policy is the lack of enough tools and room to boost the economy and prevent deflation.
To this end, the Fed and the ECB have reviewed their monetary policy framework in the past few years and made adjustments. The Fed changed its 2% inflation target to an average 2% inflation target, and the ECB changed its inflation target from close to but below 2% to a symmetric 2% target. What appears to be minor technical tweaks are actually major adjustments to the monetary policy framework. This is especially the case for the Fed, which adjusted the inflation target so it may adopt more aggressive policies and tolerate higher inflation for a while if inflation persists below target. With this monetary policy framework in place, the Fed did nothing in 2021 when it noticed signs of rising inflation, which it considered to be what should be happening under average inflation targeting. This inaction ultimately put the Fed far behind the inflation curve and in a dilemma: abandoning the average inflation regime would cause additional market confusion, but maintaining it is no longer conceivable. When a central bank like the Fed is unsure of its own monetary policy framework, there will be serious consequences.
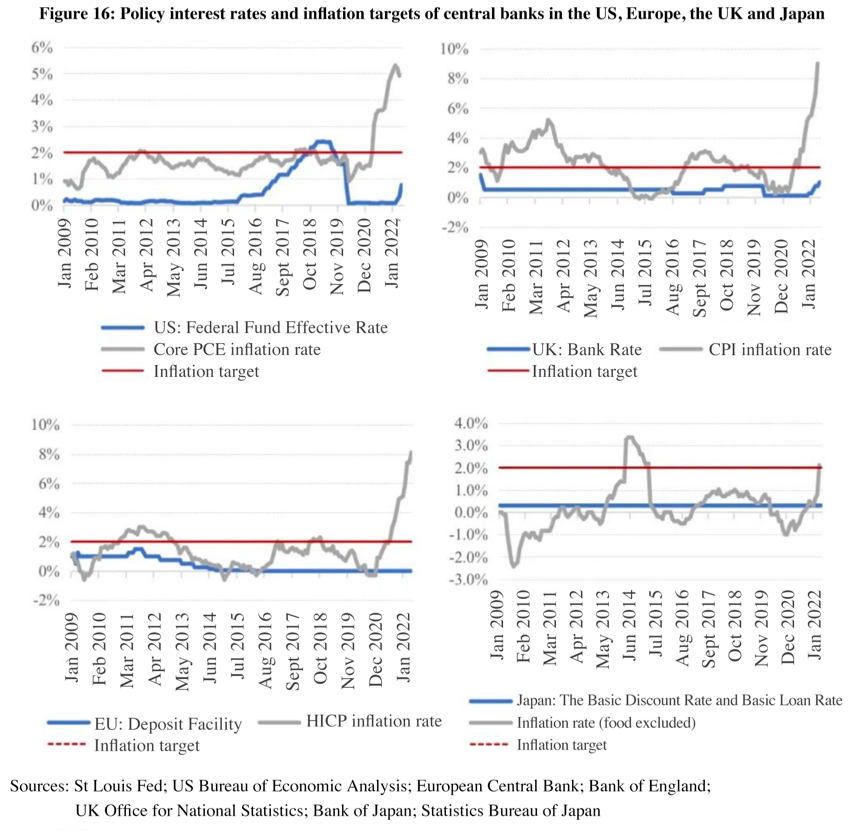
From the perspective of policy practice, the central banks of major developed economies are lagging behind inflation considerably. Facing the highest inflation in 40 years, the Fed was still imposing quantitative easing and zero interest rates in March this year. The European Central Bank (ECB) decided to withdraw from quantitative easing in July and then raise interest rates by 25 basis points. The Bank of England, the central bank quickest to react, has a policy rate of only 1%, while inflation in the UK is currently 9%. The Bank of Japan, which has not faced an inflationary shock yet, is still sticking to a highly expansionary monetary policy and loose control over the yield curve.
Although central banks of most major advanced economies are tightening monetary policy or are about to do so, given the reality that real policy interest rates in these economies are highly negative, monetary policy will only shift from being extremely loose to highly loose. It is like lifting one’s foot off the gas pedal a little bit, and the car is still accelerating instead of slowing down. To look at this in a more quantitative way, the May 2022 US federal funds rate is 600-700 basis points lower than the policy rate based on the Taylor rule. When was the last time the Fed pressed the gas pedal so aggressively in the face of high inflation? It was during the stagflation in the 1970s.
From the perspective of practical constraints, central banks of major developed economies are facing more constraints today in tightening their monetary policy in a rapid way. There is an optimistic view that inflation will not be difficult to combat as long as central banks such as the Fed show a little of Volcker's courage in the late 1970s and early 1980s. The reality is that central banks in major advanced economies face far more constraints on monetary policy tightening today than in Volcker’s time.
For example: the US federal government has a net debt of about $20 trillion and households have home mortgages of about $11 trillion, together amounting to 150% of US GDP. For every 1 percentage point rise in the US average interest rate, interest payments of the federal government will increase by $200 billion, or 1 percent of GDP. Households will have to pay $100 billion more in interest on home loans, and new demand for home purchases will naturally be dragged.
The predicament faced by the ECB is more complicated. If the average interest rate of the Euro zone rises by 1%, the interest rate of countries that have experienced a debt crisis such as Italy will rise even more. The Euro area may face new internal differentiation and market segmentation. Any attempts made by the ECB to ease this market fragmentation are likely to conflict with measures to curb inflation.
Interest rate hikes and balance sheet reductions may be accompanied by financial stability risks. Fluctuations in financial and foreign exchange markets, changes in capital flows, and spillover effects on and from emerging economies will have realistic consequences for monetary tightening in major developed economies. In summary, conditions for tightening monetary may be far more complicated than imagined.
4. If this time is different
There is a view that the current situation does not constitute a typical stagflation. On the one hand, global energy intensity has fallen sharply in recent years, reducing supply-side shocks. On the other hand, compared with what happened in the 1970s, inflation expectations in the United States have not yet grown out of control, and the economic fundamentals are relatively strong. The Federal Reserve and other central banks are capable of controlling the current inflation and the associated risks through timely measures. Based on the mentioned reasons, this round of global inflation can hardly evolve into a typical stagflation.
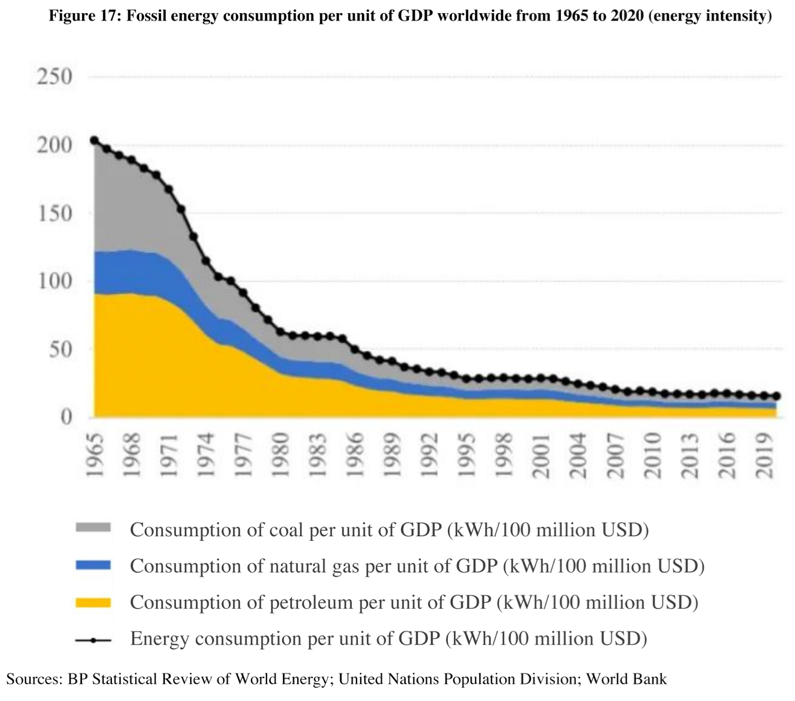
First, energy intensity has fallen sharply over the past 50 years, diluting the adverse effects of energy price shocks. Energy intensity refers to the ratio of energy consumption to output, which is used to measure the comprehensive energy utilization efficiency and an economy's dependence on energy. It can also be adopted to measure the impact of energy price fluctuations on the overall inflation rate. The higher the energy intensity, the greater the impact of energy supply and demand changes on the overall economy, and the stronger the transmission effect of energy price fluctuations on core inflation, and vice versa.
From the middle of the last century to the present, the improvement of production efficiency, industrial development and the utilization of clean energy among other factors have brought down the overall energy intensity rapidly. As shown in Figure 17, as of 2020, the global energy consumption per unit of GDP stood at 15 kWh/million USD, well below the annual average of 119 kWh/million USD in the 1970s. The energy intensity of oil, in particular, has declined substantially over the past 50+ years, from an annual average of 178 kWh/million USD in 1970 to just 6 kWh/million USD in 2020. This also means that the impact of energy price shocks on inflation levels and the economy has substantially diminished compared to the 1970s.
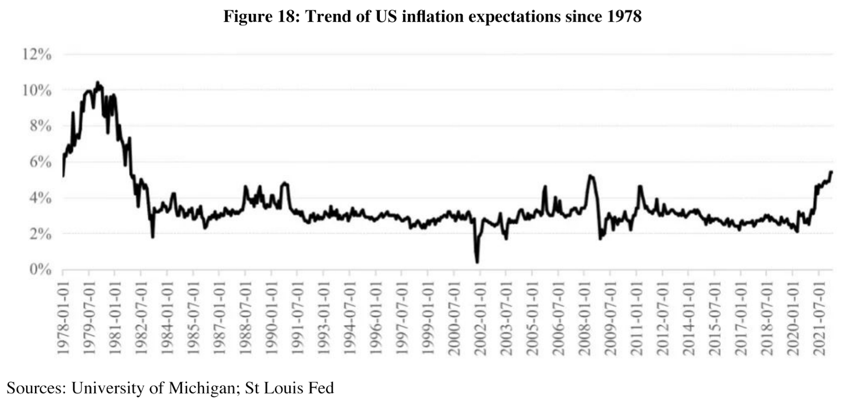
Second, today’s inflation expectations are more stable compared to that in the 1970s, and the central banks of major developed economies have gained strong anti-inflation reputations. The breakeven inflation rate of 10-year US Treasury bonds has generally remained below 3% despite the rise since the beginning of this year, indicating that the inflation expectations of the financial market are still well anchored. As can be seen from Figure 18 of the inflation expectations surveyed by the University of Michigan, in the past year or so, although the inflation expectations in the United States rose, from 2.5% in December 2020 to 5.4% in April 2022, they have not yet run out of control compared with the runaway inflation expectations of over 10% in the late 1970s. Most importantly, the central banks of major developed economies such as the Federal Reserve have established a strong anti-inflation reputation since the 1980s, because of which it’s highly possible that the central banks can curb inflation without too much cost.
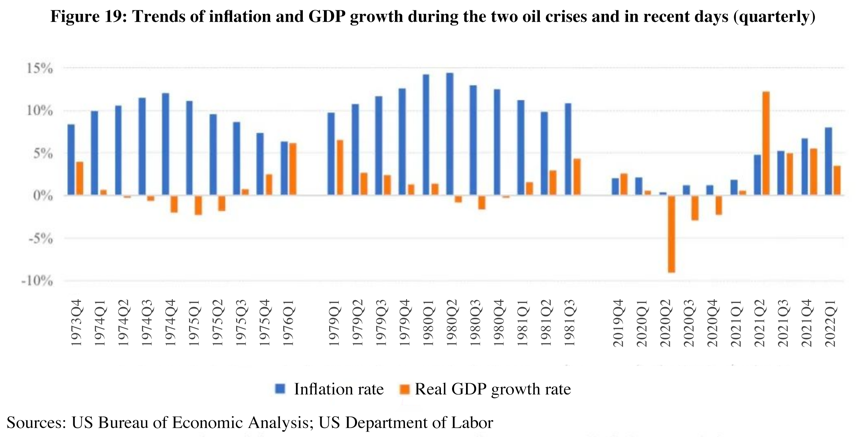
Third, the current fundamentals of the US are good, and there is no risk of stagnation in the short term. As shown in Figure 19, unlike the two oil crises in the 1970s when the US economy suffered both high inflation and low (negative) growth, the recent performance of the US economy showed characteristics of inflation without stagnation. It means although the inflation rate has risen sharply from the second half of 2021 and has exceeded 5% for 8 consecutive months, strong economic growth has not been affected. The growth rate in the first quarter of 2022 slowed down slightly from the previous three quarters to 3.5%, a level still far higher than the rate of 2.6% in the fourth quarter of 2019. Overall, the fundamentals of the United States are rather strong at present, the balance sheet of residents healthy, and the labor market hot, so the growth potential will last for a while.
The above analysis shows that stagflation is not inevitable, but the risk of stagflation should never be ignored especially given the recent data and financial market movements.
II. IMPACT AND POLICY RECOMMENDATIONS
If major developed economies fall into stagflation, it will affect China through various channels, so it’s essential to prepare early.
First, China faces the risk of imported stagflation. As an important importer of energy, bulk commodities and agricultural products, China is deeply integrated in the global supply chain, and sees a high risk of imported stagflation. China’s economy is likely to face weak macro expansion due to its damaged balance sheet, and imported stagflation will further complicate China’s macroeconomic management and reduce the space for macroeconomic policies.
Second, emerging market economies are facing capital outflow, currency depreciation and debt pressure, which can have indirect consequences for China. Major developed economies will have to keep raising interest rates in response to the risk of stagflation. The global low interest rate environment that has lasted for many years is likely to switch to one that features high interest rates in the next few years, which will plunge emerging market economies into risks of stagflation, capital outflows, currency depreciation and even debt crises. As the largest emerging market economy, China may not be immune from such pressures. At the same time, most of the countries along the Belt and Road and neighboring countries of China are developing countries. If these countries get into trouble, it will affect China’s external claims and investments, and lead to more demands for external debt restructuring and new financing.
Third, intensified social polarization and even social unrest in some countries could complicate China’s external environment. In the case of stagflation, on the one hand, we will see sluggish economic growth and rising unemployment, and on the other hand, there will be increased prices of goods and services, falling real income of residents and shrinking savings. If this state is allowed to last, a considerable part of the population in the country will be seriously affected and social problems will consequently arise. In some countries, social polarization will intensify and social unrest break out, making the external environment faced by China more complex and unpredictable.
Fourth, populism and deglobalization may accelerate. Many politicians in the United States have attempted to attribute inflation to foreign factors (such as the conflict between Russia and Ukraine, China's pandemic prevention and control measures, etc.), or to the greed, monopoly or profit-seeking behavior of companies (such as the huge profits of oil companies and shipping companies). If stagflation does occur, populist policies and anti-globalization practices are likely to be adopted to quell public dissatisfaction. Like drinking poison to quench thirst, though providing a short-term remedy for Western politicians, these practices will ultimately exacerbate stagflation.
Given the huge shock that stagflation will bring and the possibility of occurrence, China must make policy preparations.
First, roll out more forceful macro policies in the next six months to stabilize the economy at home. At present, China sees a moderate inflation level, growing exports, a floating RMB exchange rate, and relatively balanced cross-border capital flows. Inflation levels in countries such as the United States are high, but the economy is still in a state of expansion. In summary, both domestic and foreign economic environments are favorable, giving China ample room to make macro policy maneuvers. China should use this window of opportunity to step up its counter-cyclical macro policies. For fiscal policy, the recommended measure is to increase government spending, while for monetary policy, price tools should be given more weight, and tailored policies should be introduced in response to the balance sheet damage.
Second, maintain the flexibility of the RMB exchange rate while closely monitoring abnormal capital flows. At present, the RMB exchange rate is seeing rational and orderly fluctuations in both directions, playing the role of an automatic stabilizer for the balance of payments and the overall economy. For a period of time ahead, disturbances will come from both home and abroad, but the direction and intensity are not yet clear. The RMB exchange rate should be allowed to adjust itself, and automatically improve the balance of payments. Meanwhile, we must realize that excessive or disorderly fluctuations in the exchange rate can cause instability, so it’s fundamentally important to closely monitor any abnormal capital flows to prevent the herd effect.
Third, participate more in multilateral debt restructuring mechanisms. The COVID-19 pandemic, monetary tightening in major developed countries, sharp rises in energy and food price, and the possible stagflation all have a high possibility to trigger debt crises in some emerging markets and developing countries. Debt restructuring will become inevitable. Although China did not participate in the establishment of the existing multilateral debt restructuring mechanisms, it boasts mature practices and abundant experiences in debt restructuring, which are recognized by multilateral institutions such as the IMF and the World Bank. China can explore more ways to participate in the multilateral debt restructuring mechanisms, and make full use of the flexibility of bilateral negotiations under the multilateral mechanism, draw on advantages and avoid disadvantages, and safeguard national interests.
Fourth, China’s systemic importance in the world's major commodity markets must be fully considered. China is the world's largest producer and consumer of agricultural products, the world's largest importer of crude oil, the world's largest buyer of many commodities, and the world's largest exporter of manufactured goods. Therefore, when measures are taken to stabilize domestic supply and prices, China must fully consider its systemic importance and pay attention to possible spillovers and spillbacks.
Fifth, continue to advance reform and opening up. Liberating and developing productive forces is the most fundamental way to hedge against stagflation. On the one hand, China is faced with the need to transform from high-speed growth to high-quality growth; on the other hand, we are now in a world of fast changes and the external environment is complicated and grim. However, as long as China adheres to reform and opening up and has its own job done well, it will be able to enjoy the dividends of reform to the greatest extent, increase productivity, and promote technological progress. These will ultimately contribute to the stability and long-term development of the Chinese economy, and help prevent the global economy from falling into stagnation and inflation.