
Abstract: The paper analyzes China’s economic recovery in the first half of 2023, which is characterized by a k-shaped pattern. Under the K-reshaped recovery, the difference between macro-economic trend and micro-subject feeling is huge, and the guiding role of macro-economic index will be distorted. It is suggested that policy support should focus more on the lower half of the k-shaped recovery, because whether policy protection during this stage can provide “timely help” with significant marginal effect will directly determine the sustainability of the recovery.
The economic recovery in the first half of 2023 is characterized by a k-shaped pattern:
Net exports and domestic demand were k-shaped. Net exports continued to exceed trend by a large margin, and the recovery in domestic demand remained sluggish.
High-end consumption and general consumption show K-shape. The former has a stronger recovery, while the latter is limited.
Infrastructure backed by public money and private investment are K-shaped.
Real estate sales and construction show K-shape between themselves and among regions. Sales have picked up, investment and new construction are still falling, and real estate sales and development are on a downward path everywhere except the first-tier cities.
Exports to different destinations are K-shaped. Exports to south-east Asia have grown strongly, while those to developed economies such as the US, Europe and Japan have fallen.
Under the K-shaped recovery, the difference between macro-economic trend and micro-subject feeling is huge, and the indicative meaning of macro-economic index will appear some distortion.
A k-shaped recovery is likely to be a weak and limited recovery. It is difficult for the economy to enter a virtuous circle of income, demand and supply, and a large part of the population, region and industry may still be under the feedback mechanism in the opposite direction of this virtuous circle.
Moreover, the risks to the economy in a k-shaped recovery are asymmetric. The probability of better-than-expected economic performance is lower than that of worse-than-expected economic performance, and the positive impact on the economy is less than the negative impact on the economy.
Finally, policy should focus more on the lower half of the k-shaped recovery. For the top half of the K-type, further policy support is the icing on the cake, with limited marginal effect. But for the lower half of the k-shape, the policy support is “timely help”, the marginal effect will be very significant, which will directly determine the sustainability of the recovery.
If the next policy focus can be on the lower half of the K, then we may be able to look forward to a change from the k-shaped recovery to a v-shaped recovery sometime in the future.
The year 2023 has just passed the halfway point, at which time it is necessary to analyze and sort out the economic performance in the first half of the year, so as to help forecast the future economic trend.
If you go back to the end of last year and know that the Chinese economy will have its current performance and data in the first half of 2023, many analysts may think that the Chinese economy is remarkable, beyond expectations. But if you go back to the end of the first quarter of this year and see the Chinese economy's performance and data in the second quarter, some analysts may feel that the strength of the economic recovery has room to improve. This is mainly because expectations are constantly adjusted, many people adjusted their expectations because of the first quarter’s better-than-expected economic performance, and may then feel a temperature difference after looking at the second quarter’s data; On the other hand, China's economic recovery data in the second quarter showed that the recovery process will not be a straight line after the first quarter of recovery.
The above macro-economic perspective from the time dimension is important, and is usually the perspective of macro-economic analysis, but for the Chinese economy in 2023 it is not complete. There is another important dimension that China needs to look at this year, and that is the distribution of the recovery. By combing through various kinds of data, this paper finds that the economic recovery in the first half of 2023 to a large extent presents-shape characteristics: that part of the population, some industries, some areas show good performance in the recovery channel, but the other part of the population, industries and regions are still facing more difficulties. Specifically, it is reflected in the following areas.
I. THE K-SHAPE DIFFERENTIATION BETWEEN DOMESTIC DEMAND AND NET EXPORTS
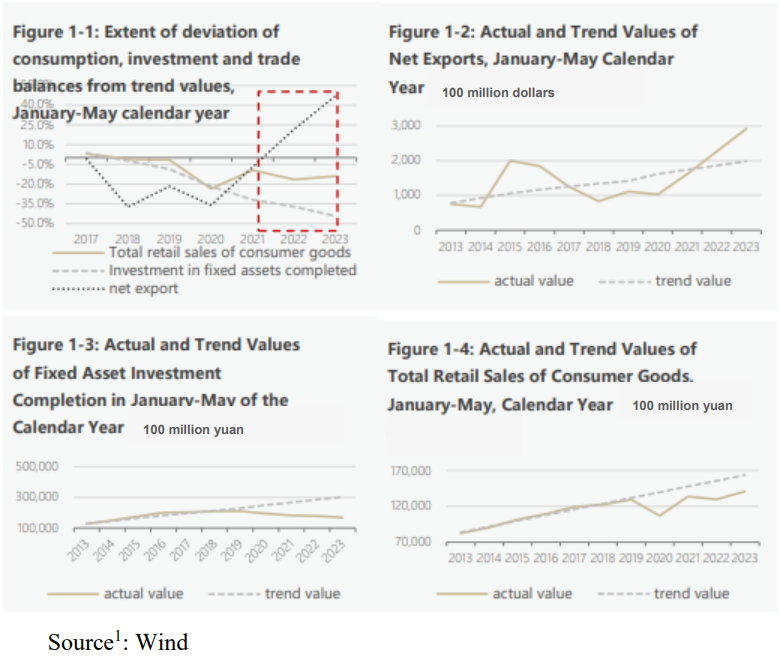
Since 2020, there has been a huge K-shape differentiation between domestic demand and net exports in the process of China's economic recovery. Figures 1-1 through 1-4 show the actual and trend values of consumption, investment and net exports from January to May, and the extent to which they deviate from the trend.
Net exports have recovered rapidly since 2021, with real performance well above trend in 2022 and January-May 2023. Since 2020, China's exports have started to recover in the second half of 2020, thanks to a rapid recovery in China's production order and huge external demand generated by ultra-loose macro policies in Europe and the US. From January to May 2021, China's foreign trade balance has basically recovered to a near trend level. Net exports have continued to grow since then in 2022. Between January and May 2023, the trade balance was 21.6% and 47% above trend, respectively. Of course, part of the reason for the positive net export performance was the decline in imports due to weak domestic demand.
The recovery in domestic demand is not very strong, so far, domestic investment and consumption are far from the trend level. In terms of investment, total fixed-asset investment in January to May 2020-2023 were 21.9%, 32.0%, 37.3% and 44.4% lower than the trend level. That is, domestic investment actually has declined year by year since 2020 relative to trend. This includes the economic main body’s reaction when facing the shock, we must also consider the real estate market's rapid downward drag on the overall investment from the second half of year 2021 onwards.
In terms of consumption, after a big shock to consumption in 2020, consumption recovered somewhat in January-May 2021 (9.4% below trend). But that growth did not hold up in 2022, when retail sales were 16.6% below trend in the January-May period, the gap is 7.2 percentage points larger from a year earlier. Consumption recovered somewhat in 2023, but retail sales of consumer goods remained 14 per cent below trend in real terms.
II.THE K-SHAPE DIFFERENTIATION OF CONSUMPTION
By consumption category, in the first quarter of 2023, real year-on-year growth in consumer spending was lower than the average for the period 2013-2019, except for residential and health-care consumption (Figure 2). At the same time, with the exception of residential and health-care consumption, which had returned to trend levels, the actual levels of all other categories of consumption in the first quarter of 2023 fell far short of the trend (Figure 3).
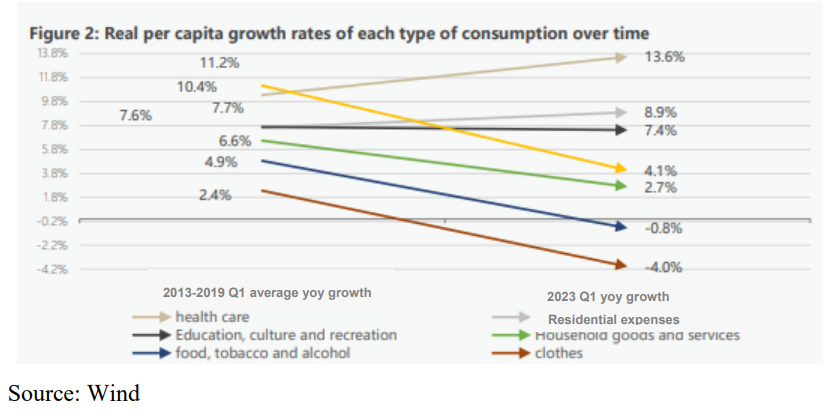
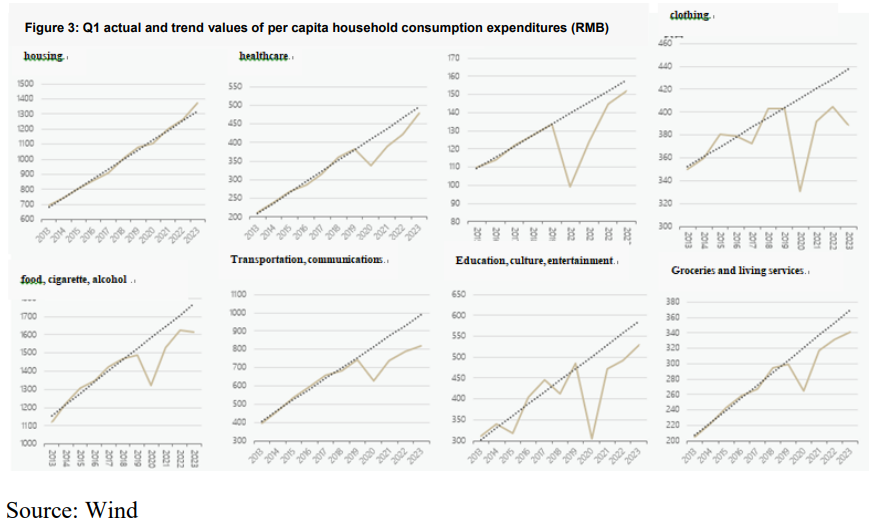
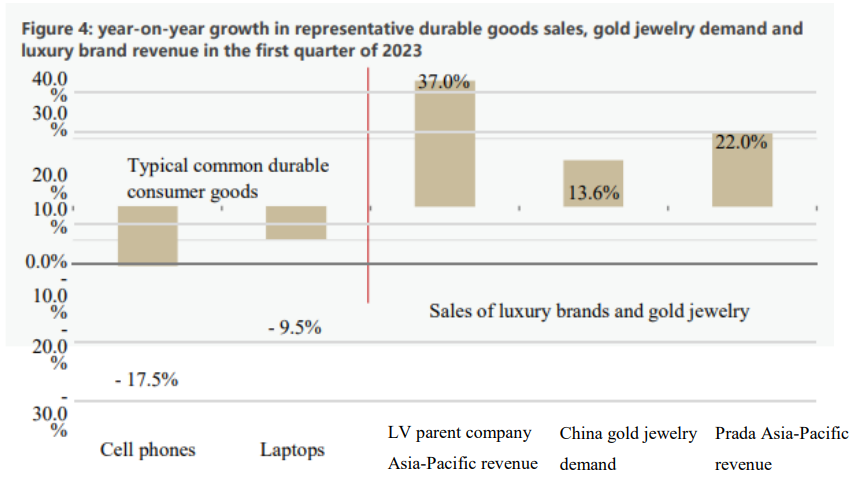
The K-shape differentiation of consumption is another manifestation: high-end consumption recovery is strong, ordinary consumption recovery is weak.
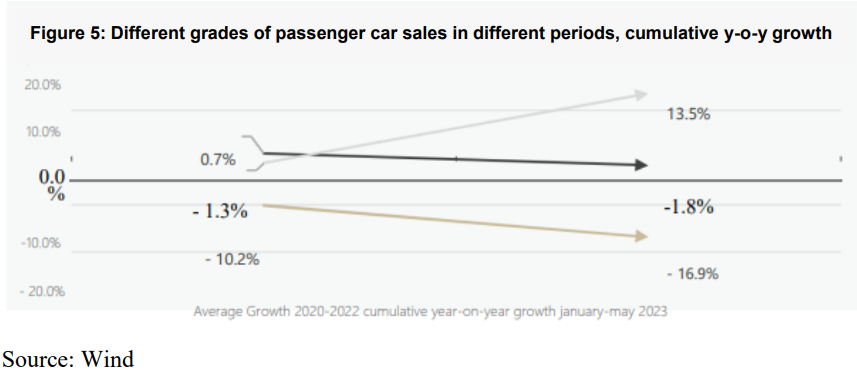
In terms of consumer goods, as shown in Figure 4, global luxury brands have enjoyed a very high revenue recovery in China since 2023. In the first quarter, LVMH, LV's parent company, posted the biggest year-on-year increase of 37% in Asia excluding Japan (China accounts for about 80% of the region). Prada's retail sales in the Asia-pacific region rebounded strongly in the first quarter, rising 22 per cent from a year earlier, helped by the recovery in the Chinese market. And, according to the World Gold Council, China's gold jewelry consumption rose 13.6 percent year-on-year in the first quarter of 2023, and was 7.7 percent higher than in the same period of 2019.
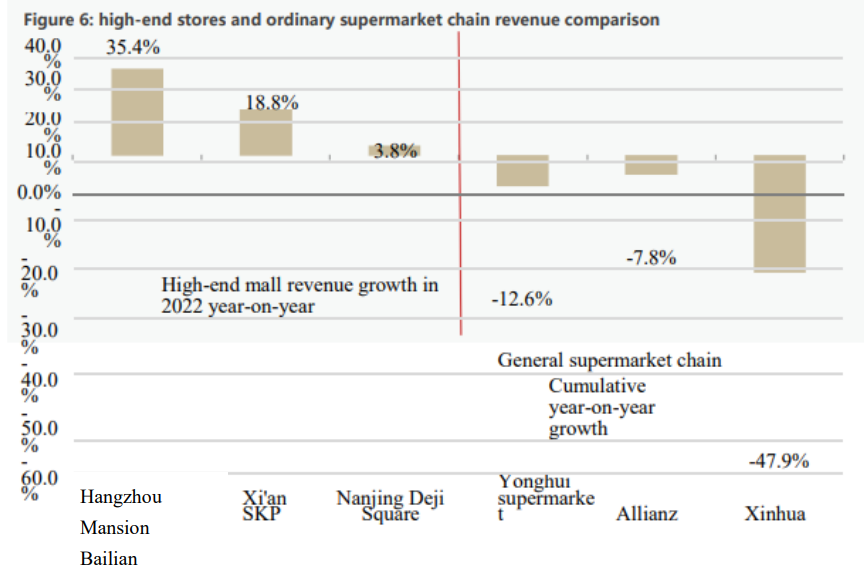
Another piece of evidence is that offline consumption venues with different positions also show the contrast of "half sea water, half fire". In 2022, high-end shopping malls such as Hangzhou Mansion, Xi'an SKP, and Nanjing Deji Plaza maintained high revenue growth (Figure 6).
However, mall supermarkets for ordinary consumers were slightly cooler, with 10 of the 13 A-share listed superstores reporting year-on-year revenue declines in the first quarter of this year. Among them, Bailian, Yonghui Supermarket and Xinhadu Department Store, which have a wider nationwide presence, saw their first-quarter revenues fall by 7.8 per cent, 12.6 per cent and 47.9 per cent respectively compared with the same period last year.
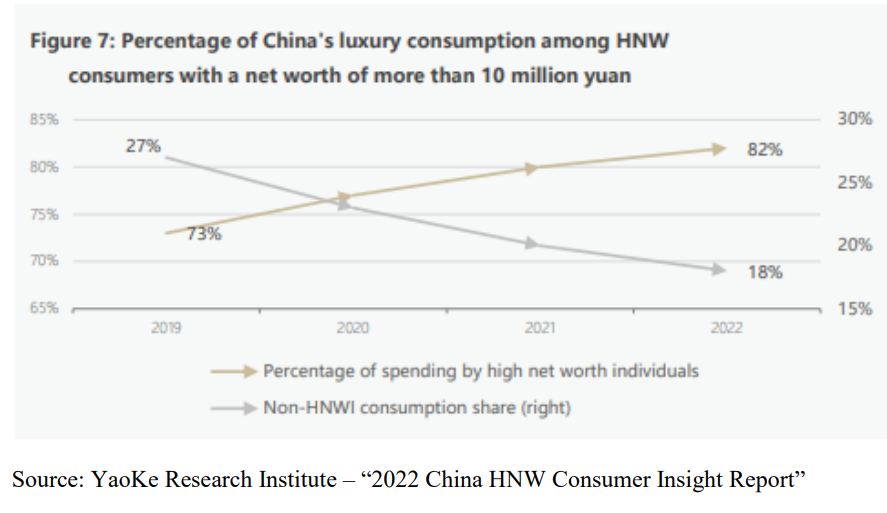
High-end shopping malls are an important place for luxury consumption, and there is another picture of luxury consumption in China: prices are rising, and non-high-net-worth consumers are being pushed out of the ranks of luxury consumers. The Financial Times reported that in 2023, the price of Chanel CF (Classic Flap) series handbags, has been 74 per cent higher than the price in November 2019, and other luxury brands have continued to raise the unit price of their products in the past two years. Meanwhile, in China's luxury consumption market, the consumption share of high-net-worth consumers with a net worth of more than 10 million yuan has increased from 73 per cent in 2019 to 82 per cent in 2022, while the luxury consumption share of non-high-net-worth consumers has decreased from 27 per cent to 18 per cent. The luxury purchasing power of China's non-HNWIs may be on the wane.
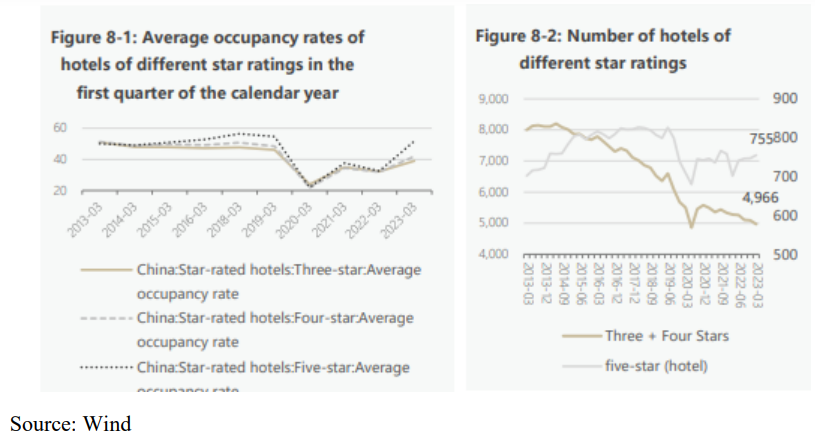
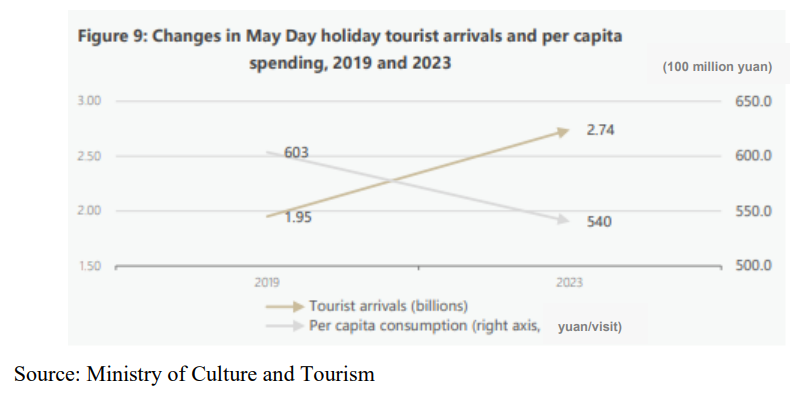
Consumption of services. One of the typical phenomena is that five-star hotels are operating favorably and three- and four-star hotels are struggling. As shown in Figure 8, the room occupancy rate of five-star hotels has basically recovered to the average level of 2013-2019, but the occupancy rate of three- and four-star hotels is 8-9 percentage points lower than the average level of 2013-2019. The number of five-star hotels is now rebounding after a decline in 2020; however, the number of three and four-star hotels continues to decline.
The second typical phenomenon is the high increase of domestic tourism trips, but the per capita consumption is not as high as in the past (Figure 9). 2023, the number of domestic tourism trips reached 274 million during the May 1 period, which is already 40.5% higher than the same period of 2019; but the per capita consumption is still only 540 yuan per trip, which is 10.5% lower than the same period of 2019. In contrast, fewer Chinese travelers are travelling across borders than before 2020, but spending more per capita. According to travel data company ForwardKeys, the number of travelers from China to Europe during the May Day holiday was 64% lower than in 2019. But the average transaction value for Chinese tourists in Europe in March was 28 per cent higher than in 2019, UBS said, citing data from Planet, a provider of VAT refunds.
III. K-SHAPED DIVERGENCE OF INVESTMENTS
In terms of industry distribution, the K-shaped divergence of investment is reflected in the following: real estate drags, infrastructure props, and manufacturing maintains a certain degree of resilience (Figure 10). After a sharp adjustment in 2022, real estate development investment did not bottom out significantly in 2023; instead, it declined month by month, and by May the cumulative total was still 7.2% lower than last year. Overall investment still relies on the support of infrastructure investment carried out by the government and quasi-public sector, with infrastructure investment still maintaining a growth rate of around 10 per cent from January to May. Manufacturing investment maintained some resilience, with a cumulative increase of 6 per cent year-on-year from January to May.
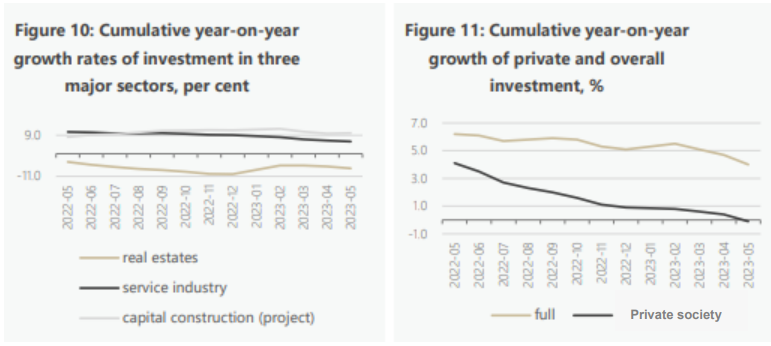
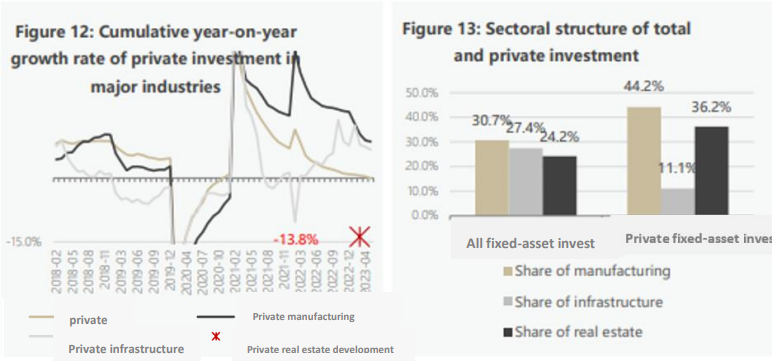
Looking at different investment entities, another important divergence in the investment sector is the significant downturn in private investment (Figure 11), which is mainly dragged down by private real estate investment. 2023 Private investment has been in the vicinity of 0 growth, which is about 5 percentage points different from the overall investment growth rate. However, looking at private manufacturing investment and private infrastructure investment, we can see that both types of private investment have had a good performance (Figure 12), with a cumulative year-on-year increase of 8.6% and 6.7% respectively from January to May. The most important reason for the downturn in private investment is the significant downward movement of private real estate investment. According to data disclosed by the National Bureau of Statistics, private real estate investment in the first quarter saw a cumulative decline of 13.8%, 7.6 percentage points more than the overall rate of decline in real estate investment, which dragged the private investment downward by 5 percentage points. Comparatively speaking, private investment is more dependent on property development investment (Figure 13), and the plight of private real estate enterprises has made private investment relatively weaker.
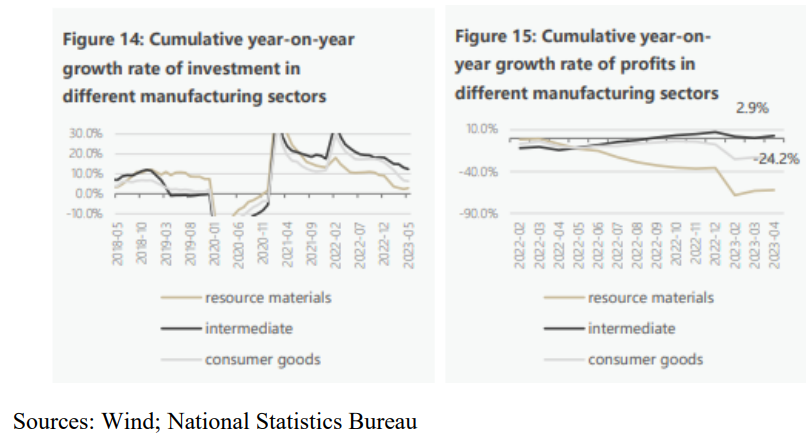
Manufacturing investment has been relatively resilient so far since 2020, but the growth outlook for overall manufacturing investment is now somewhat challenged by the rapid downward trend in consumer goods manufacturing investment, and the constraints of declining profits in intermediate goods manufacturing investment. The manufacturing industry is divided into resource goods, intermediate goods and consumer goods industries. It can be seen that investment in the resource goods industry in the January-May cumulative year-on-year growth rate fell back to 2.8 per cent, which is mainly the result of the commodity price drop after a round of big price increases.
However, there was also an accelerated decline in investment growth in the consumer goods sector, with the cumulative year-on-year growth rate of its investment slipping to 6.3 per cent in January-May, which was 13.2 and 9.6 percentage points lower than that of the same period last year and the whole of last year, respectively. The main supporting force for manufacturing investment now lies in the intermediate goods industry (chemical, manufactured metal and electrical equipment industries), which had 12.4% investment growth in January-May. However, given the overall decline in manufacturing profits in 2023 (Figure 16), sustained growth in investment in the intermediate goods sector also faces challenges.
IV. K-SHAPED DIVERGENCE IN THE PROPERTY MARKET
Overall property development investment has not come out of the downward range and there is a K-shaped divergence within it.
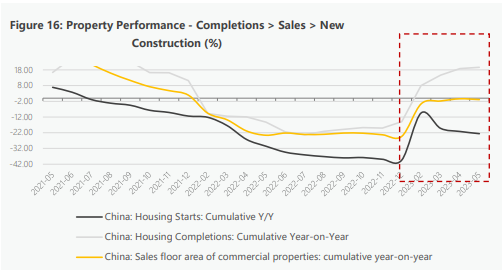
First, sales outperformed constructions. As shown in figure 16, among the various indicators of the property market, completions outperformed sales, and sales outperformed new construction. This may reflect the fact that, under the requirement of "guaranteed delivery", real estate companies are stepping up the completion and sale of inventory projects. Meanwhile, new construction has yet to show signs of recovery, with the cumulative year-on-year growth rate of new housing starts falling continuously from March to May, and continuing to fall by 22.6 per cent from January to May on top of the sharp decline in 2022.
Source: Wind
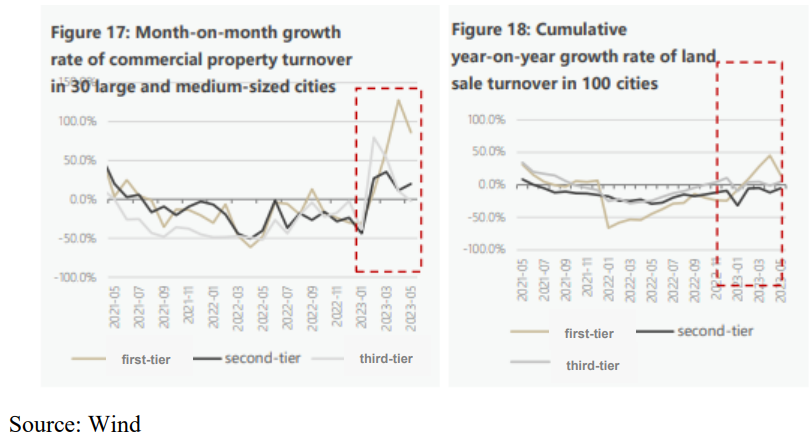
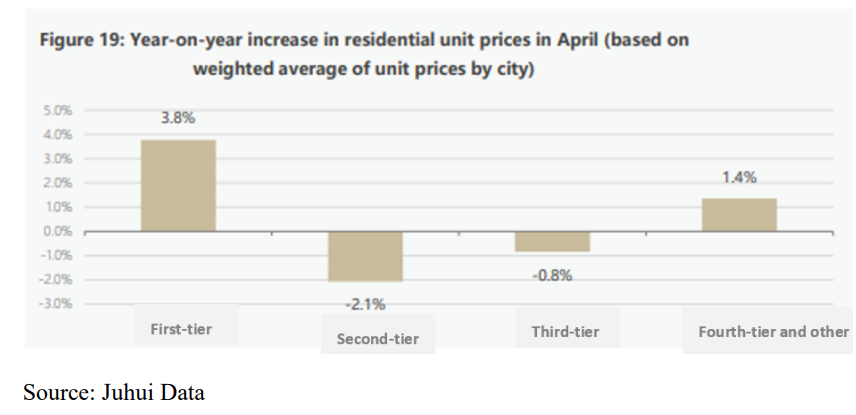
Second, regional divergence intensified. In 30 large and medium-sized cities, commercial property sales in second- and third-tier cities had briefly surged in the first quarter, but began to fall in April (Figure 17), of which May single-month sales in the third-tier cities reappeared negative growth; as of May, only first-tier cities continued to maintain the recovery trend. In terms of land acquisition and construction, after the downturn in 2022, second- and third-tier cities have not yet recovered in 2023, and the willingness of real estate enterprises to acquire land and start construction is significantly weaker. The first-tier city land acquisition and construction recovery is relatively strong; this is because the local demand is more solid. Also, due to the real estate downturn in the second and third-tier cities, real estate enterprises around the nation may focus on land acquisition and look for business opportunities in first-tier cities. In terms of prices, according to the data of 300 prefecture-level cities counted by the "Juhui Data" platform, it can be seen that the prices of commercial properties in second- and third-tier cities have declined on the whole (Figure 19). Important cities such as Ningbo, Fuzhou, Shenyang and Dalian have seen year-on-year price reductions of around 10 per cent.
V. K-SHAPED DIVERGENCE IN EXPORT DESTINATIONS
Exports have played an important role in supporting the Chinese economy after 2020. However, in terms of export destinations, there is also a clear K-shaped divergence, with China's trading partners showing a "rising east, declining west" trend: exports to developed economies such as the United States, Europe and Japan are declining, while exports to South-East Asia are rising.
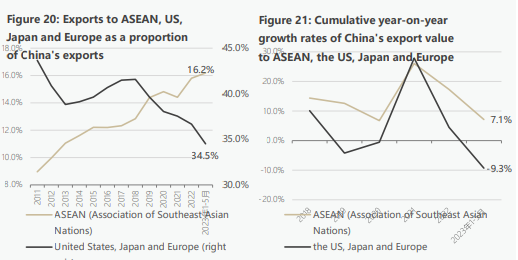
For a long time, the United States, the European Union, Japan and other developed economies are China's most important export destinations, but the situation began to change in 2018. As shown in Figure 20, China's exports to the United States, Europe and Japan as a share of total exports peaked at 41.6 percent in 2018, but have declined since then, falling to 34.5 percent in the first five months of 2023, a fall of 7.1 percentage points since 2018. ASEAN, meanwhile, has become China's largest trading partner, accounting for 16.2 per cent of total exports in the first five months of recent years, up from 3.3 per cent in 2018.
Let us look at the growth rate of export value (Figure 21). Exports to the U.S., Europe and Japan fell by a combined 4.2 per cent in 2019 following the U.S.-China trade conflict; they began to recover to near zero in 2020 and continued to increase at a high rate to 27.9 per cent in 2021, but have been declining ever since. From January to May this year, exports to the U.S., Europe and Japan have already declined by a cumulative 9.3 per cent, showing decreases of 15.3 per cent, 5.1 per cent and 2.4 per cent to the U.S., EU and Japan respectively. However, China's exports to ASEAN have been relatively more positive, with exports increasing by a cumulative 7.1 per cent from January to May.
Source: Wind
There are two possible explanations for the "rise in the East and fall in the West" in terms of China's trading partners. First, with the deepening of economic and trade cooperation, the economy and demand in Southeast Asia remain relatively resilient, with incremental demand for Chinese goods. Second, the increased demand for manufactured goods in South-East Asia as a result of tariff avoidance and industry chain shifts in re-export trade will also lead to more exports of Chinese goods to South-East Asia.
VI. IMPLICATIONS
China's economic recovery in 2023 is characterised by K-shaped divergence everywhere, with different populations, industries and regions displaying cool and hot situations. This has the following implications for macroeconomic situation assessment and macro policies.
First, there is a huge discrepancy between macroeconomic trends and the perceptions of micro-individuals. As the economic recovery is K-shaped and differentiated, for micro-individuals, the perception of the economy depends to a large extent on the type of people, industry and region they are in. For example, a Tier 1 city household with stable employment and income may lament that consumption is recovering strongly on a weekend shopping trip to a local higher-end shopping mall in front of a steady stream of people and queuing restaurants. Meanwhile, for building material traders, air-conditioning installers, taxi drivers and the like in Tier 3 and lower cities, they may feel bemused by the reality that business is getting tougher so far this year. However, the averaged macro trends tend to hide the fact of these micro divergences, bringing about a huge difference between the macro trends and the micro feelings.
Second, there is some distortion in the significance of macroeconomic indicators in a K-shaped recovery. Macroeconomic indicators are aggregates, which are usually a good reflection of the overall economic performance, but an important prerequisite here is that the divergence in the economy is not very serious, or even if there is divergence, it can be regarded as unimportant. Under the K-shaped recovery, the divergence of the various indicators may contain more information than the total (or average) of the information contained in the indicators. The reason for the emphasis on "one city, one policy" in real estate policy is that real estate aggregates and city-specific conditions can vary widely, so city-specific policies cannot be determined simply on the basis of aggregates and national conditions. In the context of a K-shaped recovery, the most important macro-indicators of consumption, investment, exports, income, employment and prices may have to be viewed in the same way, because the traditional macro-indicators are simple weighted averages or sums of micro-data in widely varying situations and even in different directions, and the signals they produce are very limited or even may be misleading. For example, it is absurd to average the rainfall in flooded areas with the rainfall in drought-affected areas and conclude that the whole country is in good shape, and a similar situation may exist with the current macro data.
Third, the K-shaped recovery is likely to be a fragile one with limited sustainability. A sustainable recovery is one in which income, demand and supply reinforce each other in a virtuous cycle. This positive feedback mechanism is poorly transmitted in a K-shaped recovery, and a large proportion of the population, regions and industries may still be under the influence of this positive feedback mechanism in the opposite direction. After the initial recovery process is over, there is greater uncertainty about whether the economy will continue to recover in a sustainable manner.
Fourth, there is an asymmetry in the risks facing the economy in a K-shaped recovery. More specifically, in the case of a K-shaped recovery, the economy is less likely to perform better than expected than it is to perform weaker than expected, and positive shocks are less likely to pull the economy forward than negative shocks are to drag it down. The essential reason here is that under a K-shaped recovery, the upper part of K (i.e., the better part of the recovery) will be a linear process, but the lower part of K (i.e., the worse part of the recovery) will have a non-linear process. To take a very simple example, two businesses, each with 1,000 employees and the same initial sales revenue, one of which grows at 10% and the other declines at -10%, on average these two businesses actually have positive sales revenue growth because the positive growth business will have a larger and larger share. The positive growth firms will also have a roughly linear growth in their investment and number of employees employed. However, this is not the case for a negative growth company. At some point in time, the company will face closure or voluntary exit, and at this time or before, the company's sales, investment and number of employees employed will fall off a cliff, and this decline will be non-linear. When this non-linearity occurs, the average growth rate of the two firms may go from positive to negative. This example illustrates the asymmetry of risk under a K-shaped recovery.
Fifth, in a K-shaped recovery, policy should focus more on the lower half of K. From a macro point of view, in a K-shaped recovery, the lower half of K is more likely to determine the sustainability of the recovery, as there is an asymmetry of risk, and policy must therefore be targeted to hedge against this asymmetry. In terms of specific mechanisms, for the upper half of the K, further policy support would be "icing on the cake", with limited marginal effects. But for the lower half of the K-shape, if there is no further policy support, in the face of greater downward pressure, it will undoubtedly face the situation of "worse", this part of the population's consumption, income, as well as this part of the economic performance of the industry and the region may accelerate downward. For these people, industries and regions, policy care is more like " to send charcoal in a snowy day", the marginal effect of policy will be very significant. Therefore, the focus of policy in a K-shaped recovery should be on the lower half of the K. Taking into account the possible distortion of macro indicators under the K-shaped recovery, a better perspective to examine the success of the economic recovery and the effect of policies in the coming period of time should perhaps be whether the K-shaped recovery has turned into a V-shaped recovery.