
Abstract: The paper discusses the changes in new debt and leverage under two different policy combinations, namely "stabilizing leverage" and "stabilizing demand". The conclusions show that stabilizing demand requires more new debt than stabilizing leverage, but the resulting increase in leverage is much smaller than the result of stabilizing leverage. Finally, in the light of these results, the paper offers three policy suggestions.
Two issues are hugely controversial in the contemporary debate on macroeconomic issues.
The first was whether large-scale stimulus should be used, and it was emphasized that the efficiency of debt-driven GDP was declining and that the leverage ratio was already very high. The second is whether it is useful to adjust interest rates, and some views emphasize that private sector consumption and investment are less sensitive to interest rates and are busy repairing their balance sheets.
The paper first excludes the portion of new debt that comes from interest payments, and finds that the proportional relationship between actual new debt and new GDP appears to be roughly stable, suggesting that there does not appear to be a significant deterioration in the efficiency of debt in creating GDP.
In order to better clarify the relationship between debt expansion, interest rates and macro-leverage, we try to use a concise and basic differential equation model to characterize the evolution path of macro-leverage. On this basis, we discuss the changes in new debt and leverage under two different policy combinations, namely "stabilizing leverage" and "stabilizing demand". The conclusions show that stabilizing demand requires more new debt than stabilizing leverage, but the resulting increase in leverage is much smaller than the result of stabilizing leverage. Finally, in the light of these results, we offer three policy implications.
This is the third one we have written on this topic. The first one says that China does not have excess savings. Second, we say that China's quantity of money is not too much, but perhaps too little. In hindsight, the two articles may have essentially said the same thing, as if the blind man touched one leg and then the other. This one is thinking about macro-leverage, and the conclusion might be a little counterintuitive. It must be emphasized that we do not have any preconceived notions. It is simple logic and calculation, with a few assumptions, that lead us to the relevant conclusions.
I. A FEW POPULAR IDEAS ABOUT LEVERAGE AND INTEREST RATES
In the current debate over macro-economic issues, there are two big arguments. The first is whether large-scale stimulus should be used. A big part of the worry is that debt will grow again. The second is whether interest rate adjustments will help at all, with some arguing that lower rates will do little to promote economic recovery in the current climate.
The first emphasizes that the efficiency of debt in generating GDP is declining rapidly. We use the scale of social financing to represent total debt, and the scale of “New social financing/new nominal GDP” to measure the efficiency of incremental debt to generate GDP. A reduction in the efficiency with which debt creates GDP means that each additional unit of GDP requires more and more debt. The evidence for this fear seems obvious. For example, in 2020, the scale of our new social financing is 32 trillion, the new nominal GDP is 2.7 trillion, the ratio of incremental debt to incremental GDP is about 13, that is, for every 13 yuan of additional debt, one Yuan of new GDP is created. That compares with an annual average of 3.5 in 2012-19.
It is further pointed out that the decline in the efficiency of debt-creating GDP is only a superficial phenomenon, which in essence reflects the changes in the efficiency of debt-creating entities. On the one hand, both the private and public sectors are using debt less efficiently, not least because of lower returns on investment projects. On the other hand, an increasing share of incremental debt is coming from the public sector, which uses it less efficiently than the private sector, ultimately leading to a reduction in the efficiency of incremental debt in generating GDP. Thus, maintaining economic growth through continued increases in debt will not only require much more debt than before, but may also lead to further deterioration in efficiency.
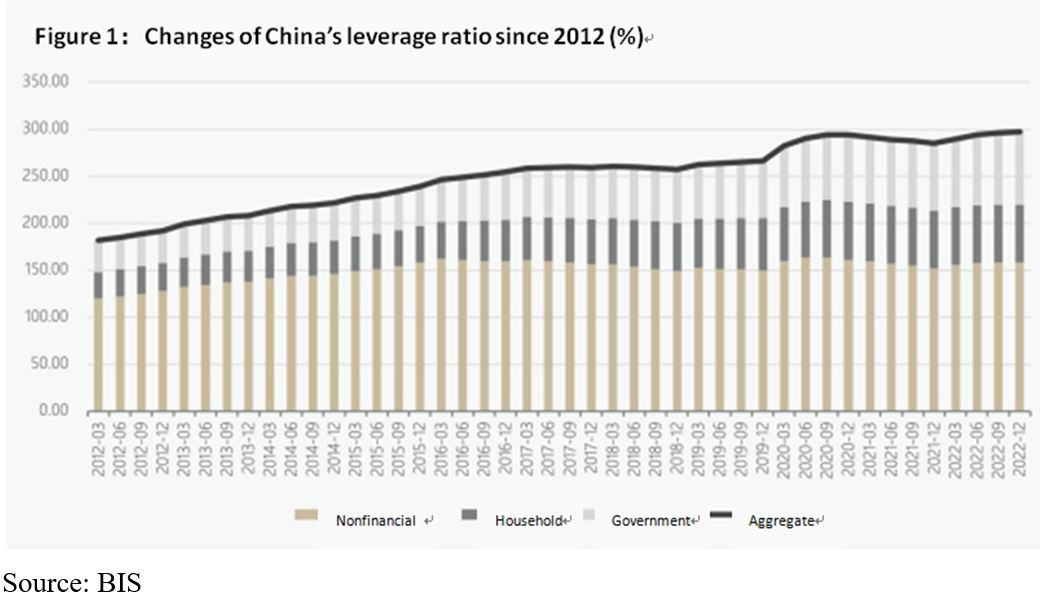
The second point of view emphasizes that the macro-leverage ratio of our country is already very high, and further increase of debt will increase the leverage ratio and challenge the debt sustainability. As shown in Figure 1, our leverage ratio is 297.2 per cent at the end of 2022, compared with 181.9 per cent in 2012and a cumulative increase of 115.3 per cent over the decade, according to the BIS leverage data. Of this, macro leverage in the non-financial corporate sector, the household sector and the government sector rose by 38 per cent, 33.3 per cent and 44 per cent respectively. From the perspective of horizontal comparison, the macro-leverage ratio of our country is obviously higher than the average leverage ratio of emerging economies. Therefore, some hold the point of view that our macro-leverage ratio has been at a relatively high level, the space to add leverage is very limited, and the macro-level debt risk will rapidly accumulate. It is important to note that the BIS data may have overestimated the actual leverage ratio in China, but the trends shown by the BIS data are broadly in line with reality.
The third point of view emphasizes that the sensitivity of the main body of the economy to the change of interest rate is declining, and further lowering the interest rate has little effect on stimulating the economy. The main logic behind this is twofold. First, because the economic main body’s expectations have not yet substantially improved, the risk preference drops, and the asset price is lower, our country’s interest rate elasticity for consumption and investment is not high, further interest rate cuts in the short term will have only a limited effect on stimulating consumption and investment. Second, economic agents are busy repairing their balance sheets and saving more rather than lending more. Thus, until the balance sheet is fully repaired, further interest rate cuts will not change their behaviour and will not lead to increased spending and increased demand for loans.
In view of the above points, we try to analyze the implications of these points from the perspective of macro-leverage ratio.
II. THE EFFICIENCY OF CREATING GDP BY NEW DEBT IS STABLE, AND THE SCALE OF INTEREST EXPENDITURE CAN NOT BE IGNORED
On the macro scale, as long as there is no large-scale change in the main body of borrowing and the debt is still growing, in essence, interest payments will eventually be covered by new debt. Thus, only incremental debt, minus interest payments, is what really creates GDP. Thus, the efficiency of debt-to-GDP creation can not be measured directly by the amount of new social financing, but by subtracting the amount of new social financing spent on interest payments and then comparing it with the amount of new nominal GDP. This is similar to the consideration of the fiscal distinction between the total fiscal deficit and the primary fiscal deficit (that is, the fiscal deficit other than interest payments).
We define the scale of new social financing minus the interest expense as “The actual scale of new social financing” as shown in Table 1. Between 2012 and 2022, the cumulative amount of new social financing in our country was 268.2 trillion yuan. Of this total, the cumulative value of interest expenditure over the years was 90.4 trillion yuan, accounting for 33.7 percent; the cumulative value of the remaining amount of actual new social financing was 177.8 trillion yuan, accounting for 66.3 percent. As a result, interest payments account for one-third of new debt over the past decade, and that may be a conservative estimate.
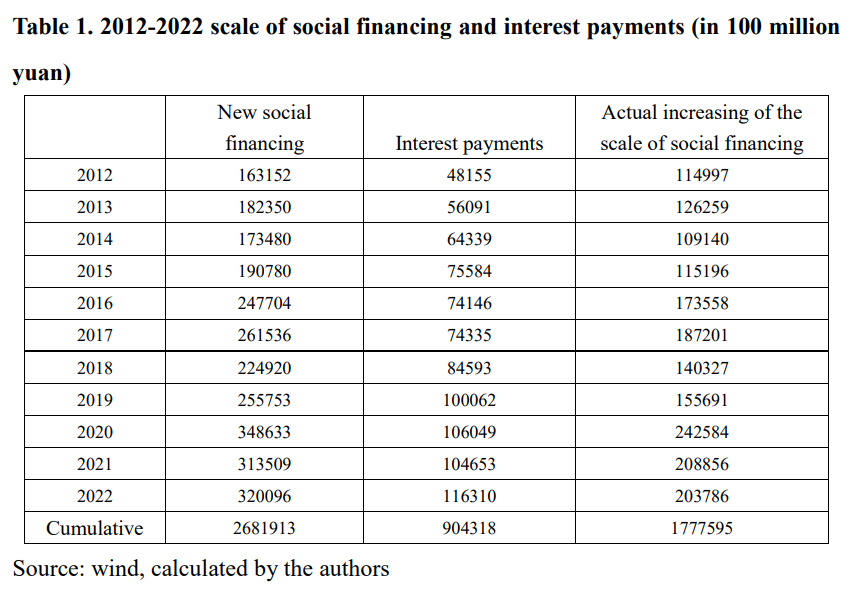
After these revisions, we examine the efficiency of debt-to-GDP creation in terms of the ratio of actual new social financing to incremental GDP, as shown in Figure 2. From 2012 to 2019, our country's “Actual new social financing scale/incremental GDP” has been fluctuating around the annual average level of 2.3, and the fluctuation does not appear to be large, nor does it have a continuous upward trend. In other words, there does not appear to have been a significant decline in the efficiency of new debt to generate GDP in 2012-2019.
From 2020 to 2022, the average of new social financing scale/new nominal GDP in our country is 4.6, which is higher than the average level from 2012 to 2019. However, this phase is highly volatile, reaching 9 in 2020 and falling to 1.5 in 2021.
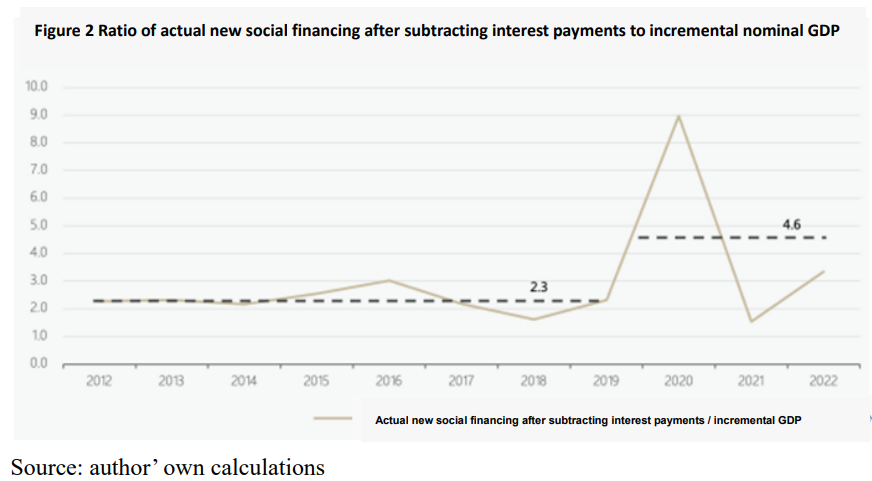
Considering that the average is susceptible to extremes when calculated directly from annual data, we examine the change in the efficiency of debt-to-GDP creation as a whole in both phases. The results are shown in Table 1.
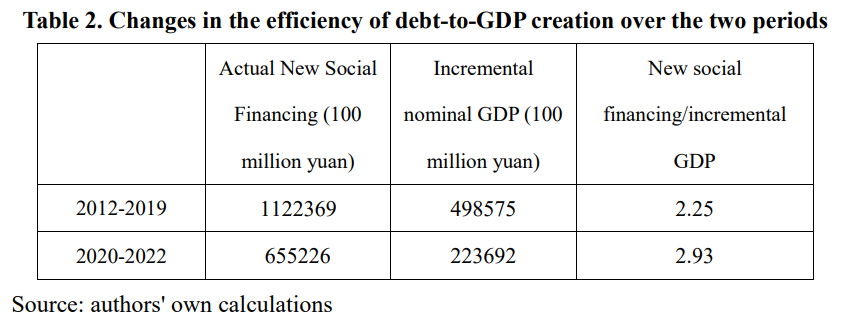
In 2012 to 2019, the cumulative amount of new social financing was 112.2 trillion yuan, and the cumulative amount of new nominal GDP was 49.9 trillion yuan. The ratio of the two was 2.25 yuan, slightly below the annual average of 2.3 yuan.
From 2020 to 2022, the cumulative amount of new social financing was 65.5 trillion yuan, and the cumulative amount of new nominal GDP was 22.4 trillion yuan, the ratio of which was 2.93, significantly lower than the annual average of 4.62 yuan.
Thus, even if we think that the efficiency of debt-to-GDP creation declined during this period (from 2.25 to 2.93), the decline was not as large as that directly measured by the annual average (from 2.3 to 4.62).
It is worth mentioning that the 2020-2022 period was characterized by a persistent output gap resulting from exogenous shocks, with a significant portion of the actual additional social financing being used to fill sudden demand and income gaps, this is not reflected in incremental GDP (for a more detailed discussion, see “Where's the money?”). With this in mind, we tend to think that the 2020-2022 decline in debt-to-GDP efficiency will be smaller than that.
III. A CONCISE MODEL OF THE DYNAMIC PATH OF MACRO LEVERAGE
In order to clarify the relationship between debt expansion, interest rate and macro-leverage ratio, we try to describe the evolutionary path of macro-leverage ratio with a simple and basic difference equation model. The model is essentially non-economic, a pure set of accounting or statistical equations in which the only assumption is that the efficiency of debt in generating GDP is roughly constant, and this is supported by the previous data. Specifically, the change in macro leverage depends on two difference equations:
A. Economic Growth Equation:
(1) 
Among them, Gt is the scale of nominal GDP in T period and g is the growth rate of nominal GDP.
Debt accumulation equation:
(2) 
Here, Dt is the stock of T-term debt; a is the efficiency with which debt creates GDP; and r is the nominal interest rate. The implication of Formula (2) is that there are two sources of new debt, one is interest payments, and the other is additional debt corresponding to new nominal GDP.
Combining these two formulas yields a macro-leverage ratio:
(3) 
To solve the above equation, we know that:
(4) 
(1) When there is no interest expense, that is, r=0, the steady-state level of leverage is a, i.e., the incremental debt required per unit of new GDP. Any deviation from this initial steady-state level will eventually return to this steady-state level. For example, if the initial macro-leverage ratio was 300 per cent, the effect of stimulating growth through debt expansion would be to gradually reduce it until it returned to 250 per cent. In other words, the steady-state leverage ratio depends only on the efficiency of debt in generating GDP, independent of nominal economic growth, and the higher the efficiency of debt in generating GDP, the lower the steady-state leverage ratio. The result should not be surprising. Without interest payments, the average macro-leverage ratio would eventually settle at the marginal leverage ratio, which is, the incremental amount of debt required per unit of new GDP.
(2) When 0<r<g, the steady-state path of macro-leverage ratio depends on the efficiency of debt in creating GDP, a, the growth rate of nominal GDP, g, and the nominal interest rate r.
Further, g = g? + π, among these g? is the growth rate of potential output and π the rate of inflation. The equation shows that a change in nominal GDP growth is equal to a change in the rate of inflation, when the potential growth rate is constant (real growth equals potential growth). The steady-state expression for leverage is:
(5) 
Deriving for a, π, and r, respectively, yields
The equation above can be expressed in terms of lower steady-state macro leverage as debt creates GDP more efficiently, lower inflation increases, and lower steady-state leverage as interest rates decrease. These conclusions seem straightforward and don't require much explanation. It is important to note that this article does not attempt to discuss the following two scenarios: the first is an increase in potential output growth. It is clear that higher potential output growth can also reduce steady-state leverage, but that higher potential output requires structural policies rather than the macro policies discussed here. On the one hand, within the simple framework of this paper, from the perspective of macro-leverage alone, there is no essential difference between the effect of raising potential output and the effect of raising inflation. The second is the case r>g. This means that even without new debt, the stock of debt will grow faster than the economy because of interest rates, in which case macro leverage will be difficult to restrain itself.
Next, we combine the actual data of our country and make a numerical simulation of the change of China's macro-leverage ratio under different parameters to show the possible influence of each parameter on the macro-leverage path.
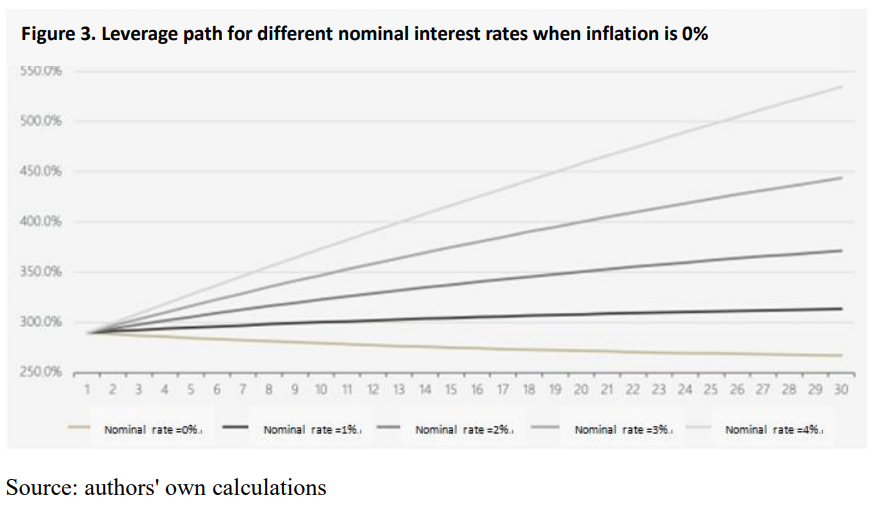
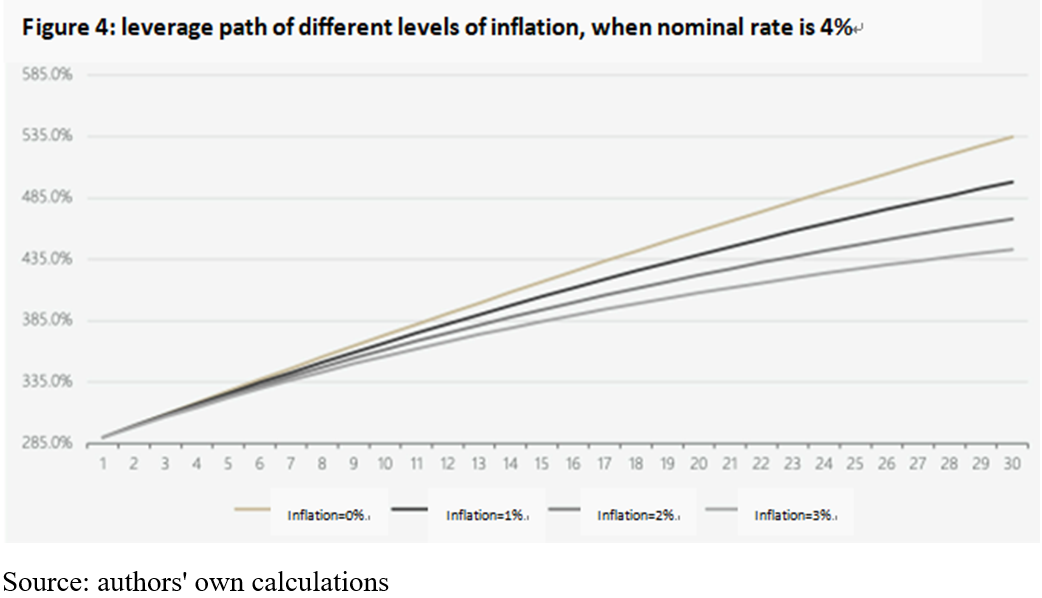
We set the initial macro leverage ratio l0=290%, the potential growth rate, the inflation (GDP deflator) π=0%, the nominal interest rate r=4%, the efficiency of debt to create GDP a=2.6. Figures 3 and 4 show the dynamics of macro leverage under different nominal interest rate and inflation scenarios, respectively. As Figure 3 shows, the path of leverage under different levels of interest rates is very different, and this difference is already evident at t = 10. At t = 10, for every one percentage point fall in the nominal interest rate, the corresponding level of leverage falls by 20-25 percentage points.
Changes in inflation do not affect leverage as much as interest rates, or are less sensitive to changes in inflation than interest rates, but they are still noteworthy. Let's also take the example of T = 10, where every 1 percentage point rise in inflation reduces leverage by about 7 percentage points.
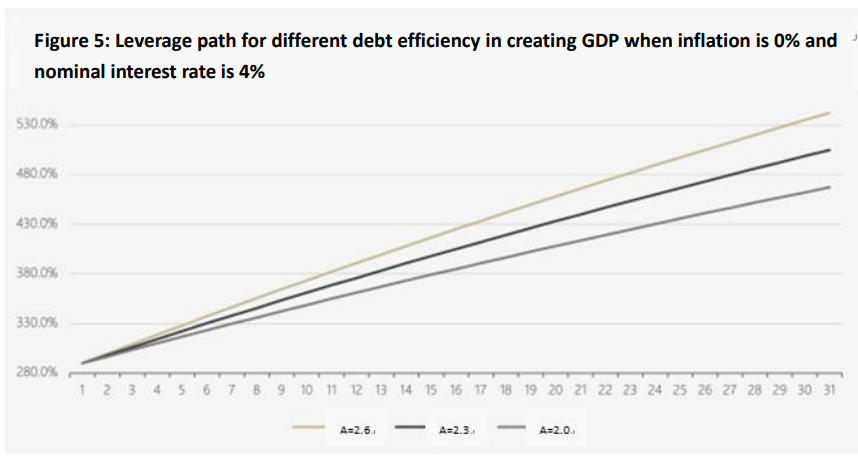
From the formula, the effect of debt-GDP efficiency on the steady-state leverage ratio is basically linear. As shown in Figure 5, other things being equal, the dynamic path of the leverage ratio corresponding to different values can be seen to be almost translational downward; the slope of the dynamic path does not change much. Again, at T = 10, for every 0.3 reduction in a, leverage drops by about 14 percentage points.
The paths of these simulations describe how the changes in the main parameters affect the changes in the macro-leverage ratio. We can see the following points: first, the view that interest rate reduction is of little use does not seem to take into account the huge dynamic impact of interest rates on macro-leverage, seemingly small changes in interest rates have a huge macro-impact. Second, focusing solely on the efficiency of debt-to-GDP does not seem to solve the problem of rising leverage. Even with a very significant increase in the efficiency with which debt creates GDP, macro leverage will continue to rise if nominal GDP growth and nominal interest rates stay at 5% and 4%, respectively. Third, from a pure leverage-control perspective, raising potential growth is as effective as raising inflation. Raising potential growth by one percentage point is likely to be extremely difficult, but it would be relatively easy to raise inflation from around 0 per cent to around 1 per cent.
III. CHANGES IN MACRO-LEVERAGE UNDER DIFFERENT MACRO-POLICY COMBINATIONS
The next step is to consider the change in macro leverage under different macro policy combinations, assuming that policy affects more than one parameter. Here we assume that no short-term macroeconomic policy can affect the efficiency of debt-to-GDP creation or the potential growth rate of the economy. This assumption is based on the classical dichotomy and to avoid confusion between macro and structural policies. So whatever macroeconomic policy turns out, it can affect only nominal interest rates, inflation rates and the amount of nominal debt.
We consider two different policy combinations, one that we call “To stable leverage” and one that we call “To stable demand”. Macro policy we here simplified as interest rate policy, the scale of social financing growth, including the expansion of the government's nominal debt rate. Specifically:
“To stable leverage” policy mix: in order to keep macro leverage stable, keep interest rates basically stable, control the growth rate of the scale of social financing, including the scale of new public sector debt. Under this combination, debt growth is slow but still enough to support a real GDP growth of 5 per cent, nominal interest rates are high at 4 per cent but inflation is low at 0 per cent.
“To stable demand” policy mix: adopt “Keynesian” type of aggregate demand management policy, reduce the nominal interest rate to 2%, increase the public sector deficit, and social financing scale growth, the real GDP growth rate is still 5%, but inflation would rise to 3%.
Under both policy combinations, debt creates GDP with the same efficiency, that is, it remains the same.
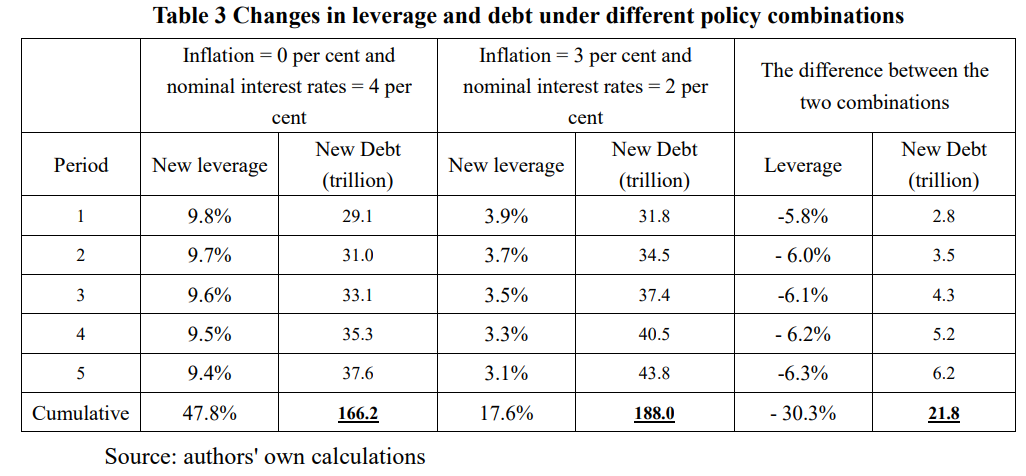
Combined with the formula, we can calculate the change of leverage ratio from new debt under the policy combination of “To stable leverage” and “To stable demand” given 5% real growth rates. In order to be more realistic, our data mainly refer to the corresponding macro data in 2022. Nominal GDP is 120 trillion, and the stock of debt is 334 trillion. The two combinations are shown in Table 2.
As shown in table 2, under the “To stable leverage” policy mix, 5 per cent real growth corresponds to an annual increase in macro leverage of about 9.5 per cent, with a cumulative increase of 47.8 per cent over five years. Between 2012 and 2022, our macro leverage increased by 120%, with an average annual increase of 11%. A 9.5% average annual increase in macro leverage looks more like the reality of the past decade. Under this combination, the cumulative amount of new debt required over five years is 166 trillion.
Given the same real growth rate, the “To stable demand” policy mix would require significantly larger amounts of new debt, but significantly less leverage than in the first case. Over five years, the amount of new debt needed was 188 trillion yuan, 21.8 trillion more than the “To stable leverage” portfolio, but the new leverage is only 17.6%, 30.3% less than the previous situation.
There may be some doubt that the two very different policy orientations (the difference in new debt over five years is 21.8 trillion yuan, which is probably far larger than any possible stimulus), how can there be no difference between the real growth rate of the economy and the efficiency with which debt generates GDP? What is the point of such calculations and comparisons under such unrealistic assumptions? We would like to emphasize that this is precisely the purpose of this calculation. We are not trying to repeat the very important discussions about potential growth, reform or stimulus, efficiency of capital use, what we are trying to show is that, some key nominal variables may be more important for macro leverage. Of course, from another perspective, this also shows that macro-leverage itself is not necessarily the most important issue, after all, macro-leverage is one nominal value divided by another.
IV. SEVERAL IMPLICATIONS
First, interest payments are likely to influence our impression of the scale of debt accumulation and the efficiency of debt-to-GDP creation in China. A simple calculation in this paper shows that one-third of the new debt in the past 10 years came from interest payments, considering that the actual cost of financing is likely to be higher than the relevant statistics, it is likely that a higher proportion of the new debt will come from interest payments. At the same time, the ratio of actual new debt to new GDP looks broadly stable, if this interest expense is not taken into account. The increase over the past three years, though, may have been due to exceptional disturbances. The efficiency of debt-to-GDP creation does not seem to have declined as much as one might think.
Second, the usual arguments against large-scale leveraging or interest rate cuts are debatable, at least from a macro-leverage perspective. The objective reality of our country's economy for many years is that it needs 2.3 yuan or more of new real debt to correspond to 1 Yuan of new GDP. If we consider the interest expenditure, we need more than 3 Yuan of new debt to 1 yuan of new GDP, and our stock of debt has been very large. These basic facts determine, in the short term, whether to add more leverage or less leverage, whether to use funds more efficiently or to use funds less efficiently, changes in macro leverage are far less important than changes in stock debt, inflation levels and interest rates. The most important variable here is the interest rate, and adjusting the interest rate even though, as some argue, does not change the behavior of the economy's main consumers and savers and does not have a clear stimulant effect on the economy, it is crucial to controlling macro-leverage.
Third, reducing leverage may require increasing it. The molecule of macro-leverage is nominal debt and the denominator is nominal GDP. Controlling macro-leverage means slowing the growth of the molecule (or even falling in absolute terms), accelerating the growth of the denominator, or both. The most direct way to slow down molecular growth is to maintain a low interest rate environment, given the fact that the total amount of debt is already large and economic growth still requires debt growth. With 300 trillion in debt, 4% interest costs 12 trillion a year, and 2% interest costs 6 trillion a year, the difference is a whopping 6 trillion. One way to accelerate the denominator is to try to increase the potential growth of the economy, or to raise the level of inflation by a modest 2 percentage points, nominal GDP would rise by 2.4 trillion. Low interest rate plus leverage is the practice of slowing down molecular growth and accelerating denominator growth. The practice of low interest rate and increasing leverage is also in the same direction. Moreover, there is no contradiction between this practice and simultaneously promoting reform and improving the efficiency in the use of funds, there is no substitute.
At this point, we suddenly realize that this article may be a repeat of the previous two articles from a new perspective; we may be touching another one of an elephant's legs. There's no excess savings, there's not much money, deleveraging requires more leverage, these counterintuitive-sounding conclusions come up again and again, but these counterintuitive conclusions are not contradictory but highly complementary, consider that there is a high degree of consistency in the underlying logic. So, there are only two possibilities, either we're getting further and further away from the wrong analysis, or we're getting closer to figuring out the whole picture of the elephant.