
Abstract: Recently, “balance sheet recession” has become a buzzword, which means that China’s economy has experienced a situation similar to Japan’s in the 1990s, also known as Japan’s “Lost Decade”. Many are worried that China will repeat Japan’s mistake and suffer a prolonged recession. The author argues that China and Japan are vastly different in their growth patterns, institutions, and manufacturing development trends. China’s share of the global economy will continue to rise. Instead of “l(fā)osing a decade”, China will “gain a decade”. China’s economic structure needs optimization in the next decade but will unlikely undergo major changes. To achieve modernization with Chinese characteristics, China should benchmark itself against the United States, also a populous country, rather than Japan.
I. CHINA’S ECONOMY IS UNDER MORE PRESSURE BUT MEANWHILE HAS MORE SPACE FOR DEVELOPMENT
Japan and the Republic of Korea are East Asian countries and are two examples of successful economic transformation after World War II. Although its economy fell into a prolonged slump after the real estate bubble burst in the 1990s, Japan is still the world’s third-largest economy, demonstrating its indisputably solid economic foundation.
Here is a comparison of the economic development levels between China and Japan. In 1970, when Japan became an aging society (over 7% of the population is above 65 years), the per capita GDP had already reached 2,056 dollars (at current prices); in 1994, when Japan became a deeply-aged society (over 14% of the population is above 65 years), the per capita GDP had reached 39,933 dollars, and thus Japan became a developed economy; whereas, in 2021, when China became a deeply-aged society, the per capita GDP was only 12,556 dollars, still belonging to the upper middle-income economies as defined by the World Bank, instead of becoming a high-income country.
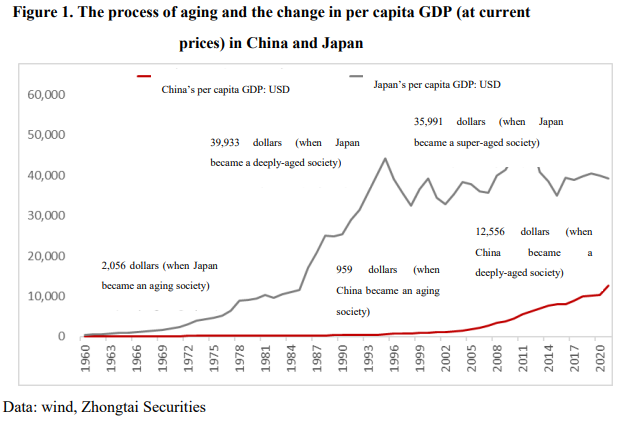
In other words, China’s current aging rate is comparable to Japan’s about 30 years ago, but China’s per capita GDP now is less than one-third of Japan’s then. That is to say, even before “l(fā)osing three decades”, Japan had been lying in the cradle of the developed countries, while China is still striving to cross the threshold of high-income countries and meanwhile avoid falling into the “middle-income trap”, on account that many countries, such as Russia, Brazil, Iran, and South Africa, once fell from the high-income economies into the “middle-income trap”.
The economic development levels between China and Japan can also be analyzed from the perspective of the macro leverage ratio (the share of social debt balance to GDP). China’s current macro leverage ratio has already been high compared with other countries. According to the National Institution for Finance and Development, in 2021, China’s macro leverage ratio was 263.8%, close to the average of developed countries and significantly higher than that of developing countries.
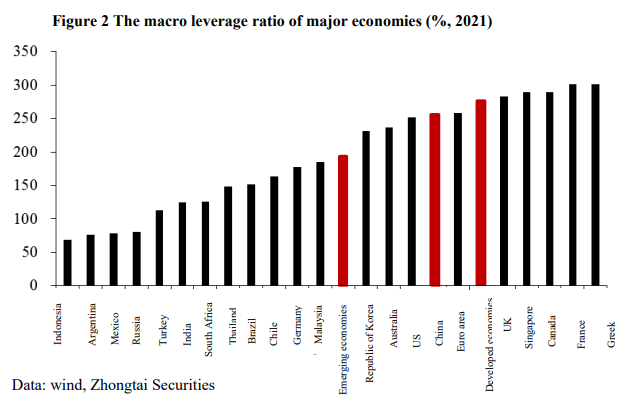
The larger the debt scale is, the larger the annual debt service scale is and the greater the consumption of financial resources is. Take municipal bonds as an example. Since 2011, interest-bearing municipal bonds have been expanding rapidly nationwide, with an annual growth rate above 10%. At the end of 2022, the interest-bearing municipal bonds totaled 51.96 trillion yuan, an increase of 6.7 times over the 6.8 trillion yuan in 2011. According to our calculation, in 2022, the interest expense accounted for 37% of the new social financing, and the share was even higher in the previous years.
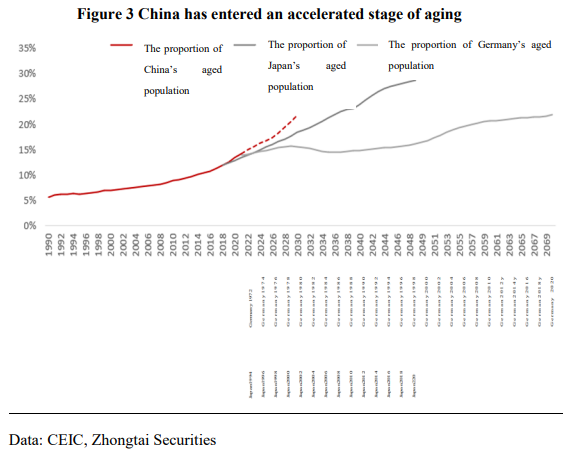
Since 2022, China has entered an accelerated stage of aging, i.e., those born in the second baby boom (1962-1974) have grown old (defined as above 60 years old in China and above 65 years old according to the international standard) and retired. In 2022, China’s population over 65 had already reached 14.9%, and the deep aging process began to speed up. In comparison, in Germany, the elderly population totaled 14% in 1972, and only after 36 years (2008) exceeded 20% when Germany became a super-aged society. It took France 24 years to transform from a deeply-aged society to a super-aged one, and it took Japan 12 years (1994-2006). China’s aging process may be faster, and according to the current birth and death rates, it is estimated that the transition to a super-aged society may occur right after 2030.
While aging is accelerating, China’s urbanization is slowing down. In 2022, first-tier cities such as Beijing, Shanghai, and Shenzhen witnessed negative resident population growth. Was it contributed by the reduction of employment opportunities due to the pandemic? According to the seventh census, from 2010 to 2020, the return of migrant workers above 50 to their hometowns was quite ubiquitous. Therefore, with the decrease in young people and the slowdown of urbanization, the demand for house purchases declined, and the real estate industry entered a downward cycle. The exact inflection point might have appeared in June 2021. Therefore, China’s investment-driven economic growth model needs to be transformed.
According to the above data, it is clear that China is “aging before getting rich” due to its identity as a “l(fā)atecomer” developing country, while Western countries are generally “getting rich before aging”. Moreover, just like Japan in the 1990s, China encountered similar problems like weakening real estate, an aging population, and an increasing social debt burden.
However, the institutions of China and Japan are significantly different. China has a large population and a vast territory. Institutionally, it has a big government and a huge market, while Japan has a small government and a medium market. Specifically, as the second largest economy in the world, China has the largest and most influential industrial and supply chains. The Chinese government formulated and implemented various development strategies, such as the “Belt and Road” strategy, a community of shared future for mankind, and other international development strategies. China has even more industrial development strategies, such as the Internet, 5G, digital economy, green energy, electric vehicles, and large airplanes, which the government strongly supports..
In contrast, the Japanese government seems to lack the resources to organize and the ability to guide the development of new industries, so in recent years Japan has not scored many outstanding outcomes in the new economy.
From 1994 when Japan became a deeply-aged society to 2021, its average annual GDP growth rate was only 1.2%, and its GDP experienced negative growth several times. Japan’s economic revitalization is hard, even if it reduces the interest rate to zero or negative. In contrast, China’s economy didn’t witness negative growth in the subprime crisis or during the three years of the pandemic, for which the Chinese government should take credit. From this perspective, China has more space for economic development.
Globally, in the past two decades, all major economies have experienced negative economic growth more than twice, and China was the only exception, demonstrating the advantage of a big government. But meanwhile, in the past two decades, the growth in debt seemed greater, which is worth reflecting upon. Therefore, from now on, high-quality growth is a must.
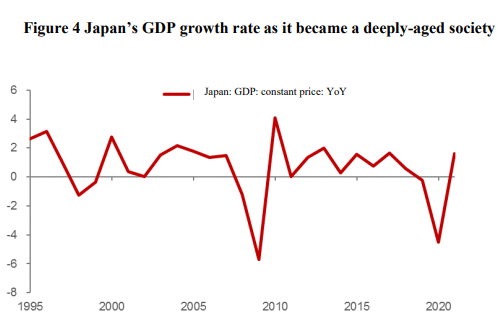
Data: CEIC, Zhongtai Securities
II. THE ZERO-SUM SITUATION IN THE STOCK ECONOMY: JAPAN LOST THREE DECADES, WHILE CHINA ROSE DURING THESE YEARS
Most reports analyzing the reasons for Japan’s long-term economic stagnation focus on Japan’s domestic economic policies, including monetary and industrial policies. Most believe that the continued sharp appreciation of the yen as a result of the Plaza Accord was the main factor weakening Japan’s competitiveness. In addition, the sharp rise in the salaries of Japanese manufacturing workers also led to a decline in export competitiveness.
Before the 1990s, though the yen had appreciated significantly, Japan’s share of global exports still rose, reaching 10% in 1986. China’s export share was only about 2% in 1993, while the share of Japan totaled 9.5%. The rapid rise in China’s export share did not occur in the 1980s after the reform and opening up but after 1993. Japan’s export share fell from 9.3% in 1993 to 3.8% in 2013, while China’s rose to 11.7% in 2013, and the export shares of Asian countries such as the Republic of Korea, Vietnam, and India changed little over this period.
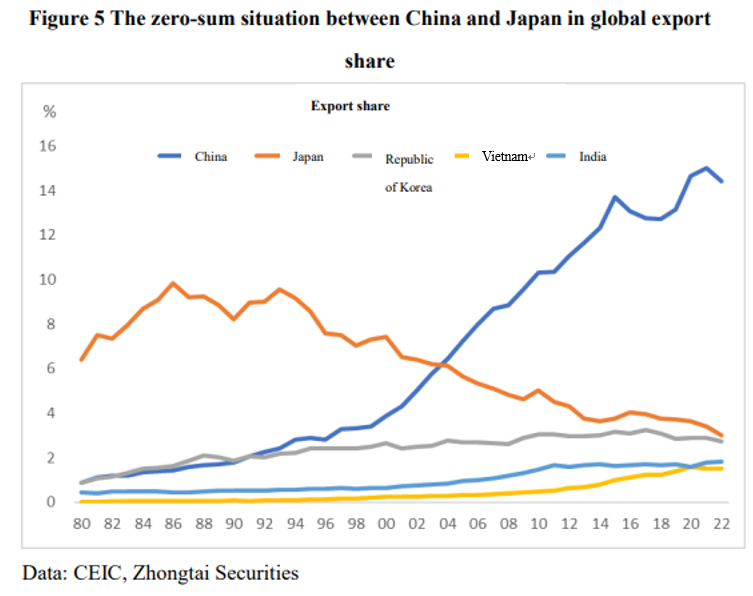
Many worry that the outward migration of China’s manufacturing industry will lead China to follow Japan’s beaten track featuring industrial hollowing out and economic stagnation. But who is the recipient of China’s industrial migration, India or Vietnam? Over the past decade (2012-2022), India’s global export share rose by only 0.2 percentage points. Vietnam’s share rose a little more, by 0.9 percentage points to 1.6%, and China’s by 3.3 percentage points.
Moreover, the global share of China’s manufacturing value added is rising at one percentage point per year. Therefore, China’s current manufacturing development trend is very different from that of Japan after the 1990s. Although it is currently “contained”, China is not closely followed since China’s GDP is now about 5.5 times the size of India and over 50 times the size of Vietnam.
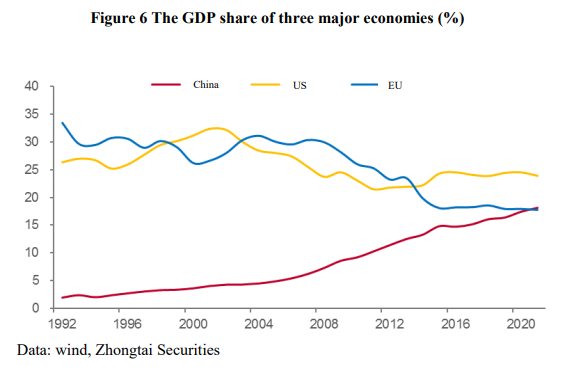
About three decades ago, in 1992, the GDP of the EU accounted for 33.4% of the world, the United States 26%, and China 2%. Today the United States takes up 24%, the EU 17.8%, and China 18.5%. The past 30 years also witnessed a clear zero-sum situation; that is, China has now overtaken the EU and become the second-largest economy in the world.
Then, in the next decade, will China’s economy repeat Japan’s trajectory of the 1990s? It depends on the potential growth rate of China’s economy in the next decade or the difference in the average economic growth rate between China and the world. The so-called “l(fā)ose” is a relative concept. For example, the statement that Japan “l(fā)ost 30 years” does not mean Japan’s economy did not grow, but the growth rate was relatively low compared with the global average. Japan’s average growth rate still exceeded 1%.
Throughout the 2,000 years of global economic history, from AD 1 to 1820, the average growth rate was only 0.1%, and per capita income only grew by about 40% during these 1,800 years. Only in the 200-odd years after 1820 and up to the present have the achievements of the Industrial Revolution been widely applied, resulting in a substantial increase in labor productivity and an average annual GDP growth rate of 2.1%. Therefore, we should not consider that human development “l(fā)ost 1,800 years” in the last 2,000 years.
Then, in the future, what are the potential growth rates of China’s and the world economies?
Since the beginning of this year, the industry as a whole has maintained the expectation that this year’s economic growth rate will total 6%. In comparison, the government’s work report only gave an expected target of about 5%. At present, the economic recovery seems weaker than expected, so the market expects the government to introduce a strong stimulus to stabilize growth. Most scholars concluded that the potential growth rate will total 5.5%, and some even conclude that it will exceed 8%.
If most domestic scholars are right, China’s economy won’t lose a decade, will it? An average annual growth rate above 3% has been a medium speed. According to the report by the World Bank on March 27th this year, against the backdrop of slowing economic growth in major economies, the global potential economic growth rate will fall to its lowest level since 2000, with the average annual growth rate projected at 2.2% between 2023 and 2030.
I agree with the conclusion of the World Bank because, in the next decade, most economies will become aging societies, and factors such as the imbalance of economic structure and the escalation of geopolitical friction will lead to the intensification of global political shocks and a lower economic growth rate than that of the past decade. Even if the rate may exceed the World Bank’s forecast of 2.2%, it’ll take a lot of work to total an average growth rate of 3%.
That is to say, in the next decade, as long as China’s average GDP growth rate exceeds 3%, China’s economic share will rise. Therefore, instead of “l(fā)osing a decade”, China will “gain a decade”.
However, in my opinion, most scholars are optimistic about China’s potential growth rate. The potential economic growth rate has two meanings: one refers to the usual potential economic growth rate when all resources are given full play as planned; the other is the maximum potential economic growth rate when the role of all resources is maximized. In the past, China’s GDP growth curve was perfect, which was contributed by the excessive capital input. In the future, the excessive debt ratio will constrain the counter-cyclical policy of the government sector (capital input), thus affecting the potential growth rate. In other words, we can no longer consider the frequent counter-cyclical policies of the past as the future norm to predict the potential growth rate.
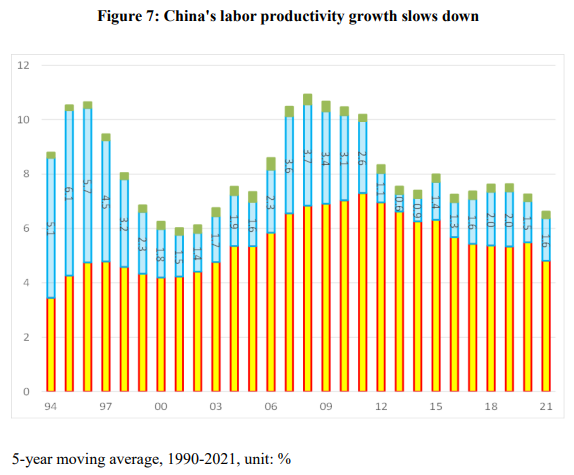
Thesis: Labor Productivity Growth = Quality of Labor Force (Green) + Contribution of Capital Density (Yellow = Capital Scale/Numbers of Labor) + Total Factor Productivity (Blue)
Recent years have shown that the contribution of the quality of the labor force to labor productivity has barely changed, indicating the absence of an "engineer dividend" effect. Moreover, the contribution of total factor productivity to labor productivity significantly declined after 2010, maintaining roughly 1.5%. In recent years, capital input has remained the most substantial contributor.
The potential growth rate can be gauged by two auxiliary indicators: the yield on ten-year government bonds and the marginal output rate (the return gained from each additional capital unit). Currently, the yield on China's ten-year government bonds is around 2.7%, which is relatively low and is related to the central bank's long-standing low-interest-rate monetary policy. Therefore, it is reasonable to assume that the potential growth rate for the next decade should not exceed the bond yield by two percentage points.
In summary, there are two points: First, China's economic growth rate may continue to decline in the next ten years, mainly due to the downturn in the construction cycle, which represents medium-to-long term trends. This is similar to the situation in Japan in the 1990s—population aging leads to decreased demand for real estate, which is an invincible economic law.
Secondly, a cliff-like decline or prolonged stagnation is unlikely for China's economy. In resource allocation in China, the government can play a crucial role, such as strict limitations on banks and various institutions participating in real estate investment, and adopting specific control measures on land, home purchases, housing prices, and mortgages. During the formation of Japan's real estate bubble, there was little control over land and finance, leading to the central bank, financial institutions, and corporations getting trapped in the stock and property markets.
Moving forward, the government can continue to support steady economic growth through industrial policies, regional economic policies, and fiscal and monetary policies. Additionally, the government has vast resources at its disposal.
III. ADHERE TO HIGH-LEVEL OPENNESS -
MOVE TOWARDS A MANUFACTURING POWER AND INCREASE THE PROPORTION OF THE SERVICE SECTOR
The structure of China's economy needs optimization in the next decade, but it is unlikely to undergo major changes. For instance, China's economy has achieved remarkable accomplishments since its emergence in the 1990s. Its status as the "world's factory" in manufacturing is unwavering, with China's manufacturing added value accounting for 30% of the world while its population represents only 17.5%; its export share far outpaces any other economy. Among the three major global industrial chains, the one led by China is the strongest.
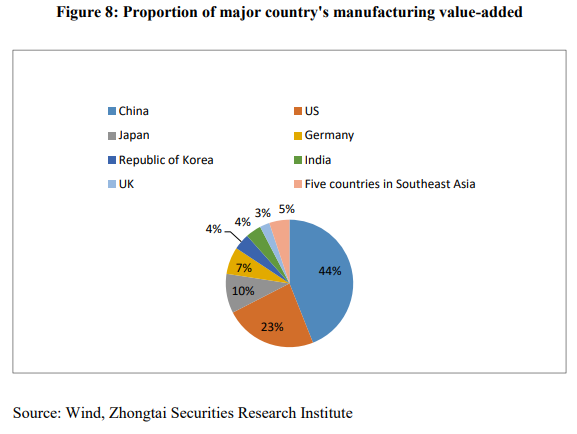
The figure above reflects two features of China's economic structure: China's position as a global manufacturing giant is unshakeable, and only by maintaining high-level openness and a global export share of at least 10% can China avoid overcapacity in manufacturing.
It seems to be a consensus that the weight of China's service industry has risen too rapidly, and the weight of manufacturing has fallen too much. Therefore, the proportion of manufacturing should be increased. This viewpoint is open to discussion: although the share of China's manufacturing value added to China's GDP has fallen, its share in global manufacturing value added is still rising.
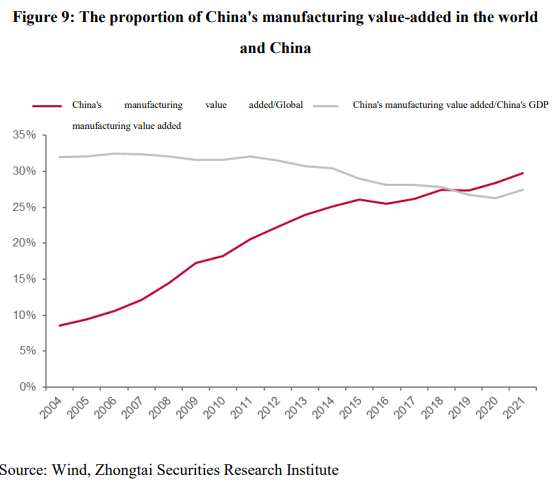
Since China's manufacturing industry is almost completely competitive and there are fewer controlled industries or sectors, its degree of marketization is higher. In contrast, more restrictions exist on the service industry, such as education, medical care, cultural entertainment, telecommunications, financial services, etc. Generally speaking, competitive industries are prone to oversupply, while controlled industries are prone to undersupply.
For example, the tertiary hospitals in first-tier cities have long been overcrowded, indicating insufficient supply; skyrocketing prices of school district housing reveal an undersupply of education resources. From January 17th to May 17th this year, some collections from the National Gallery of the UK are exhibited in the Shanghai Museum. Despite the exhibition's small size, it attracted a massive audience from local and other provinces, so much so that the Shanghai Museum stayed open 24 hours for the first time, indicating a shortage of supply for high-quality cultural and art exhibits.

Picture 10: Shanghai Museum - National Gallery of UK Exhibition
Photographed by the author on May 16th at the Shanghai Museum
Based on the analysis above, should China increase the proportion of manufacturing or services over the next ten years?
First of all, it is necessary to adhere to high-level openness and become a manufacturing power. Currently, about 6.41 million Chinese enterprises are engaged in foreign trade, generating more than 20 million job opportunities and creating employment for around 180 million people (primarily within the manufacturing sector). Maintaining a high export growth rate, with further increments in export shares, may present a challenge. Rising labor costs in China have been the primary driver for the relocation of some low-to-mid-tier industries. In addition, a long-term trend of global economic weakening does not bode well for export growth, and American pressures on various fronts further complicated this.
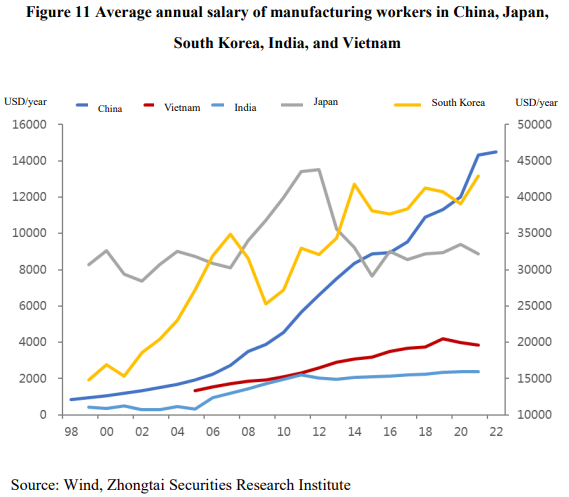
However, China's exports are very resilient, and the long-term increase in its global market share has already demonstrated this point. Two decades ago, processed trade accounted for more than 50% of China's exports, but today, it has dropped to around 20%. Despite this, China's global share of exports continues to rise. This indicates that China's exports will not experience a significant decline in the next decade. In particular, the recent depreciation of the RMB exchange rate is also conducive to reducing the cost of export products.
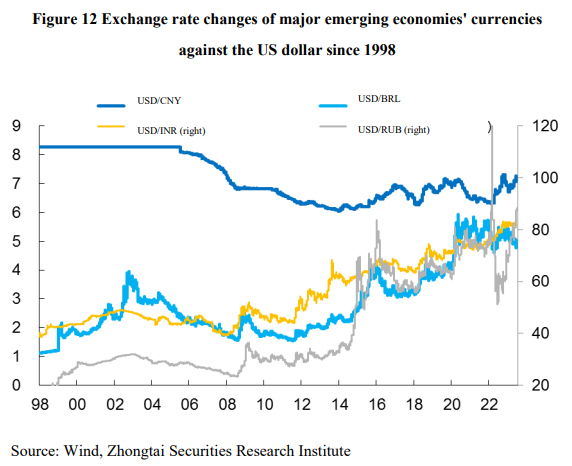
Looking back over the past 30 years, the RMB exchange rate against the US dollar has continued to appreciate, which is probably very rare among developing countries. For example, the currencies of most developing countries have depreciated against the US dollar by more than 90% in the past 30 years. Therefore, as long as China maintains its strong national strength, there is no need to worry about a significant depreciation of the RMB, and a moderate depreciation is actually conducive to exports.
In fact, the goal of becoming a manufacturing power is not contradictory to increasing the proportion of the service industry. The development of the service sector tends to boost demand for manufacturing products, particularly as the scale of productive services grows, thus enhancing the added value of manufacturing products. Moreover, the service sector contributes more significantly to job creation than the manufacturing sector, meaning that each unit increase in service sector value added generates more employment than an equivalent increase in manufacturing.
Comparing the service sector proportions of China, the US, and Japan, it is noticeable that the US is significantly higher than Japan, which is, in turn, markedly higher than China. Even when considering the same per capita GDP level (in nominal US dollar terms), the service sector proportion in China is lower. With a current per capita GDP of $12,720, China’s corresponding service sector proportion is 52.8%. In contrast, when the US and Japan reached similar per capita GDP levels in the 1980s and 1986, their service sector proportions were 63.6% and around 60%, respectively. Today, these proportions stand at 77.6% for the US and 71.8% for Japan, both global manufacturing powerhouses.
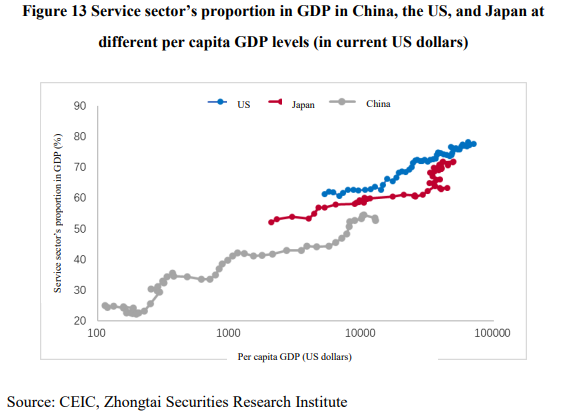
Therefore, increasing the proportion of the service sector will not weaken China's position as a manufacturing power but will further optimize its industrial and economic structure and form a consumption-led economic development model. At the beginning of this year, China proposed prioritizing the recovery and expansion of consumption. In fact, this is based on the fundamentals of the long-term downturn in the real estate cycle and the basic position of "housing is for living, not for speculation", and is conducive to promoting economic transformation and high-quality development.
Of course, in order to increase the proportion of the service sector, it is necessary to expand consumption, particularly in services. First of all, it is necessary to enhance the domestic circulation. Currently, China's domestic final consumption contribution to GDP is significantly lower than the global average, with services consumption accounting for about 52% of total consumption, compared to 70% in the US.
Therefore, the primary aim is to diversify and augment household income, particularly for middle and low-income groups, to counteract contracting demand and weakening expectations. The specific measures involve both increment and stock adjustment: the increment adjustment through increasing fiscal spending for livelihoods and the stock adjustment through income distribution system reform.
Due to the rapid growth of local government debt in China over the past 20 years, and the impact of the pandemic in the past three years, local governments currently face significant financial pressures. Although China's government leverage level is not high compared to international standards, the leverage level of local governments significantly surpasses other major economies, primarily due to the fiscal and administrative imbalance between local and central governments under the tax-sharing system.
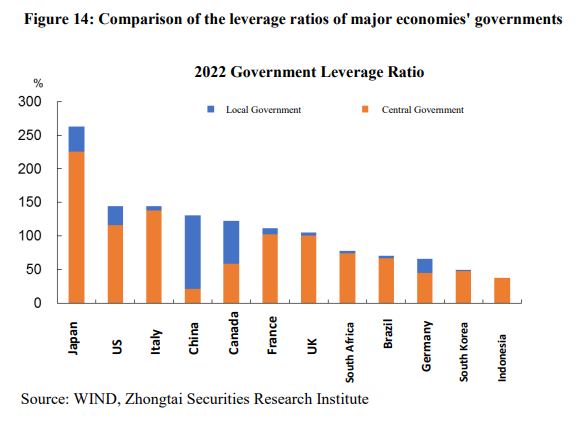
A significant proportion of local government debt is off-balance-sheet, and this debt bears a relatively high borrowing cost. This debt can be swapped through the issuance of low-cost bonds, such as special national bonds issued by the central government to swap local debt, allowing local governments a certain quota for issuing refinancing bonds and leveraging low-interest funds from policy or commercial banks to reduce debt costs. Consideration can also be given to lengthening the debt term, rolling over non-bond debt, as seen with the practice of loan extensions of the Zunyi Road and Bridge Construction Group.
A smooth and vibrant domestic cycle in the new development pattern necessitates further economic structure optimization to ensure all links perform their functions effectively. Government intervention becomes increasingly important, especially against the backdrop of accelerating population aging. For China to achieve modernization, the appropriate benchmark should be the US, also a populous nation, rather than Japan. But in the next decade, China's aging rate will surpass that of the US, reaching 27% by 2050, while the US will only be 18%. This indicates that China will need greater fiscal support from the government in areas such as healthcare and pensions in the future.
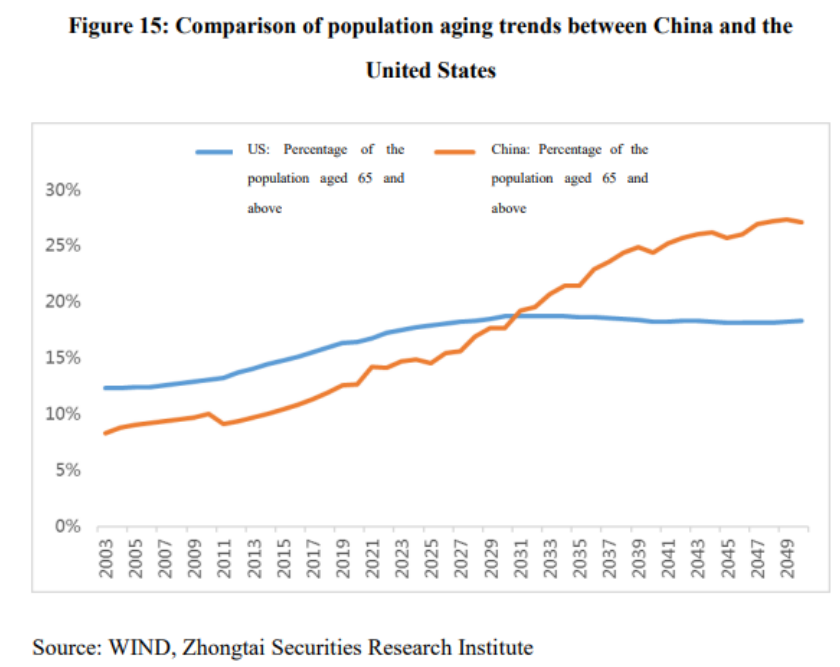
However, China's advantage lies precisely in the resources that the government possesses and its ability to allocate resources. If we change the denominator of each country's government leverage rate from GDP to government assets—which is completely valid from a financial perspective—China's government leverage level will be the lowest among major global economies. Hence, there's little need to worry excessively about the leverage level in the government sector, but it is necessary to reduce the debt cost of local governments.
In summary, in the process of each economy's transition to modernization, there will be issues such as population aging, excess capital, rising labor costs, slowing export growth, and transitioning from investment to consumption. These are all normal transitional processes, and there is no need to be pessimistic or discouraged. As one of the most diligent and disciplined nations in the world, the Chinese should and will not let their average national income stop at the World Bank's definition of upper-middle-income. Of course, the choice of future path is particularly critical against the backdrop of a deteriorating external environment. It is imperative to form a new development pattern under dual circulation, maintain a high level of openness, strongly support the private economy, and persist in economic structural reform.
The current economy is in a recovery phase with numerous structural issues. It is crucial to address potential local or regional risks that could trigger systemic risks early on to nip them in the bud. As the macroeconomy is a large system, the aim should be to prevent a systemic spill-over and strengthen expectation management, for confidence is more valuable than gold.