Abstract: This article analyzes the implications of a sustainable real estate market for China’s fiscal revenue. After recent adjustments, the annual sales of commercial properties have declined to around 13 trillion yuan, which is considered a sustainable level. The article estimates that if real estate sales remain stable at the 2022 level, there will be a decrease in tax revenue by 0.8 trillion yuan per year compared to the pre-adjustment period. Additionally, land transfer income will decrease by 2.8 trillion yuan annually, and government borrowing, including special bonds and debts of urban investment platforms, will decrease by 3.6 trillion yuan annually. In total, this results in a decrease of 7.2 trillion yuan in fiscal revenue and government financing.
After previous adjustments, China's real estate market has seen a decline in annual sales of commercial properties to around 13 trillion yuan, a figure generally considered sustainable. Given the significant role of "land finance" in China, this article attempts to answer the following question: What does it mean for the fiscal revenue and financing of the central and local governments if the country's real estate market enters a state of sustainable development, where real estate sales remain relatively stable?
This article estimates that if real estate sales maintain the same level as in 2022, tax revenue will decrease by 0.8 trillion yuan annually compared to the pre-adjustment period of the real estate market. Land transfer income will decrease by 2.8 trillion yuan annually, and general government financing, including special bonds and debts of urban investment platforms, will decrease by 3.6 trillion yuan annually. The total decrease amounts to 7.2 trillion yuan in fiscal revenue and government financing.
Looking at different regions, the absolute decline in fiscal revenue and financing is larger in eastern and central provinces. Guangdong, Zhejiang, Jiangsu, and Shandong will experience a combined decrease of 700 to 800 billion yuan in local fiscal revenue and government financing. The relative decline in fiscal revenue and financing is higher in central, western, and northeastern provinces. If we put transfer payments aside, some provinces will have to bear a fiscal revenue and financing decline of 30% or more. It should be noted that the calculation of land transfer income mentioned above is gross income rather than net income, and it does not take into account other ways in which local governments expand financing.
The analysis above indicates that in the short term, there is a need to pay close attention to the objective situation that local fiscal revenue and financing may face, highlighting the importance of increasing the coordination of fiscal funds. In the medium and long term, it is more urgent to explore more sustainable and stable sources of local fiscal revenue and financing.
Ⅰ. The importance of real estate to fiscal revenue and government financing
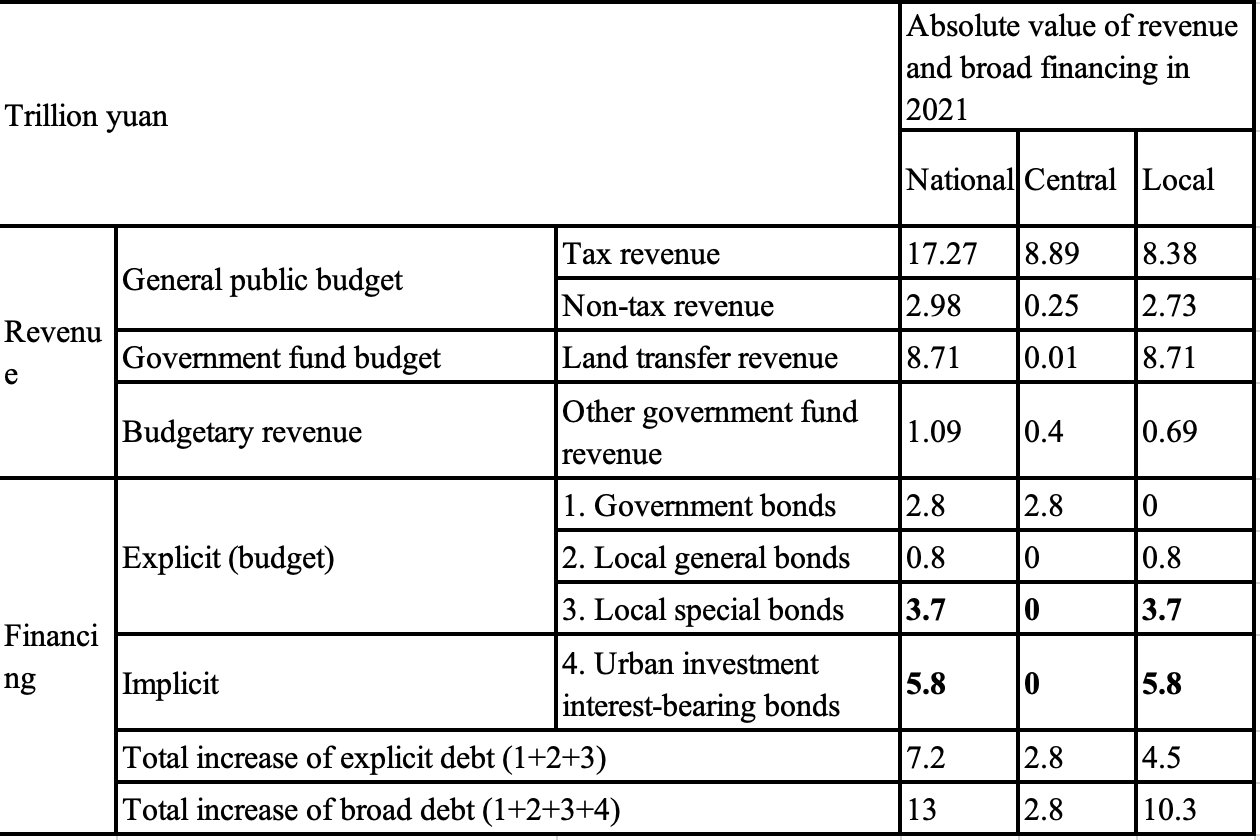
China’s fiscal revenue mainly consists of budgetary revenue, which generally includes the general public budget and government fund budget. The former includes tax and non-tax revenue, while the latter includes land use rights transfer income and more than 20 other government fund revenues. Government financing in China is more complex. Budgetary financing includes national bonds and local general bonds in the general public budget, as well as local special bonds in the government fund budget. Broadly speaking, government financing also considers financing from local urban investment platforms closely associated with the government.
As shown in Table 1, in 2021, China’s total budgetary fiscal revenue in was 30.1 trillion yuan (general public budget + government fund budget), with 9.6 trillion yuan at the central government level and 20.5 trillion yuan at the local level. The central and local shares were 32% and 68%, respectively. In 2021, the new government budgetary financing (explicit debt) was 7.2 trillion yuan, with 2.8 trillion yuan at the central level and 4.5 trillion yuan at the local level. If all the new interest-bearing debt of urban investment platforms is included in the broad government debt, the new broad government financing would be 13 trillion yuan, with 2.8 trillion yuan at the central level and 10.3 trillion yuan at the local level. The central and local shares would be 21% and 79%, respectively.
According to calculations (Table 1), 36.4% of the total budgetary fiscal revenue in the country is related to the real estate sector, including 16.9% from tax revenue and 92.1% from land transfer income. From the perspective of the central and local governments, the central government's dependence on real estate is relatively low, with only 9.3% of central fiscal revenue and 9.9% of central tax revenue coming from real estate. However, for local governments, the importance of real estate is significant. Real estate contributes to nearly 49.1% of local fiscal revenue (excluding transfer payments), including 24.3% from local government taxes and 92.2% from local land transfer income.
Meanwhile, since the issuance of local special bonds and urban investment bonds is highly dependent on land value, such financing is also related to real estate. The total amount of these two parts is 9.4 trillion yuan, accounting for 73% of the total 13 trillion yuan broad government financing and 91% of the 10.3 trillion yuan broad government financing at the local government level.
The importance of real estate in fiscal revenue and government financing is mainly manifested through three channels: specific tax types that contribute to real estate industry tax revenue, high-priced real estate land supporting land transfer income, and leveraging land value to drive government financing.
Table 1: The role of real estate in the main revenue and generalized financing of the Chinese government in 2021
1. Specific tax types have increased the tax revenue of the real estate industry
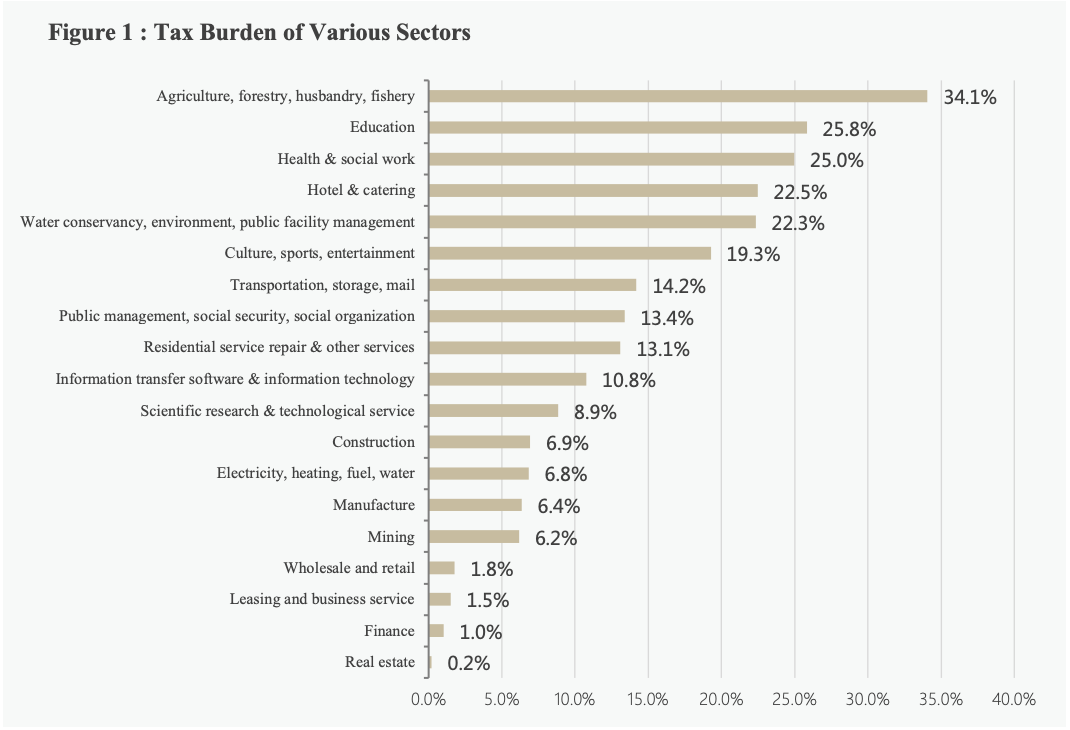
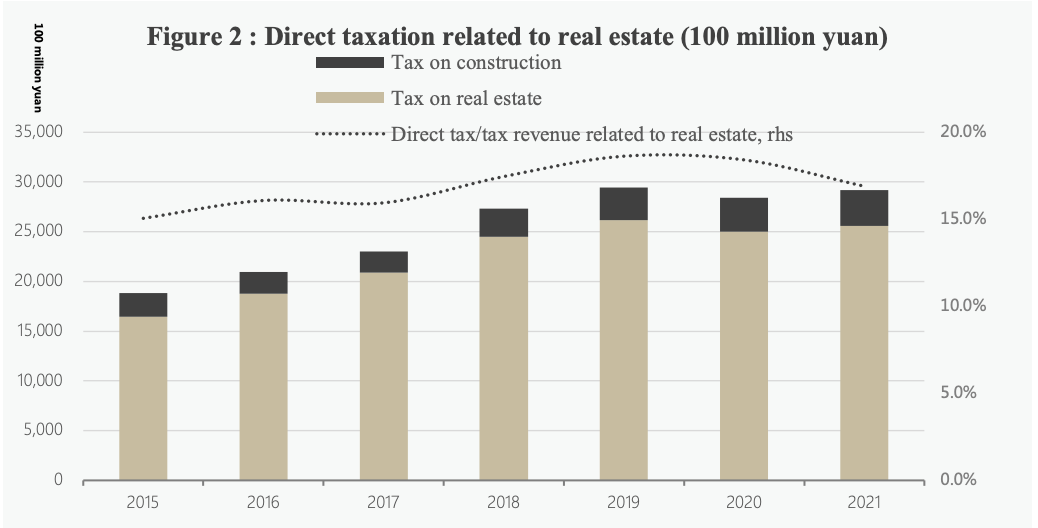
The real estate industry is the greatest tax generator. Its industry tax burden (industry tax revenue/industry value-added) reaches 34.1% (Figure 1), which means that for every 100 yuan of value added in the real estate industry, it generates approximately 34 yuan in tax revenue, which is more than double the average of other industries. According to the latest data published in the China Tax Yearbook, the tax revenue from the real estate industry was 2.55 trillion yuan in 2021. When combined with the tax revenue from the directly related housing construction industry (360.8 billion yuan), the total tax revenue related to real estate reached 2.9 trillion yuan, accounting for 16.9% of the national tax revenue (Figure 2). Based on the estimated distribution ratio of various taxes between the central and local governments, 2 trillion yuan of this tax revenue belongs to local governments, accounting for 24% of their tax revenue.
Sources: China Taxation Yearbook; Wind.
Sources: China Taxation Yearbook; China Ministry of Finance.
The real estate sector's high tax-generating ability primarily stems from land development and transactions, with land value-added tax and deed tax being the main sources of taxation for real estate. On the one hand, for the appreciation value of the same land or property, real estate enterprises are required to pay both the value-added tax commonly levied across industries and the land value-added tax. On the other hand, when real estate enterprises acquire land use rights through land transfer, they are subject to paying deed tax, which is calculated based on the land transfer price. Given that the price of land for real estate development is significantly higher than other types of land, the deed tax paid by real estate enterprises is also higher.
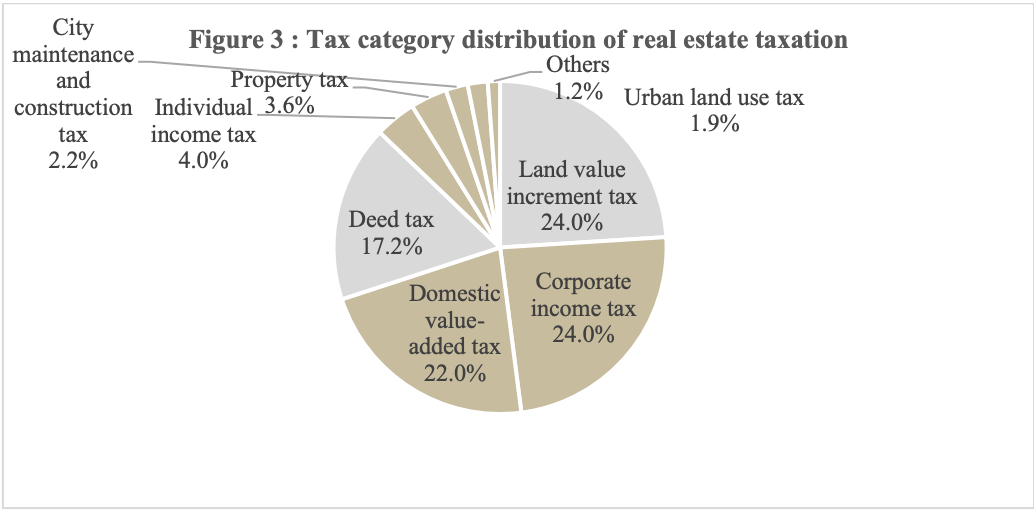
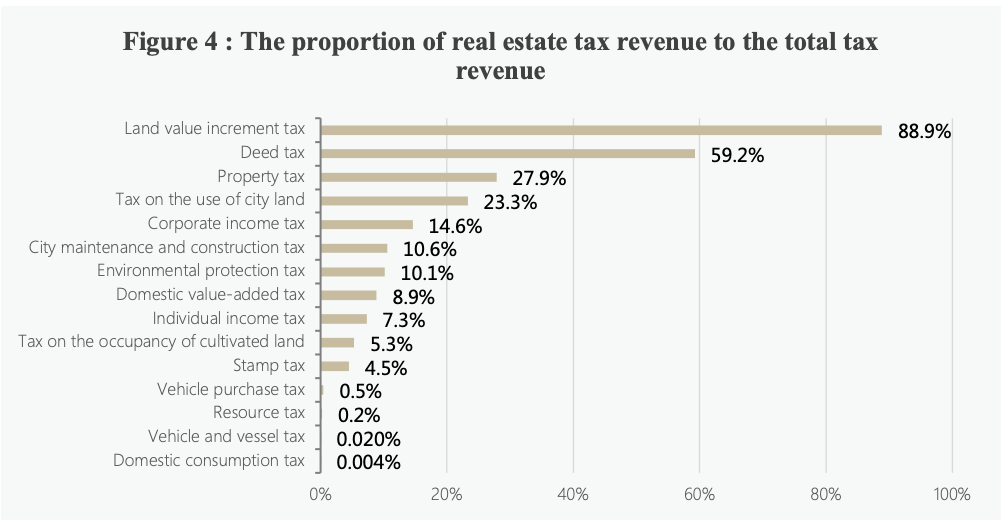
Taking the year 2021 as an example, 41.2% of the taxes paid by the real estate industry came from land value-added tax and deed tax (Figure 3), totaling 10.5 trillion yuan. These two tax categories are almost exclusive to the real estate sector, with nearly 90% of the land value-added tax and 60% of the deed tax derived from real estate development and operations nationwide (Figure 4). Since 100% of the land value-added tax and deed tax goes to local governments, real estate plays a crucial role in generating tax revenue for local authorities.
Sources: China Taxation Yearbook; China Ministry of Finance.
Sources: China Taxation Yearbook; China Ministry of Finance.
2. High–priced real estate land supports land transfer income.
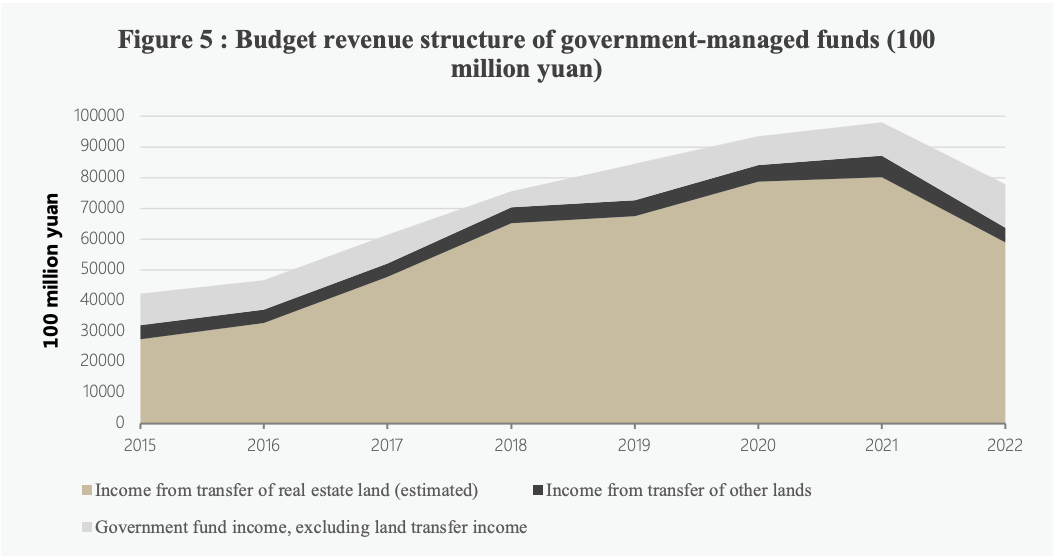
In China, urban land ownership belongs to the state, but the right to use land can be publicly auctioned, tendered, or listed for transfer to society. The resulting land transfer revenue is included in the management of government funds. Land transfer revenue accounts for around 90% of the government fund budget income, with approximately 90% of that revenue coming from real estate land (Figure 5).
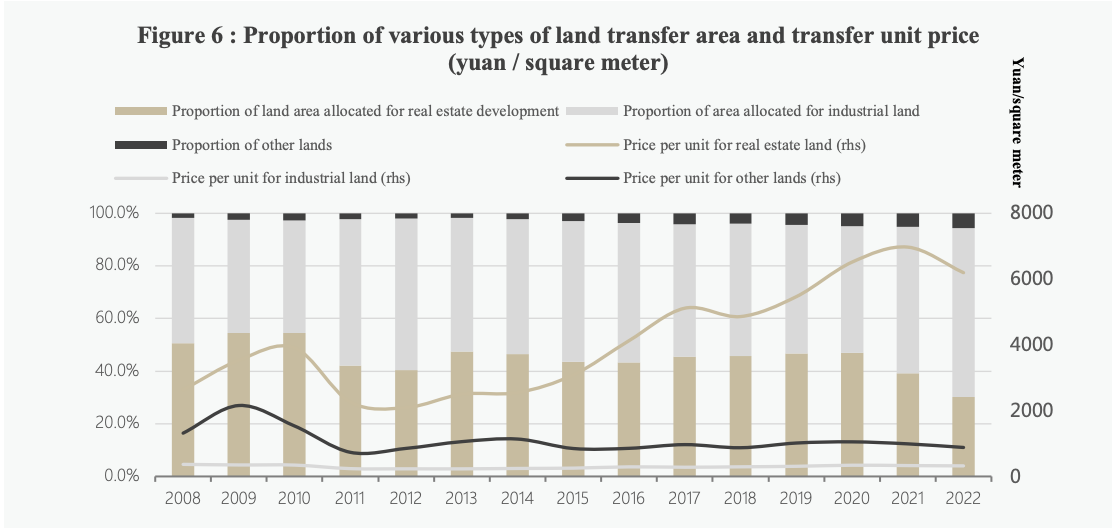
The main reason real estate land can support land transfer revenue is its high unit price. In recent years, the proportion of real estate land in total land transfer area has remained stable or slightly decreased while the unit price has continued to rise. According to publicly available land transfer data recorded by Wind (Figure 6), the proportion of real estate land (residential + commercial) in the total land transfer area decreased from 50.6% in 2008 to 39.2% in 2021 and significantly dropped to 30.3% in 2022. However, the proportion of land transfer payments from real estate land has remained stable at around 90%. This is mainly due to the continuous increase in the transfer price of real estate land, which is significantly higher than the transfer prices of other types of land. In 2008, the transfer price of real estate land was 7.2 times that of industrial land, and by 2022, it had increased to 19.3 times.
Sources: China Ministry of Finance; see appendix for specific calculations.
Source: Wind.
3. The value of land leverages government financing.
The impact of real estate on public finance is not limited to determining budgetary revenue through taxes and land allocation. Another significant influence lies in the fact that over the past two decades, local governments have relied on land revenue and the expected value of existing land as their most important financing foundation, whether through off-budget urban investment platforms or on-budget special bonds.
In 1998, the Wuhu Construction Investment Corporation bundled six infrastructure projects and signed a 10-year, 1.08 billion yuan loan contract with the China Development Bank. The loan was pledged against land transfer revenue, and the Wuhu Municipal Finance Department provided repayment commitments to enhance creditworthiness. This infrastructure financing model, which is based on land value, relies on government credit as explicit or implicit guarantees and does not create explicit government debt, became known as the "Wuhu Model" and served as a prototype for subsequent urban investment platform operations.
Furthermore, since the promulgation of the new Budget Law in 2014, local governments have been granted autonomous borrowing authority, with special bonds used for projects with stable returns. However, reviewing the fundraising materials for various special bonds reveals that the expected land revenue held by project entities is a significant source of repayment for many special bonds.
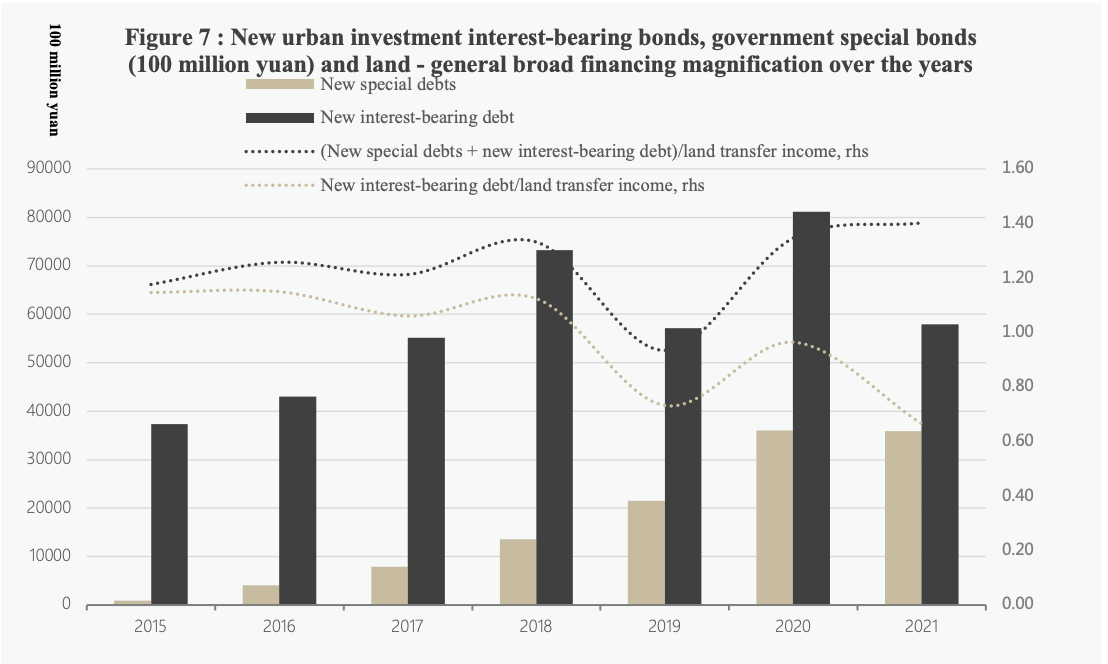
If we define the "land-to-government financing multiplier" as (new special bonds + new interest-bearing urban investment bonds) / land transfer revenue, as shown in Figure 7, except for 2019, this multiplier is generally around 1.3. In other words, at the national level, every 100 yuan of land transfer revenue corresponds to approximately 130 yuan of broad government financing. This also implies that if land transfer revenue decreases, the decline in overall government financing will be greater than the decrease in land transfer revenue.
Therefore, considering overall fiscal revenue and government financing, before 2022, real estate directly generated annual fiscal revenue of approximately 10.9 trillion yuan, accounting for 36.4% of the national fiscal revenue (total general public and government fund budget revenue), including 2.9 trillion yuan in taxes and 8 trillion yuan in real estate land transfer revenue (calculation process detailed in the appendix). It also drove local special bonds and urban investment bonds financing of 9.4 trillion yuan, accounting for 73% of total broad government financing and 91% of local government broad financing.
Sources: China Ministry of Finance; see appendix for specific calculations.
Ⅱ. What are the differences in the importance of real estate for fiscal revenue and government financing in different regions?
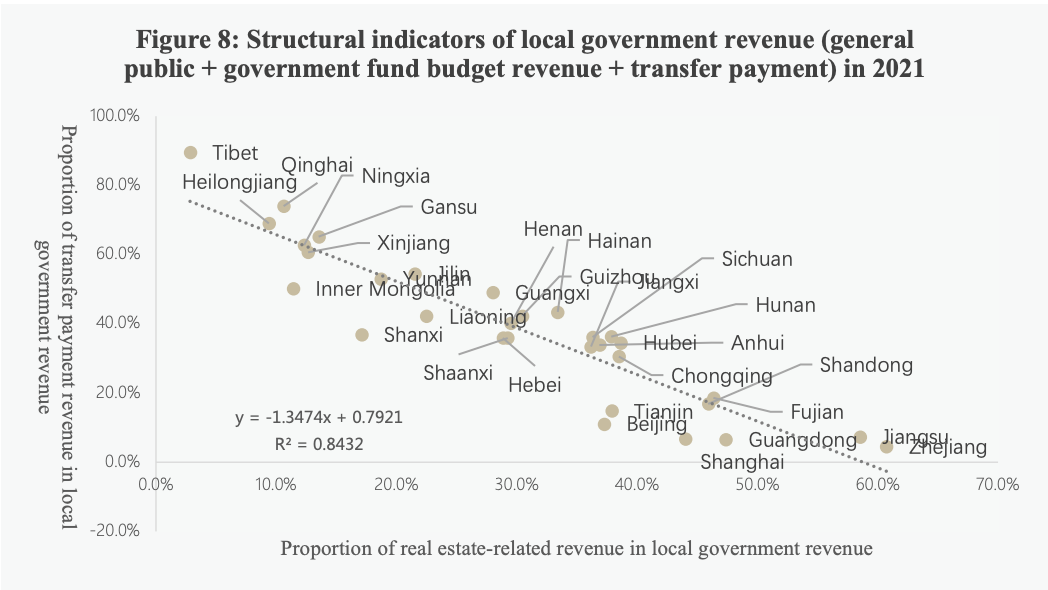
Local government fiscal revenue consists of three parts: general public budget revenue, government fund budget revenue, and central transfer payment revenue. If the proportion of the local government's real estate-related revenue is higher, it means that the reliance on real estate is higher; if the proportion of transfer payment revenue is lower, it means that the local government's "self-sufficiency" ability is stronger.
By observing the situation of each province (Figure 8), we can find that provinces with a higher proportion of real estate-related income have a lower reliance on transfer payments and a higher level of “self-sufficiency” ability in local finance.
Sources: Wind; China Ministry of Finance.
As shown in Table 2-1, in 2021, there are six provinces and cities where the real estate dependence on government revenue exceeds 40%, all of which are relatively developed regions in the east. From high to low, they are Zhejiang (60.7%), Jiangsu (58.5%), and Guangdong, Fujian, Shandong, and Shanghai (44%). At the same time, the dependence on central transfer payments in these six provinces and cities is all less than 20%, and their fiscal "self-sufficiency" ability is strong. On the other hand, the nine provinces (Yunnan, Shanxi, Gansu, Xinjiang, Ningxia, Inner Mongolia, Qinghai, Heilongjiang, and Tibet) whose dependence on real estate is less than 20% are mostly located in the economically underdeveloped areas in the west and northeast, and their dependence on transfer payments is almost all above 50% (except Shanxi), and Tibet, Qinghai, and Heilongjiang's dependence on transfer payments even reaches 89.7%, 74%, and 69%, respectively.
In terms of government financing, the overall land-financing amplification ratio in the western region is higher than that in the eastern and central regions, which means that these regions will bear higher downward pressure on financing when the land value declines. As shown in Table 2-2, from 2019 to 2021, there were 13 provinces and cities whose average land-financing amplification ratio was higher than the national average, of which eight were in the western region, three were located in the central region, and Shandong located in the east and Jilin in the northeast.
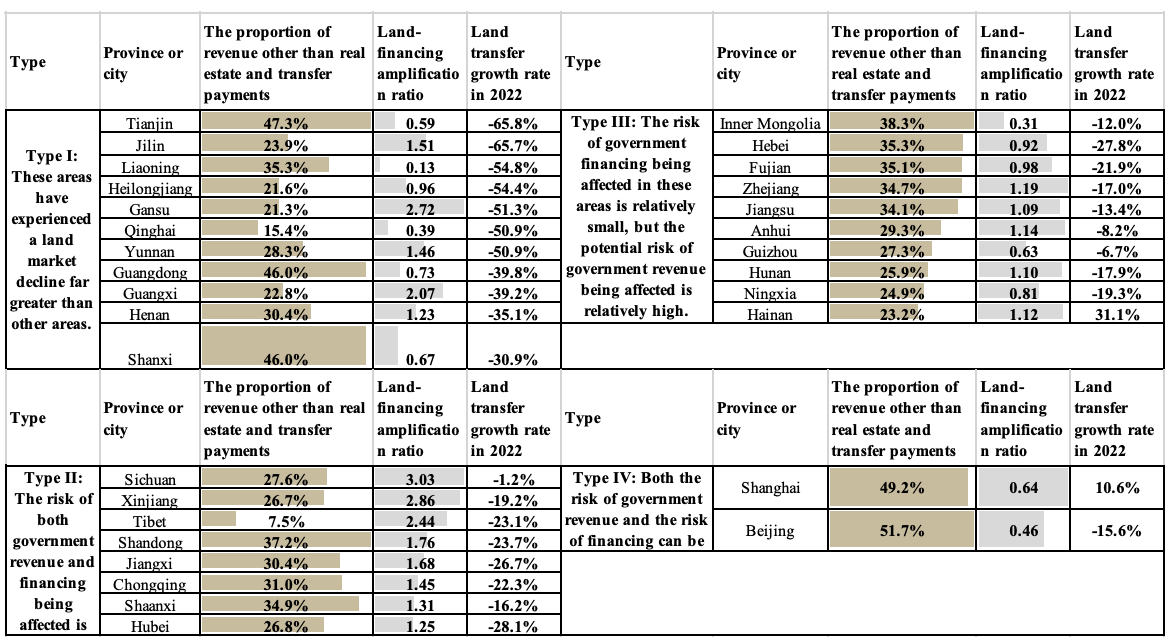
Based on comprehensive income, financing indicators, and the land market performance of each province in 2022, the provinces can be divided into four types (Table 3). Type I: These areas have experienced a land market decline far greater than other areas. There are 11 in total, including Tianjin, Jilin, Liaoning, Heilongjiang, Gansu, Qinghai, and Yunnan, whose land transfer income has dropped by more than 50% in 2022, Guangxi and Guangdong have dropped by nearly 40%, and Henan and Shanxi have dropped by more than 30%. Regardless of the real estate dependence on government revenue and the land-financing amplification ratio in these regions, such a sharp decline in the land market has already brought a great impact on government revenue and financing.
Type II: The risk of both government revenue and financing being affected is high. The land-financing amplification ratio of these regions is relatively high, and their ability to generate other government revenue besides real estate and transfer payments is also limited. They are in total 8, including Sichuan, Xinjiang, Tibet, Shandong, Jiangxi, Chongqing, Shaanxi, and Hubei. In terms of income, the proportion of revenue other than real estate and transfer payments in these areas is basically less than 35%, indicating limited revenue-generating capabilities; in terms of financing, the land-financing amplification ratios are all above 1.2, and they will experience greater financing decline when land revenue decreases.
Type III: The risk of government financing being affected in these areas is relatively small, but the potential risk of government revenue being affected is relatively high. Inner Mongolia, Hebei, Fujian, Zhejiang, Jiangsu, Anhui, Guizhou, Hunan, Ningxia, and Hainan belong to this type. The land-financing amplification ratio of these provinces is relatively low, and the impact on financing in these regions is relatively controllable. However, the proportion of revenue other than real estate and transfer payments is still below 35% in most of them, and changes in the real estate market will still bring about significant revenue loss risks.
Type IV: Both the risk of government revenue and the risk of financing can be controlled in this type, and only Beijing and Shanghai belong to this type. Their land-financing amplification ratio is relatively low, and about 50% of government revenue can be obtained from channels other than real estate and transfer payments. The real estate market is also relatively stable, and the risk of government revenue and financing can be controlled.
Table 2: Real estate dependence and land-financing amplification ratio of local government revenue
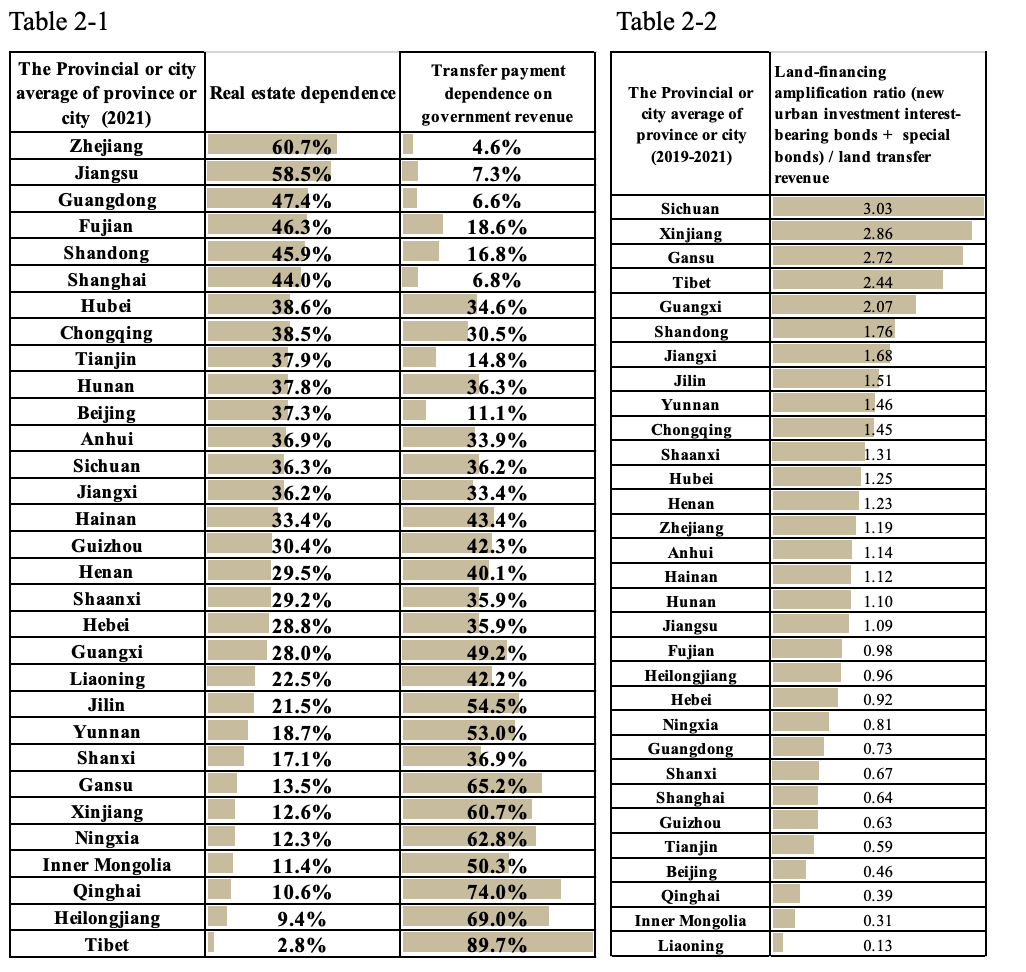
Table 3: Classification of Provinces by Type
Ⅲ. How will the fiscal revenue and government financing change after the sustainable development of the real estate market?
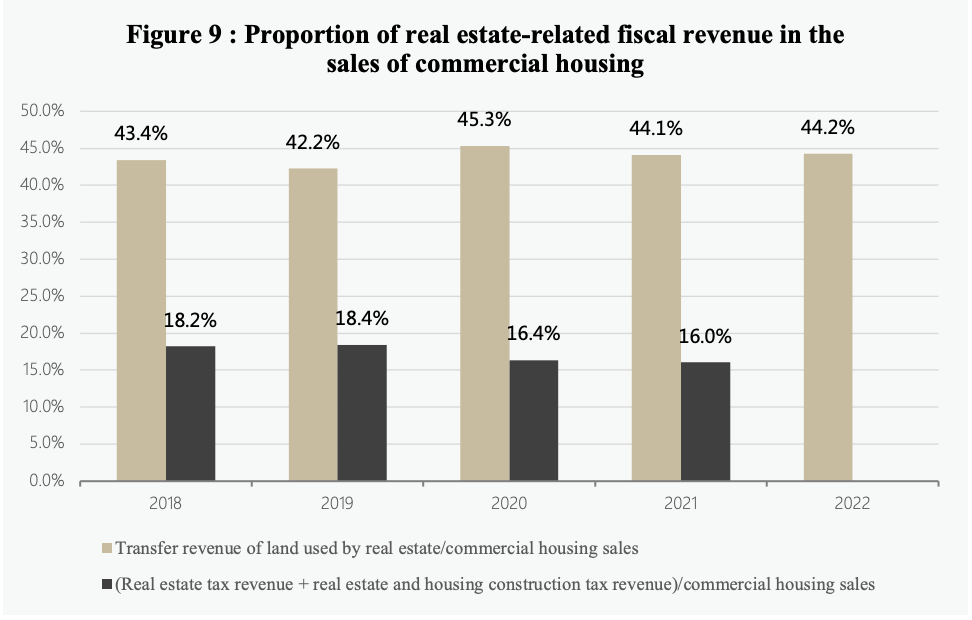
The real estate-related fiscal revenue is closely related to the real estate sales performance, and more than 60% of the annual commercial housing sales funds contribute to fiscal revenue (Figure 9). If the financing costs, construction costs and profit margins of the real estate industry are relatively fixed, then the decline in sales of commercial housing will lead to an equal decline in the government's real estate-related revenue.
Source: Wind.
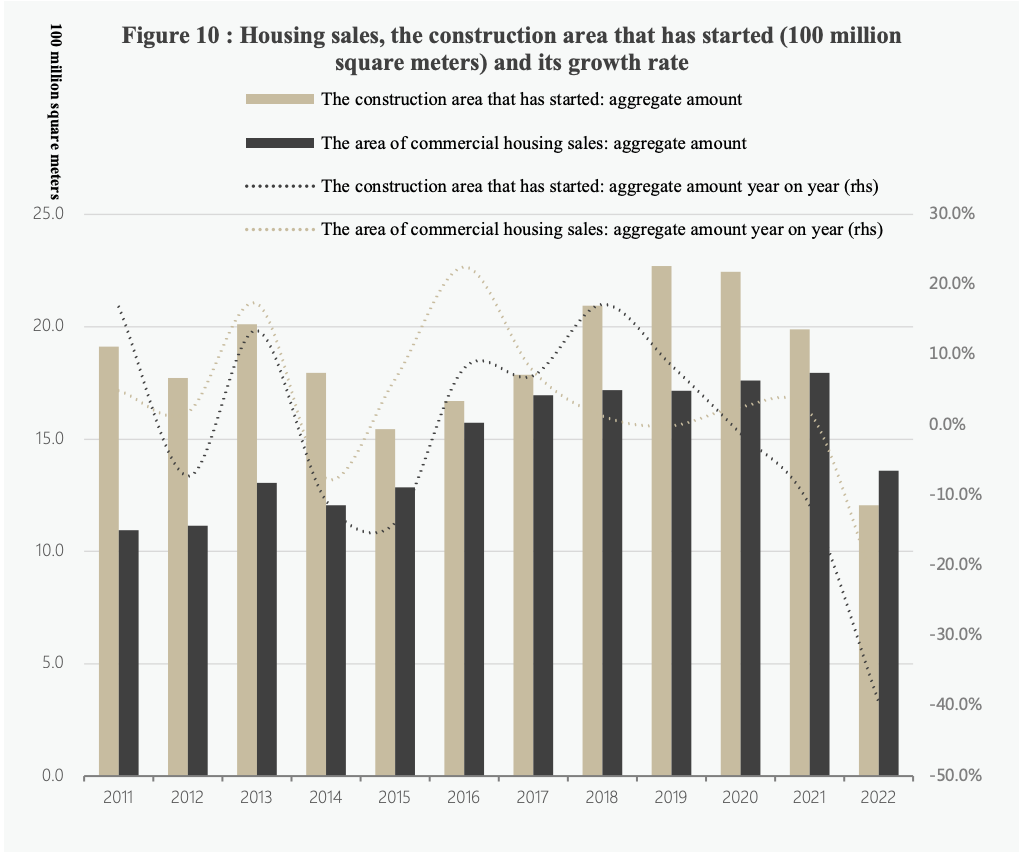
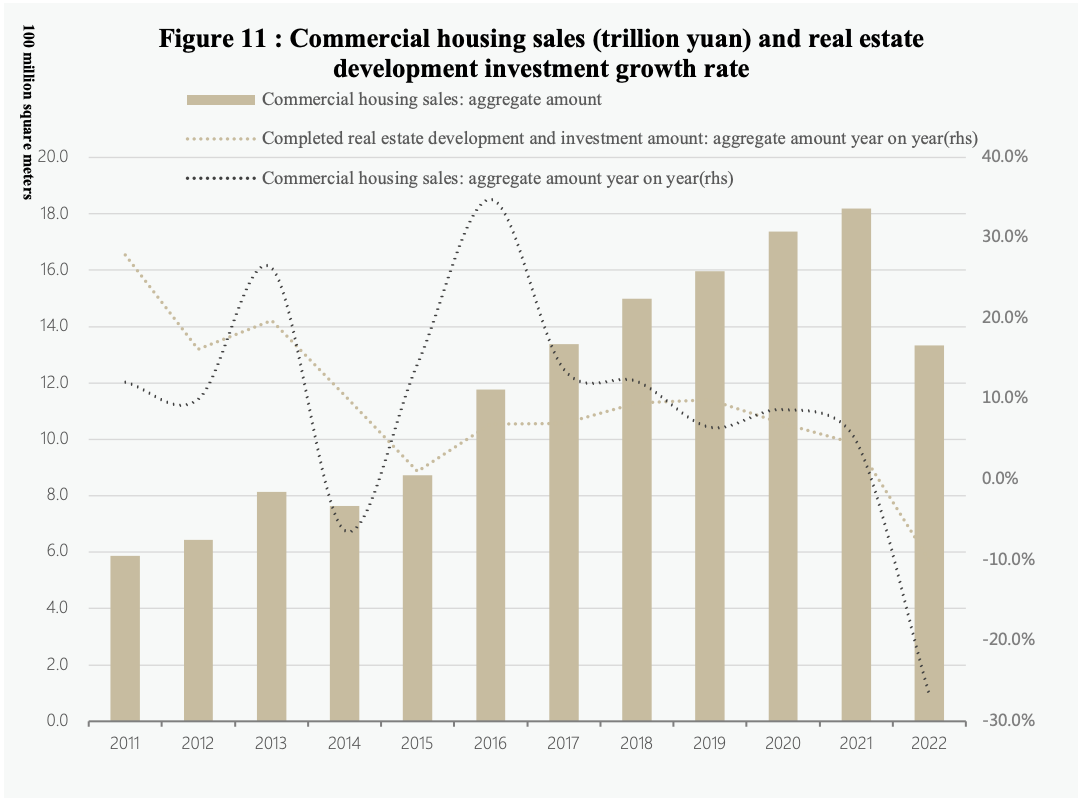
In 2022, the real estate market underwent a sharp adjustment (Figures 10 and 11), and the sales of commercial housing fell to around 13 trillion yuan. This sales scale is generally considered as a more sustainable level. If China's real estate market achieves a sustainable development where real estate sales remain basically stable, what does this mean for the fiscal revenue and financing of the central and local governments?
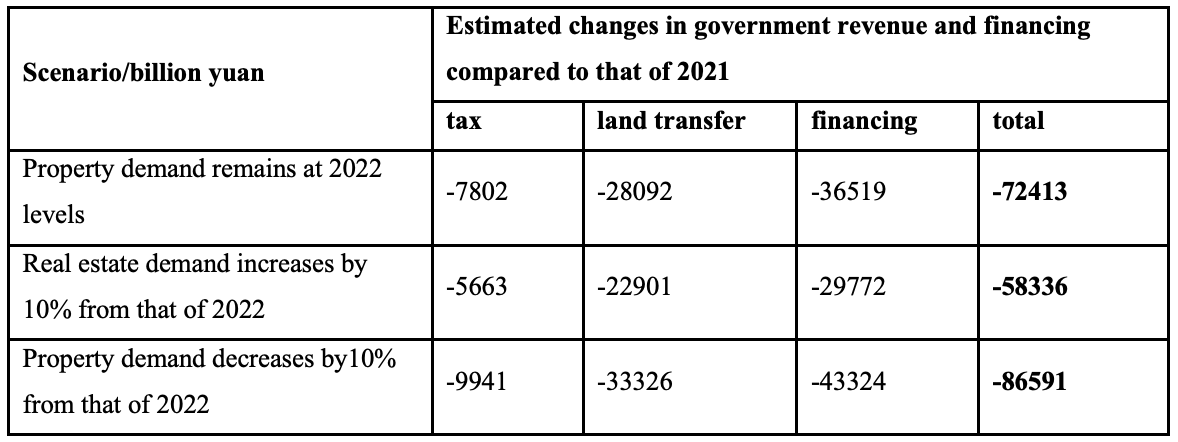
At the national level (Table 4), if real estate sales remain at the level of 2022, tax revenue will decrease by 0.8 trillion yuan per year compared with the level before the real estate market adjustment, and land transfer revenue will decrease by 2.8 trillion yuan per year, and the broad government financing including special bonds and urban investment platform debts will decrease by 3.6 trillion yuan per year. The total decline in fiscal revenue and government financing is 7.2 trillion yuan.
Under the optimistic scenario, if real estate sales increase by 10% compared with that of 2022, income and financing will improve, and the total decline will be reduced to 5.8 trillion yuan: tax revenue will decrease by 0.56 trillion yuan, land transfer revenue will decrease by 2.3 trillion yuan and broad government financing will decrease by 3 trillion yuan. Under the pessimistic scenario, if real estate sales continue to decline by 10% compared with that of 2022, the total decline in government revenue and financing will expand to 8.7 trillion yuan compared with that of 2021: tax revenue will drop by nearly 1 trillion yuan, and land transfer revenue will drop by 3.3 trillion yuan, and broad government financing will decrease by 4.3 trillion yuan.
Source: Wind.
Source: Wind.
Table 4: Changes in government revenue and financing under different real estate demand scenarios
In terms of regions (Table 5), if real estate sales in each province remain at the level of 2022, the eastern and central provinces will experience a greater decline in fiscal revenue and government financing. In terms of income, the 9 provinces with a reduction of more than 100 billion are all in the eastern and central regions, Guangdong has reduced by 470 billion, and Jiangsu and Zhejiang have both reduced by about 350 billion. In terms of financing, due to the higher land-financing amplification ratio, Shandong has the largest decline in general government financing, about 370 billion yuan, followed by Zhejiang, Jiangsu, and Guangdong, all exceeding 250 billion yuan. In total, the revenue and financing of Guangdong, Zhejiang, Jiangsu, and Shandong will all drop by 700-800 billion yuan. However, in terms of relative reductions, Tianjin and some provinces in central, western, and northeastern regions suffered the most. Regardless of transfer payments, the total decline in income financing in these provinces will be more than 25%.
Table 5: Estimated Changes in Government Revenue and Broad Financing Caused by Real Estate Market Changes in 2022
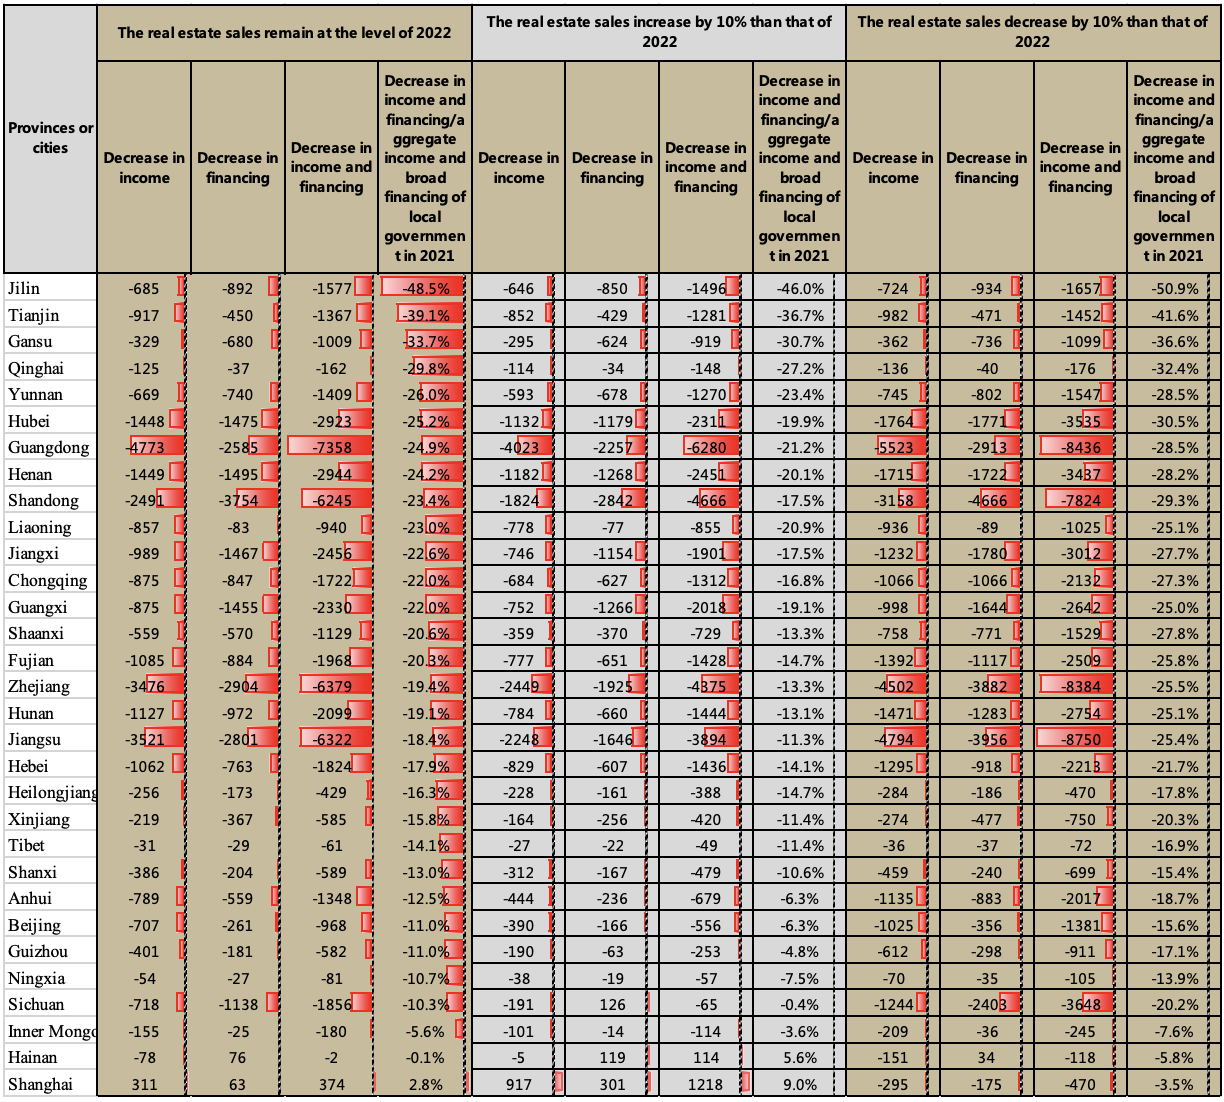
The above data are all estimated based on data from previous years. However, the negative impact of the decline in real estate-related income and financing can be relatively controllable if the following two factors are considered. First, the land transfer income calculated in this article is gross income rather than net income. When the land transfer income decreases, the government will also reduce cost expenditures such as demolition compensation correspondingly. Second, incremental financing support, such as policy-based financial instruments, can fill the financing gap of urban investment platforms after changes in the land market. In 2022, policy banks will invest 740 billion yuan in policy development financial instruments to stabilize growth, which can be used as project capital and act as strong financing leverage, effectively supporting the financing needs of infrastructure construction.
Nevertheless, the analysis of this paper also shows that: firstly, it is necessary to pay close attention to the objective situation that local fiscal revenue and financing may face after the real estate market enters into a new stable state. The importance of increasing financial coordination in the short term is even more prominent. Fiscal policy should coordinate macroeconomic regulation needs and prevent fiscal risks, optimize the combination of taxation, non-tax revenue, government debt, interest subsidies, and other tools to provide financial support for implementing major national strategic tasks and guaranteeing basic public services. In addition, in the past, government revenue and financing structure may have relied too much on the single industry of real estate, and the urgency to explore more sustainable and stable sources of local fiscal revenue and financing in the medium and long term has become more prominent.
Appendix: Explanation of the Calculation of Real Estate Land Transfer Data
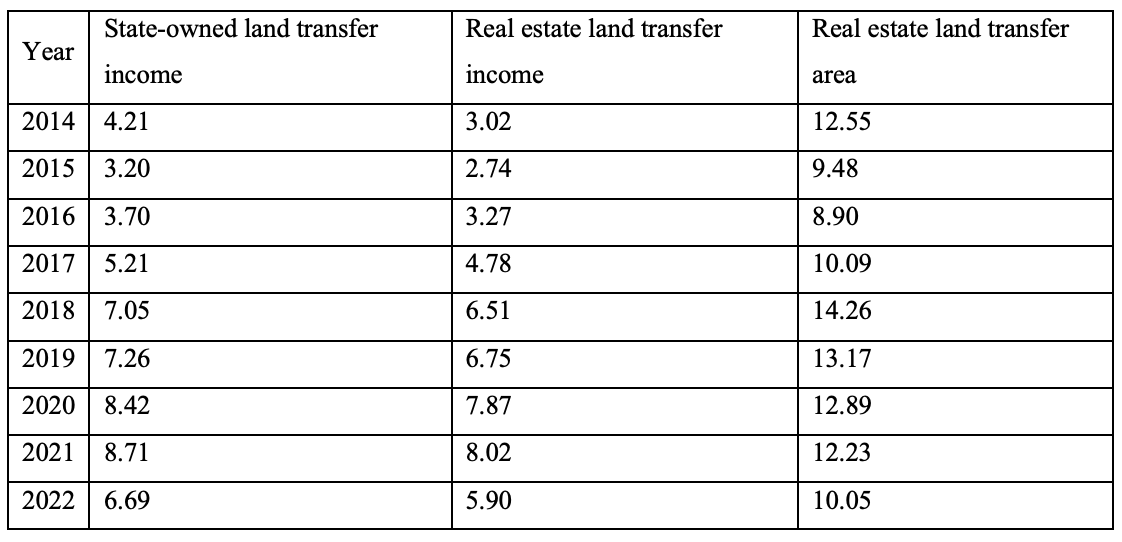
The land transfer income in the fiscal data does not distinguish the income structure of land transfer for each type of land, so the land transfer income of real estate land cannot be obtained directly. Based on the "China Land and Resources Statistical Yearbook" and land transfer detailed data collected by the Wind database, we estimated the land transfer income, area, and unit price of real estate (see Attached Table 1)
Among them: 2014-2021 state-owned land transfer income data are all from the annual fiscal accounts of the past years, state-owned land-use rights transfer income = state-owned land-use rights transfer fee income + state-owned land fund income + agricultural land development fund income. The state-owned land transfer income in 2022 only calculated the aggregated data of the local government. Since the land transfer of the central government is less than 10 billion, it is ignored in the calculation. The relevant data on real estate land transfer in 2014-2017 are from the "China Land and Resources Statistical Yearbook"; the relevant data on real estate land transfer in 2018-2022 are estimated results.
Attached Table 1: Estimation of state-owned land transfer income and real estate land transfer data from 2014-2021 (Trillion yuan, 100 million square meters)
