
Abstract: The paper attempts to explain the weak willingness of the private sector to increase leverage from the perspective of the private sector's return on assets and cost of liabilities. The private sector was divided into the private business sector and the household sector, and the changes in the returns on assets, the cost of liabilities, and the spread between the two in both sectors were examined. The paper suggests that if the interest spread of the private sector can be improved by lowering the benchmark interest rate, it will not only help enhance the private sector’s balance sheet but also incentivize the private sector to increase leverage.
The paper attempted to explain the weak willingness of the private sector to increase leverage from the perspective of the private sector's return on assets and cost of liabilities. The private sector was divided into the private business sector and the household sector and the changes in the return on assets, the cost of liabilities, and the spread between the two in each of these sectors were examined.
The study had three basic findings: (1) The return on assets of the private sector in China has been trending downward over the past decade, and the magnitude of the decline after the pandemic has significantly deviated from the pre-pandemic trend. (2) The cost of liabilities in China's private sector has also trended downward over the past decade, but the magnitude of the decline in the cost of liabilities is smaller than that in the return on assets. (3) The difference between the return on assets and the cost of liabilities in the private sector after the pandemic is only one-third of that before the pandemic, while the household sector faces the dilemma of a significant inversion of the return on assets and the cost of liabilities. Nevertheless, historical data suggest a strong link between the leveraging behavior of the private sector and interest spread.
These findings can provide several policy insights. First, if the interest spread of the private sector can be improved by lowering the benchmark interest rate, it will not only help enhance the private sector’s balance sheet but also incentivize the private sector to increase leverage. Second, attention should be paid to the reasons that led to the downward trend in the return on assets of the business sector. Third, the average interest rate should respond to the decline in the return on assets in a timely manner. Fourth, the public sector may still have to play an important role in stabilizing growth at this stage, but more attention should be paid to the financial strain of local governments, the efficiency of the use of public funds, and its impact on the efficiency of resource allocation in the medium and long term.
I. CREDIT EXPANSION OF THE PRIVATE SECTOR IS THE KEY TO CHINA’S ECONOMIC RECOVERY.
Since 2022, the willingness of China’s private sector to increase leverage has weakened significantly. First, newly added loans in the household sector have decreased rapidly since the second half of 2022. In 2022, the scale of new household loans reached 3.83 trillion yuan, down by 4 trillion yuan, or more than 50%, from 2020 and 2021. Second, the household sector's willingness to save has increased significantly, and households’ interest in allocating risky assets such as stocks and real estate has fallen sharply. In 2022, the scale of new household deposits has increased significantly, up by 8 trillion yuan from the same period in 2021, while the floor area of new commercial housing sales has fallen by 24% year-on-year, and the net inflow of the residential sector to the stock market was negative. Third, private investment was sluggish, with investment mainly driven by infrastructure investment led by the public sector and local government financing vehicles. In 2022, the growth rate of private fixed investment in China was only 0.9%, far lower than that of social fixed asset investment (5.1%) and infrastructure investment (9.4%). Although the new medium- and long-term loans to enterprises increased sharply, in reality, a significant portion of the loans eventually flowed to local government financing vehicles. Despite the good performance of manufacturing investment, less than 10% of the loans were from manufacturing investment.
Since the beginning of 2023, China’s economy has started to recover after reopening, but the foundation of recovery is not solid, with many sectors still facing great challenges. On the one hand, China's export growth is facing greater downward pressure as external demand continues to weaken due to interest rate hikes by foreign central banks. From January to February 2023, China's dollar-denominated exports grew at -6.8% year-on-year, continuing the pattern of negative growth since the fourth quarter of 2022. According to our estimate (Yang Yuemin and Zhu He, 2022), the growth rate of China's exports would be about -5.6% in 2022. On the other hand, under the influence of declining land sale revenue and unabated tax and fee cut policy, China's local governments are under greater pressure to make ends meet, and it is increasingly difficult for them to rely solely on the public sector to maintain economic growth.
Under this circumstance, the private sector needs to play an active role in stabilizing growth. The key to stable growth is to stabilize credit. We can ensure robust and sustainable economic recovery only with stronger and sustainable credit growth..
II. THE INTEREST SPREAD OF THE PRIVATE SECTOR IS NARROWING SHARPLY, INDICATING A WEAKER WILLINGNESS OF THE PRIAVET SECTOR TO ADD LEVERAGE
There are several explanations for the lack of willingness of the private sector to increase leverage, including the business environment, changing long-term expectations due to pandemic-induced shocks, a damaged balance sheet of the private sector, etc. The paper seeks to explain the phenomenon from the perspective of the private sector’s rate of return on assets and cost of liabilities. This is a typical micro perspective, and the underlying logic is that only when the rate of return on assets is greater than the cost of liabilities plus risk compensation will the private sector (whether private enterprises or households) has an economic rationale for increasing leverage. If the spread between the return on assets and the cost of liabilities narrows sharply, the private sector will not be able to obtain sufficient risk compensation for leveraging, and both the room and incentive to add leverage will be undermined. In other words, the spread between the return on assets and the cost of liabilities can be observed to determine the incentive and actual space for the private sector to add leverage.
Next, we divided the private sector into the private business sector and the household sector and examined the changes in the return on assets, the cost of liabilities, and the spread between the two in each of these sectors.
1. The Private Business Sector
We first explored the performance of return on assets of Chinese private companies based on a sample of private listed companies. This paper defines private companies as companies controlled by private capital. The specific screening criteria were: among the sample of domestic listed companies, we excluded listed companies whose actual controllers include the State-owned Assets Supervision and Administration Commission, local State-owned Assets Supervision and Administration Commissions, central state organs, local governments, local state-owned enterprises and listed companies of collective enterprises. At the same time, we also excluded financial and real estate listed companies . A total of 26,319 sample points were obtained from 2012 to 2021. We calculated the annual average return on assets (ROA) and return on capital (ROE) for the sample listed companies from 2012 to 2021. To eliminate the effect of extreme values, a 5% trimmed mean was applied to the relevant indicators before calculating the mean values
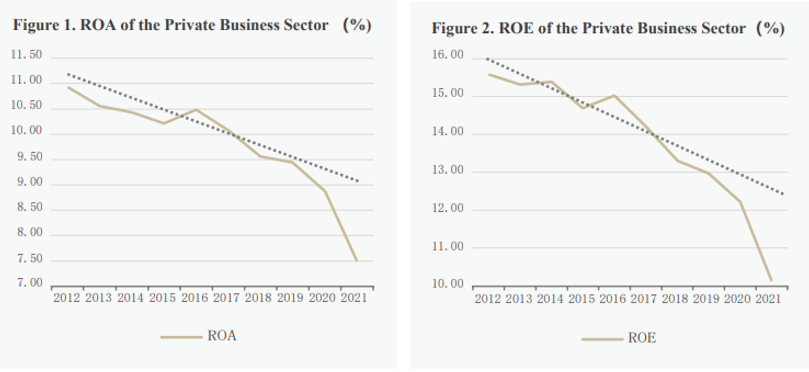
As shown in Figures 1 and 2, both the ROA and ROE of the private business sector have been witnessing a sustained downward trend since 2012, with significantly larger declines between 2020 and 2021. From 2012 to 2021, the ROA of the private business sector fell by a cumulative 3.4% and ROE by a cumulative 5.5%. After the pandemic, however, the decline in ROA of the private business sector deviated significantly from the pre-pandemic level. From 2020 to 2021, the ROA of the private business sector dropped by 2% and ROE by 2.9%. In other words, more than half of the decline in the ROA of the private business sector over the past decade occurred during the two years following the outbreak of the pandemic.
Sources: Wind; Authors’ calculations
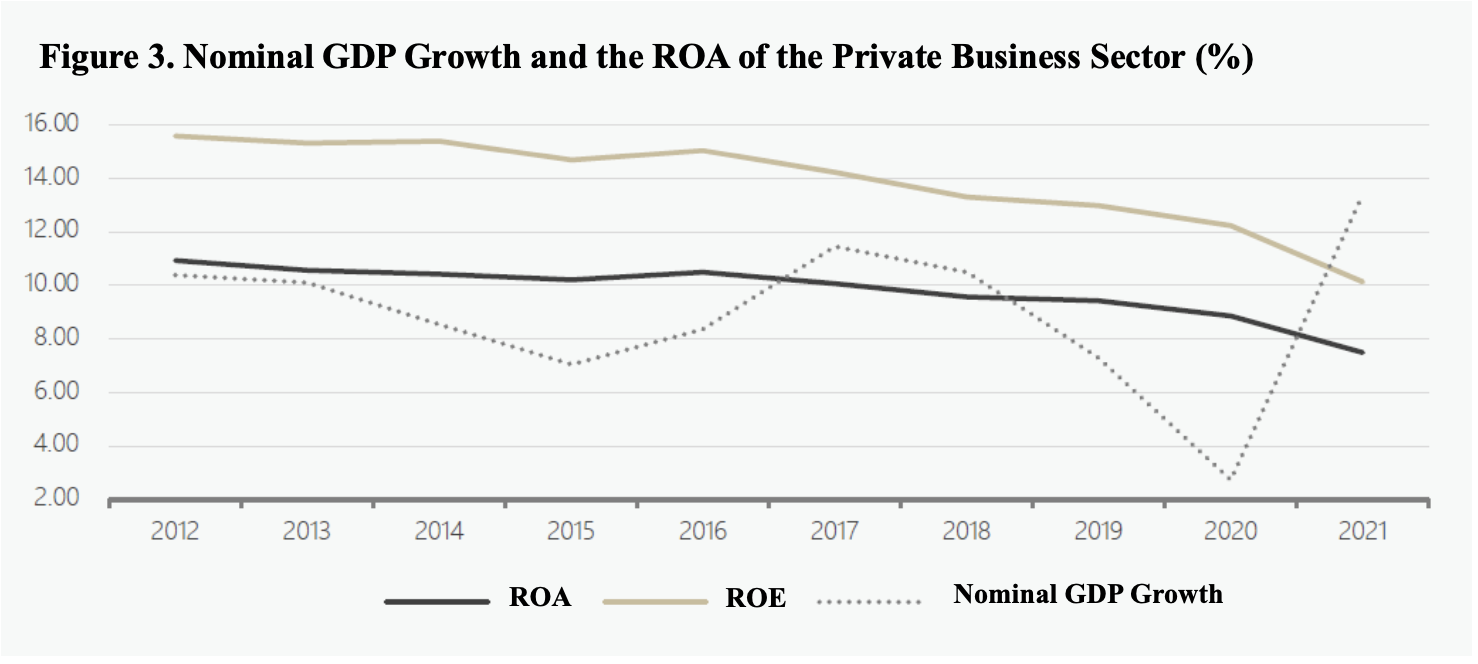
We also found that neither the persistent downward trend in the ROA of the private business sector prior to the pandemic nor the more substantial decline after the pandemic could be explained by changes in nominal GDP growth. As shown in Figure 3, despite the downward trend in the long term, nominal GDP growth demonstrated an obvious cyclical feature. In contrast, over the past decade, the ROA of the private business sector trended downward and has not improved significantly when nominal GDP growth turned upward.
Sources: Wind; Authors’ calculations
In addition to changes in the long-term trend of the private business sector’s ROA, we paid particular attention to 2022. However, a large number of listed companies have not yet disclosed their financial data for 2022. Therefore, we tried to extrapolate the changes in the ROA of listed private industrial companies in 2022 from the financial data of private industrial companies and then extrapolate the changes in the ROA of non-industrial companies based on the performance of industrial and non-industrial companies among private listed companies after the pandemic. Finally, the changes in the ROA of private enterprises in 2022 were obtained by taking into account the relative share of the two types of enterprises. The specific calculation method is shown in the Appendix.
We then examined changes in the cost of liabilities of the private business sector. The cost of liabilities was measured as "(interest expense + fees)/ interest-bearing liabilities." As shown in Figure 4, the cost of liabilities for the private business sector showed a fluctuating downward trend from 2012 to 2021. Here, it is also necessary to reckon the cost of liabilities for private listed companies in 2022. The detailed calculation process is shown in the Appendix.

Sources: Wind; Authors’ calculations
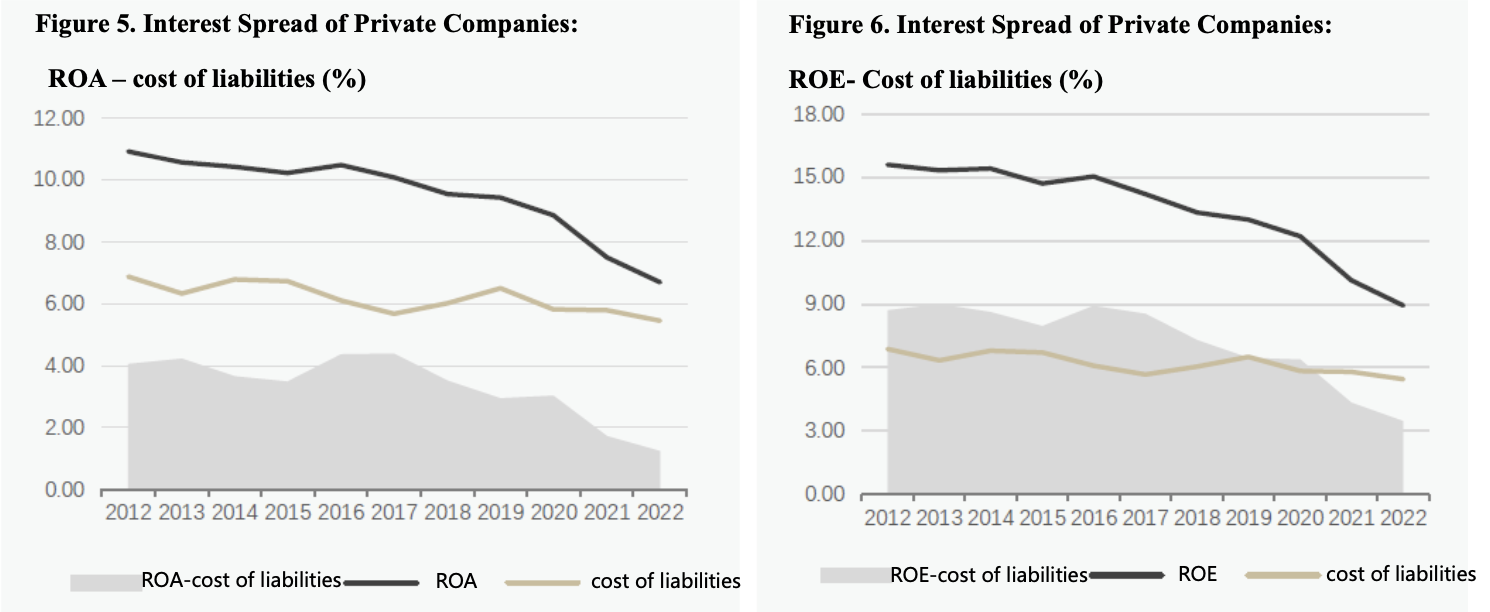
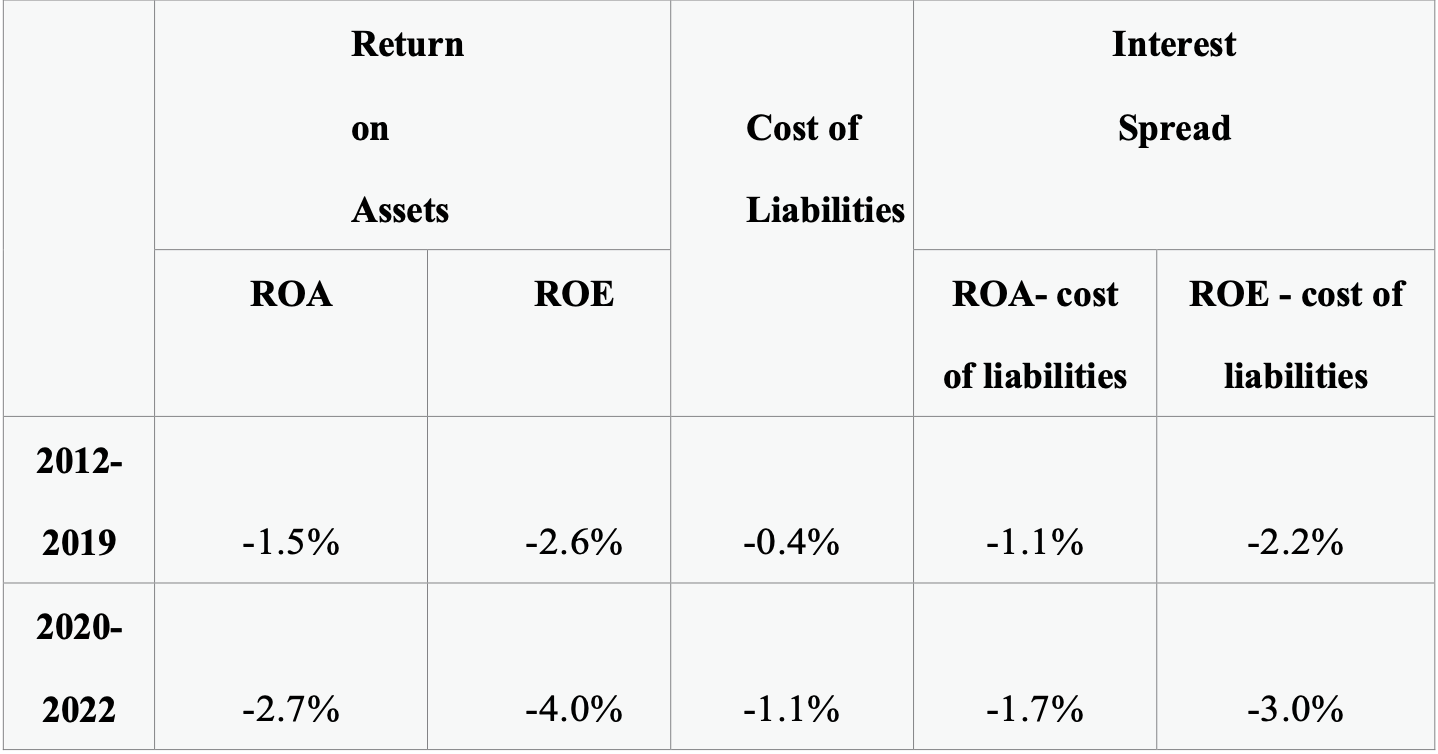
However, Figures 5 and 6 show that the decline in the private business sector's cost of liabilities has been significantly smaller relative to the decline in its ROA. The result is that the interest spread of the private business sector’s balance sheet has narrowed since 2012. In particular, after the pandemic, the ROA of the private sector has fallen significantly, but the decline in the cost of liabilities has been far from offsetting that in ROA, thereby reducing the interest spread. As shown in Table 1, the decrease in the interest spread of the private business sector from 2020 to 2022 exceeds the cumulative decline in the eight years prior to the pandemic(2012-2019). As of 2022, the difference between ROA and cost of liabilities for private companies was only 1.2%, and the difference between ROE and cost of liabilities was only 3.5%.
Sources: Wind; Author’s calculations
Table 1. Changes of ROA and cost of liabilities of the private business sector at different stages
Sources: Wind; Author’s calculations
2. The Household Sector
Next, we examined changes in the balance sheet of the household sector and its benefit-cost dynamics. Household assets were divided into two categories: financial assets and real estate assets. Financial assets include demand deposits, time deposits, wealth management products, money funds, non-money funds, and stocks .
In particular, the data source for funds and stocks is the quarterly disclosed size of fund products and stocks minus the portion held by institutional investors. In calculating the size of real estate assets, we only took into account urban residential housing and referred to the estimated results of Li Yang (2018) . Using 2010 as the base period, we adjusted the price of existing properties based on quarterly house price changes and then added the sales of new commercial properties in the current quarter to obtain the final time series. Although the asset and liability data for the household sector is more accessible than that of the business sector, the time series for some indicators are relatively shorter. Therefore, the time series of ROA data for the household sector includes quarterly data from 2014 to the present.
As shown in Figures 7 and 8, financial and real estate assets of the household sector have been increasing almost in parallel since 2014. According to our estimate, the scale of financial assets held by households by the end of 2022 reached 198.7 trillion RMB, and the scale of real estate assets held by the household sector was 264.9 trillion RMB. Among financial assets, time deposits accounted for the largest share, followed by demand deposits and stocks, which shared similar long-term scales.
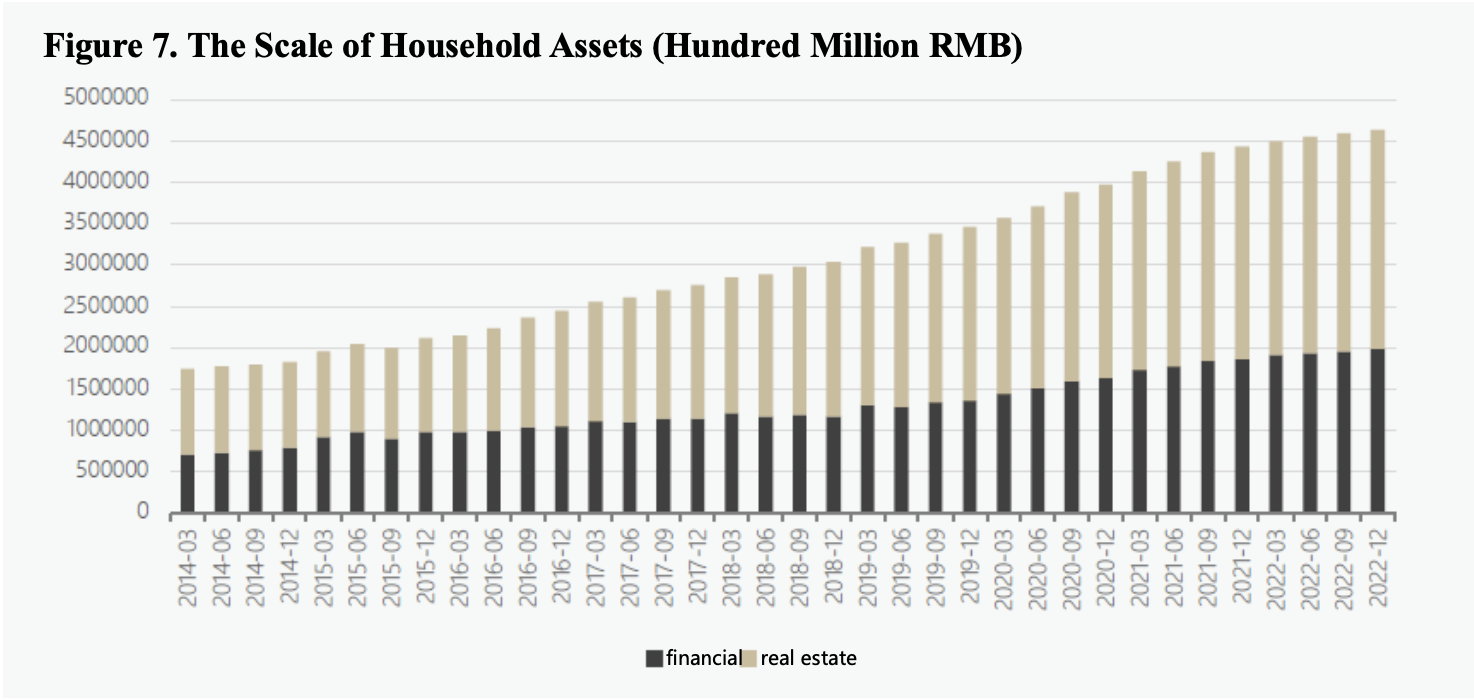
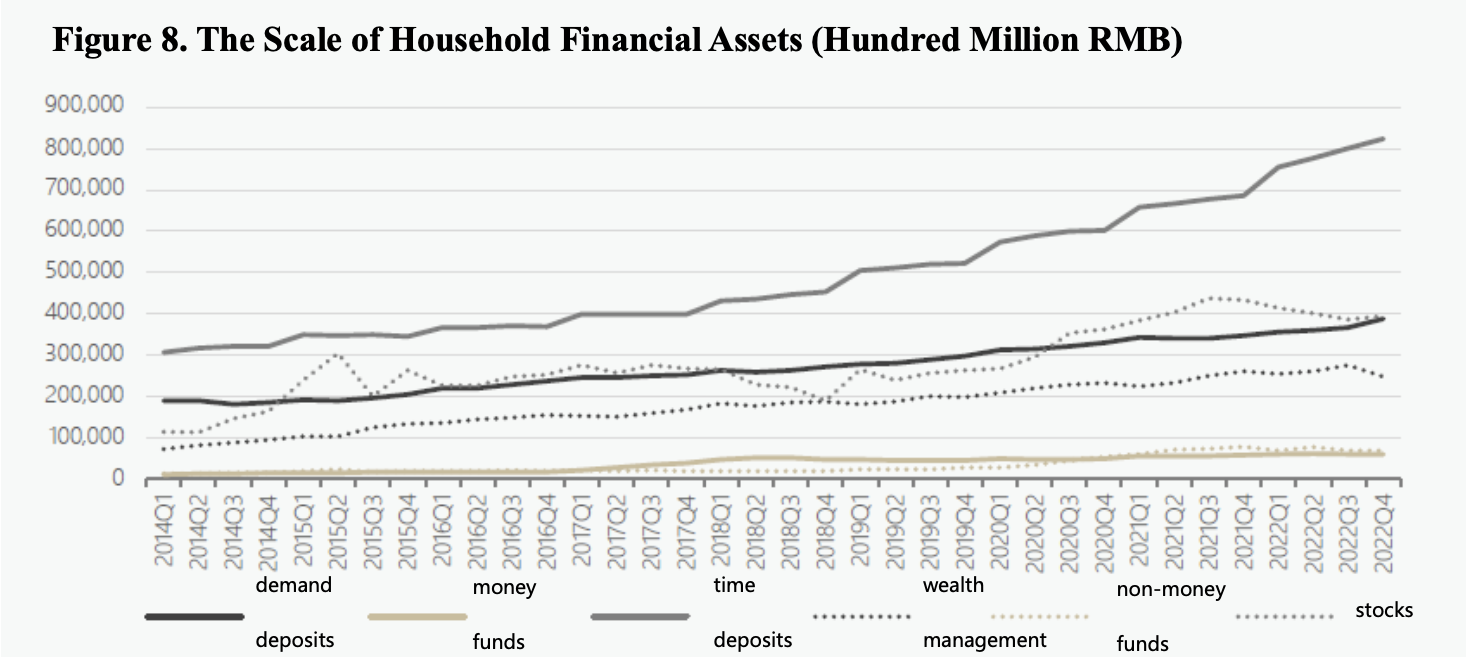
Sources: Wind; Authors’ calculations
The ROA of the household sector was obtained by weighting the ROA on each asset class according to the proportion of each asset size. The return on demand deposit is the quarterly average of the benchmark demand deposit rate. The return on wealth management products is the quarterly average of the expected yield on 1-year products in the market. The return on time deposits is the quarterly average of the benchmark 1-year time deposit rate and the quarterly average of the above-mentioned wealth management yield . The return on money funds is the quarterly average of R007. Non-money funds (mainly equity and hybrid securities) and stock yields are based on the year-on-year increase of the Shanghai Stock Exchange index on the last day of the quarter. Real estate yields are the year-on-year annualized rate of real estate prices for the quarter .
Compared to the business sector, the ROA of the household sector is more volatile, but the two sectors share more similarities in their long-term trend of ROA changes. As shown in Figure 9, since 2014, the average ROA of the household sector has also been declining and turned negative in the first quarter of 2022 for the first time.
Specifically, the changes in the ROA of the household sector can be divided into three phases. The first phase is 2014-2017, which shows the greatest volatility with an average return of 6.2%. The second phase is 2018-2019, during which volatility decreases, with an average return of 4.5%, down by 1.7 percentage points from the previous phase. The third phase is 2020-present, with an average return of 2.3%, down by 2.2 percentage points from the previous phase. In particular, after the third quarter of 2021, the ROA of the household sector experienced a rapid drop and turned negative for the first time, standing at -1.8% in the fourth quarter of 2022. Whether in terms of trend and magnitude of decline, the ROA of the household sector after the pandemic has significantly deviated from the pre-pandemic state, especially since 2022.
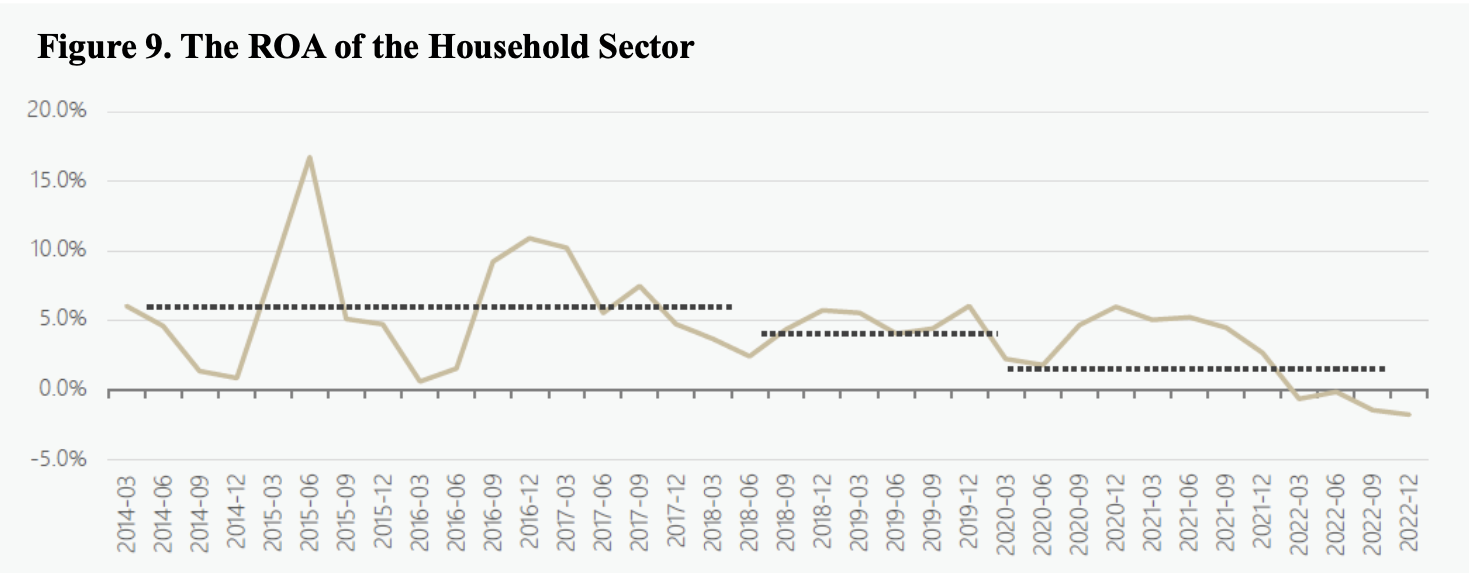
Sources: Authors’ calculations
Structurally, the ROA of the household sector demonstrated another interesting dynamic before and after the pandemic. As shown in Figure 10, before the pandemic, the return on financial assets and the return on real estate assets showed a strong negative association. After the pandemic, the association between the two turned from negative into positive. The return on both the risky assets, equity and real estate, fell at the same time and turned negative in 2022, dragging the ROA of the household sector in 2022 into the negative territory.
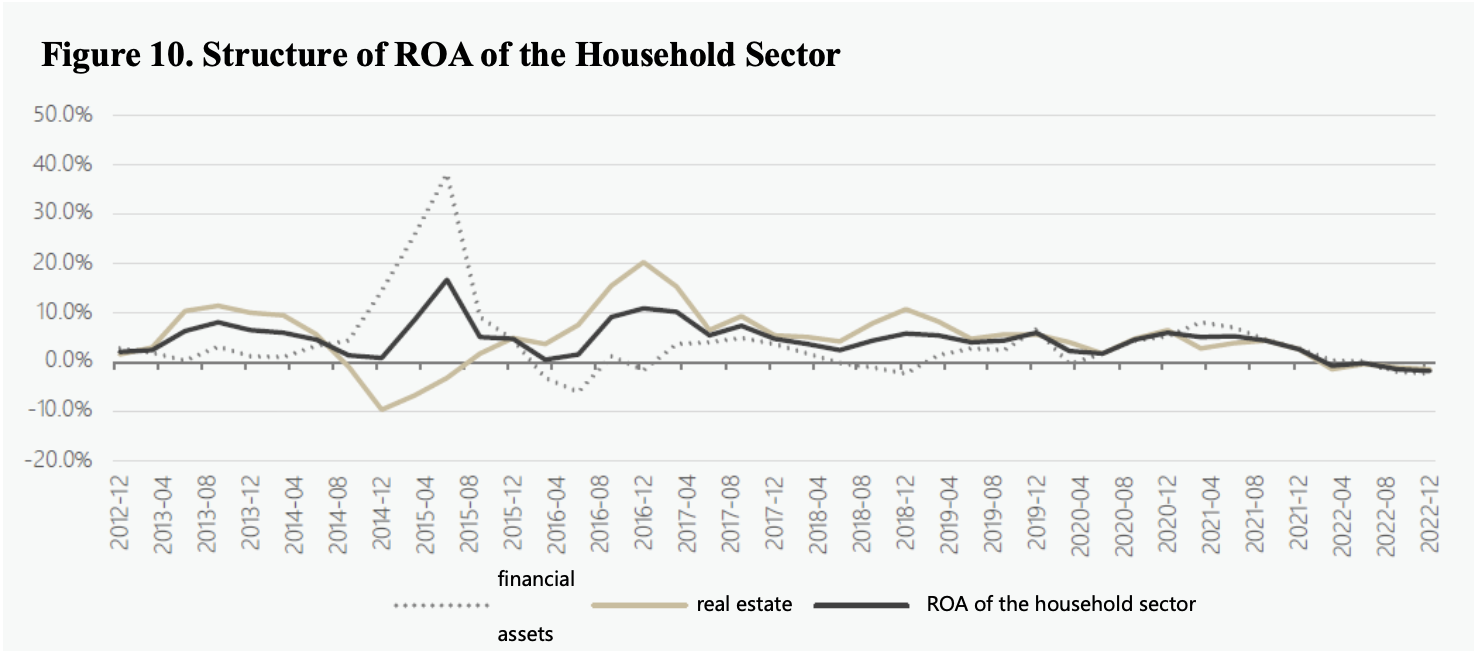
Source: Authors’ calculations
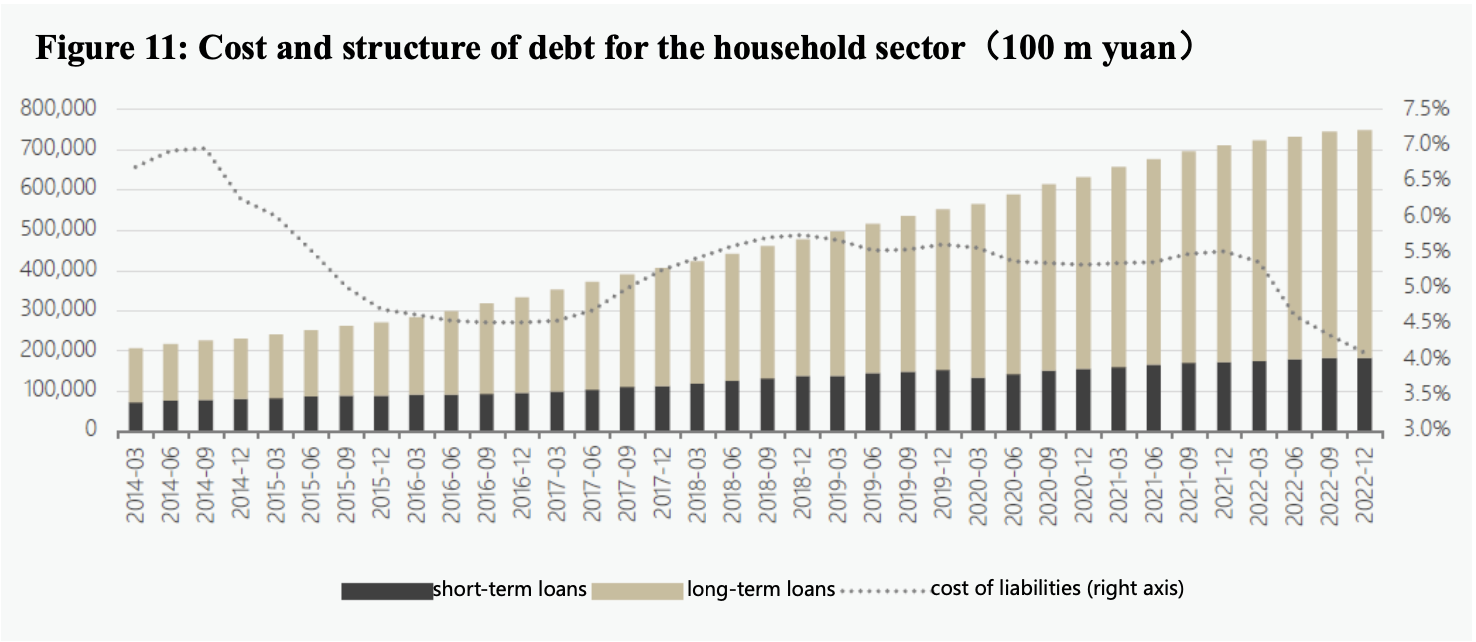
The debt structure of the household sector is relatively simple, consisting of short-term loans and medium- and long-term loans. Since the latter ones in the household sector are mainly individual housing mortgages, the interest rates for medium- and long-term loans are the individual mortgage rates of financial institutions published by the central bank every quarter. The interest rate for short-term loans is the smaller value between the general lending rate and the personal mortgage rate of financial institutions. By weighting the shares of the above two types of loans, the cost of liabilities for the household sector is obtained.
As shown in Figure 11, since 2014, the increase in liabilities for the household sector has mainly been in medium- and long-term loans. Unlike the cost of liabilities for the private business sector which showed a clear downward trend before the pandemic, the cost of liabilities for the household sector experienced a U-shaped change. From 2020 to 2021, it also showed no significant decline, and not until 2022 did it start to decline significantly.
Sources: Wind, Authors’ calculations
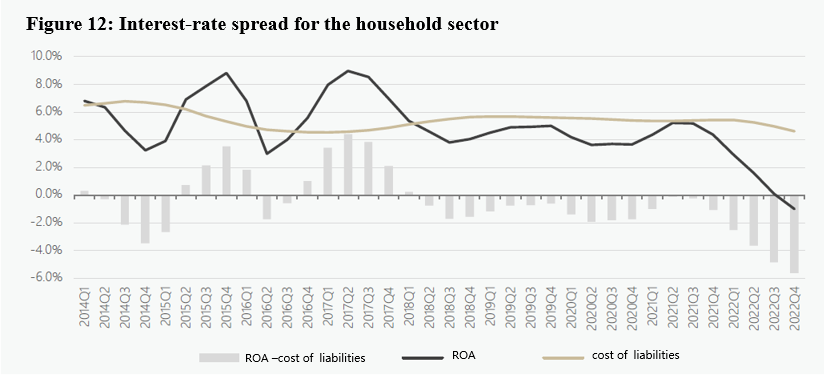
Since 2014, the interest-rate spread of the household sector balance sheet has been declining, rather consistent with the findings for the private business sector. As shown in Figure 12, from 2014 to 2019, the return on assets for the household sector in the long run was much more volatile than the cost of liabilities, so changes in the interest-rate spread mainly came from changes in the return on assets. From the perspective of long-term averages, from 2014 to 2019, the average return on assets for the household sector was 5.7%, and the average cost of liabilities was 5.5%. These two values were almost equal, with the return on assets slightly higher than the cost of liabilities. At the same time, during this period, the yields on financial assets and real estate showed a mirror relationship, implying that most of the time, the return on at least one type of asset outnumbered the cost of liabilities. After the pandemic broke out, especially after the third quarter of 2021, the return on assets for the household sector fell rapidly and turned negative, while the cost of liabilities, though falling rapidly as well, didn’t fall as much as the return on assets, resulting in a significant inversion between return on assets and the cost of liabilities for the household sector.
Source: Authors’ calculations
III. Changes in the interest-rate spread are closely related to the increase of financial leverage in the private sector
As mentioned above, over the past decade, the interest-rate spread of the private business and household sectors in China have both shown a trend decline, and the interest-rate spread narrowed significantly faster after the pandemic broke out than before. The direct implication of the narrowing spread is a decline in the risk compensation for investors and a corresponding decline in the opportunity cost of saving. Therefore, theoretically, narrowing spread directly inhibits the willingness and magnitude of increasing financial leverage in both business and household sectors.
The regression results show that from 2012 to 2021, the spread of private companies’ balance sheets has great explanatory power against the growth rate of their capital expenditures and interest-bearing liabilities, and the explanatory power was overall higher after the pandemic broke out than before. We used panel regression on the samples of listed private firms, and the results are shown in Table 2. With factors such as time, field, and scale being controlled over the sampling period, the spreads measured by ROA-cost of liabilities and ROE-cost of liabilities against the changes in the growth rates of capital expenditures and interest-bearing liabilities are both significantly positive. Meanwhile, from 2020 to 2021, except for the coefficient of ROA-cost of liabilities against the growth rate of capital expenditures, which was slightly smaller, other regression coefficients were significantly larger than before the pandemic. This suggests that after the pandemic broke out, the changes in the spread were causing stronger impacts on the growth rates of private firms’ capital expenditures and interest-bearing liabilities.
Table 2. Regression results of spreads against growth rates of private firms’ capital expenditures and interest-bearing liabilities
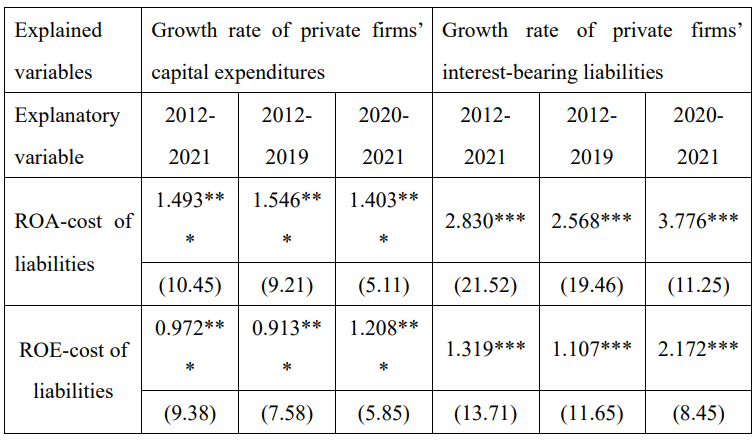
With the mean values of the corresponding parameters of the phases before and after the beginning of the pandemic (2012-2019 and 2020-2021), we can draw a preliminary conclusion about the magnitude and range of the impacts of spread changes on the growth rates of capital expenditures and interest-bearing liabilities. According to the parameters, it can be concluded that every one percentage point decrease in the spread in the private business sector led to a 1.2 to 1.3 percentage points decrease in the corresponding growth rate of capital expenditures and a 1.8 to 3 percentage points decrease in the growth rate of interest-bearing liabilities. Based on the above results, since COVID-19 broke out in 2020, we can calculate that the spread of the private business sector fell by roughly 2.5 percentage points, and the corresponding growth rates of capital expenditures and interest-bearing liabilities declined respectively by 3%-3.3% and 4.5%-7.5%. If this quantitative relationship works for all private sector members, then, since the beginning of the pandemic, the decrease in private sector spread may have led to a reduction in potential private investment demand by 800 billion to 1 trillion yuan.
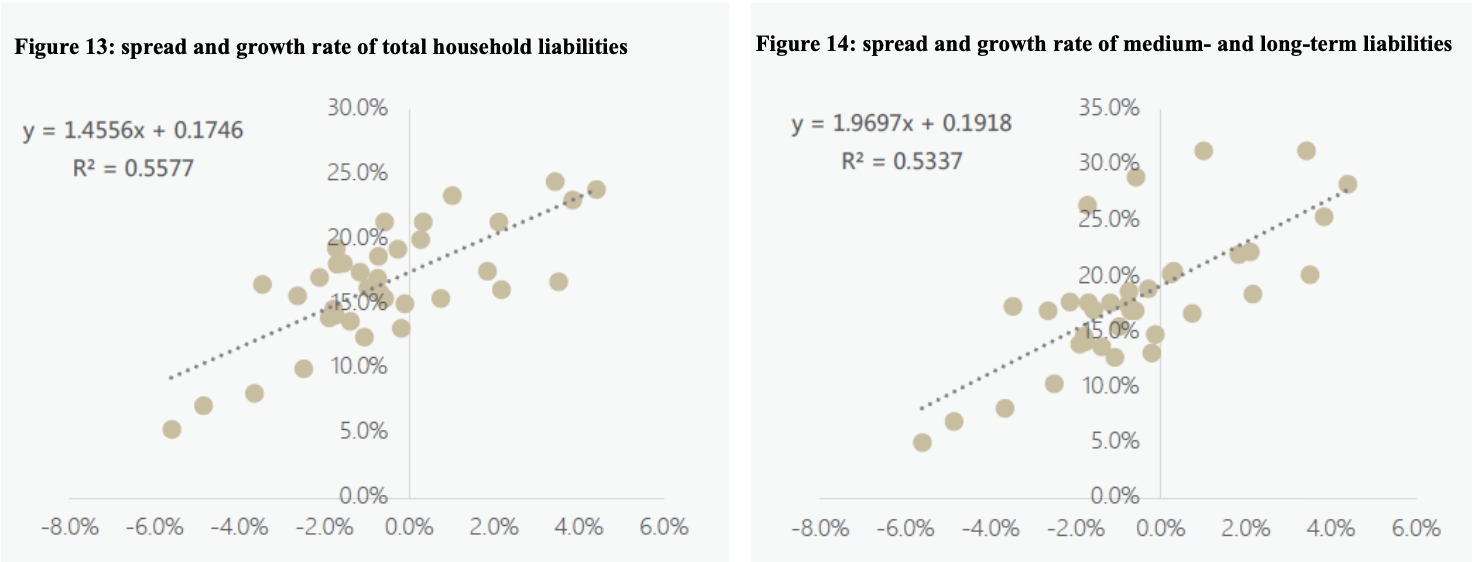
The results for the household sector are largely consistent with those for the business sector. As shown in the figures, historical data suggests that spread in the household sector balance sheets has a rather clear positive correlation with the growth rates of total household liabilities and medium- and long-term liabilities. Every one percentage point decrease in spread corresponds to about a decline of 1.46 percentage points in the growth rate of total liabilities and a decrease of 2 percentage points in the growth rate of medium- and long-term liabilities, respectively. Since COVID-19 broke out in 2020, interest-rate spread in the household sector has fallen by 2.2 percentage points, corresponding to a decline of 3.2 and 4.4 percentage points in the growth rates of total liabilities and medium- and long-term liabilities, respectively. This suggests that the narrowing of the spread led to a total reduction of about 1.8 trillion yuan, or an annual average of 600 billion yuan, in potential loan demand from the household sector. From 2017 to 2019, the new loans for the household sector rose by 7.32 trillion yuan on an annual average. From 2020 to 2022, this number fell by 780 billion yuan to 6.53 trillion yuan.
Source: authors’ calculations
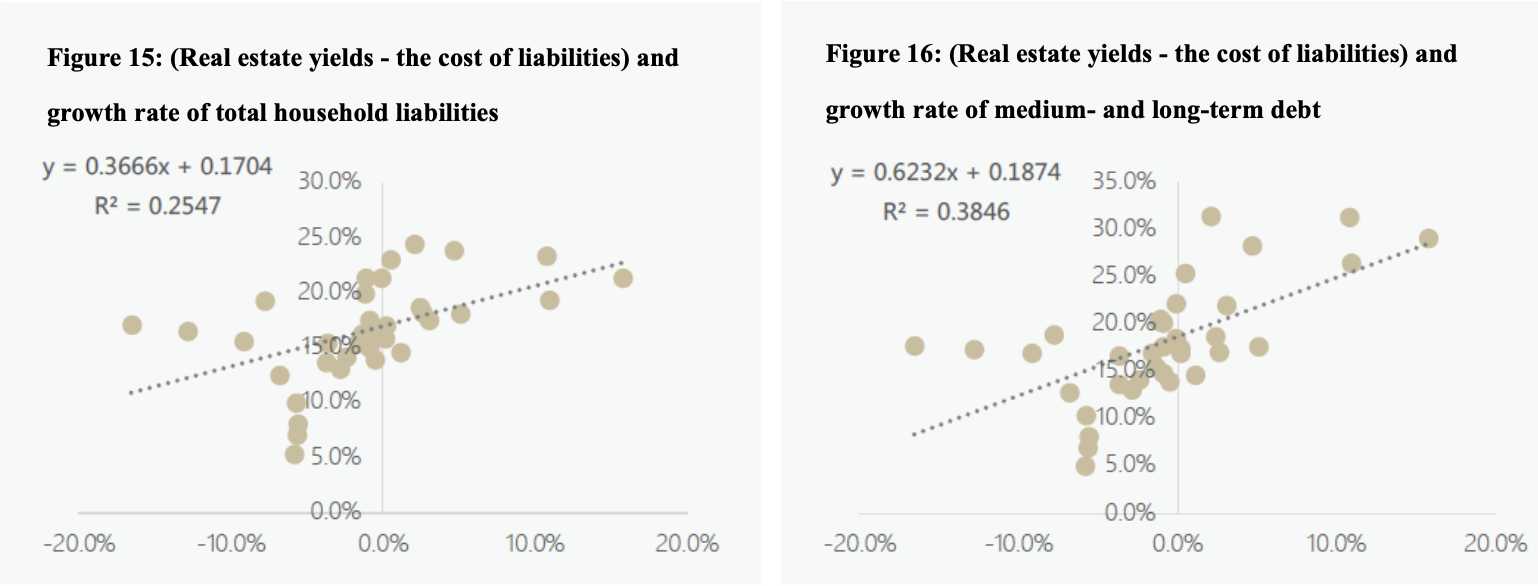
Furthermore, real estate yields minus the cost of liabilities is used to measure the potential benefits of residents loaning to buy houses, and the results are shown in Figures 15 and 16. As shown in these figures, real estate yields minus the cost of liabilities has a lower correlation with and weaker explanatory power about the growth rates of total household liabilities and medium- and long-term debt than the spread measured by the return of the household sector balance sheets. This suggests that the increase of financial leverage in the household sector results from more factors than taking loans to buy houses.
Source: Authors’ calculations
IV. Conclusions and Policy Implications
In conclusion, we panoramically reviewed the changes in the asset-liability ratio, cost of liabilities, and spread for China’s private sector over the past decade and had three basic findings.
First, over the past decade, the return on assets for China’s private sector showed a trend decline, and the reduction of the return on assets for the private sector since the pandemic has deviated significantly from the pre-pandemic trend.
Second, the past decade also witnessed a trend decline in the cost of liabilities for China’s private sector, but the decline was lower in the cost of liabilities than in the return on assets.
Third, after the pandemic broke out, the difference between the return on assets and the cost of liabilities for the private sector was only one-third of that before the pandemic, while the household sector faced a significant inversion between the return on assets and the cost of liabilities. According to historical data, the private sector’s increase in financial leverage is closely related to the interest-rate spread, which has narrowed significantly since the beginning of the pandemic.
The above findings provide us with new policy insights in many respects.
Firstly, the falling spread provides China’s persistently weak domestic demand with a more direct and micro-based new explanation. The continuing decline in return on assets means that the private sector faces decreasing potential investment opportunities in the future, while the significant narrowing of spread means that the private business sector is receiving less risk compensation by leveraging up. In such a situation, despite a healthy balance sheet structure, incentives to leverage up won’t be strong on account that it’s not cost-effective to leverage up from a cost-benefit perspective. Much evidence has proved that since the beginning of the pandemic, the balance sheets of China’s real sector have experienced damages to varying degrees (Wang Qushi et al., 2022 ), and the shocks brought by the pandemic may have a broad “scarring effect” on the economy (Zhang Bin, Zhu He & Sun Zihan, 2022 ). However, against these backdrops, improving the private sector spread by lowering the benchmark interest rate will help not only improve private sector balance sheets, but also stimulate endogenous incentives for private sector leveraging.
Secondly, more importance should be attached to the reasons for the trend decline in the return on assets for the private business sector. As previously mentioned, this trend decline cannot be justified by the nominal GDP growth rate, which, at least, is not the most important influencing factor. We think it fair to analyze the trend decline from at least three aspects: aggregate, efficiency, and structure. From the aggregate perspective, a clear over-investment in the private sector, according to the diminishing marginal efficiency of investment, accelerates the reduction of return on assets. From the efficiency perspective, the slowdown in technological progress and the decline in total factor productivity growth also impact the return on assets for the private sector. From the structural perspective, as their capital faces explicit or implicit access restrictions to some industries, private firms tend to invest in industries with higher expected returns on assets, thus lowering the return on assets. Based on the findings of this paper, we are yet unable to conclude which factors play a dominant role, and thus further in-depth research is required to answer this question.
Thirdly, the interest rates should respond timely to the decline in return on assets. Theoretically, the policy rate should be adjusted according to the interest rates. Against the backdrop of a trend decline in return on assets, the level of China’s interest rates will change accordingly, and timely adjustments should be given to the benchmark interest rate. The policy rate is a core determinant of the cost of liabilities for the private sector. A lowering policy rate will provide a direct hedge against the narrowing of spread brought about by falling return on assets.
Fourthly, at present, the public sector should maintain its important role in stabilizing growth, but due attention should also be given to the grassroots fiscal pressure, the efficiency of public funds usage, and impacts on resource allocation efficiency in the medium and long term. Before the spread between the return on assets for the private sector and the cost of liabilities rises again, we hardly can expect the private sector to act as a main force in leveraging up and driving credit growth. To ensure a sustainable and strong economic recovery, the task of stabilizing credit has to return to state-owned enterprises and the government sector. As the public sector plays its role, careful consideration should be given to the practical situation of grassroots finance to avoid stabilizing growth at the expense of grassroots financial sustainability. At the same time, more importance should be attached to the efficiency of public funds usage. More funds should be invested in industries and fields that support public welfare and generate spillover effects so as to minimize the marginalization of the private sector.
Appendix
(I) Calculation of ROA and ROE decreases for listed private firms in 2022
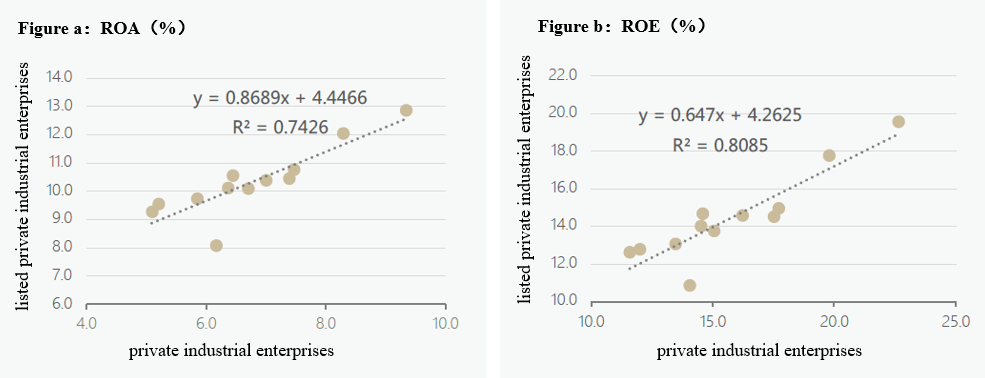
We subtracted the financial data (total profits, total assets, and total liabilities) of the industrial enterprises above the designated size with the corresponding financial data of the state-controlled industrial enterprises published by the Bureau of Statistics and calculated the ROA and ROE of non-state-owned enterprises from 2012 to 2021. As shown in Figures a Figure b, the changes in ROA and ROE of listed private industrial enterprises and private industrial enterprises show a strong positive correlation, with coefficients of 0.87 and 0.65, respectively. In 2022, the ROA and ROE of private industrial enterprises decreased by 0.8% and 1.6%, respectively. With the coefficients, it is calculated that, in 2022, the ROA and ROE of listed private industrial enterprises decreased by about 0.7% and 1%, respectively.
Source: authors’ calculations
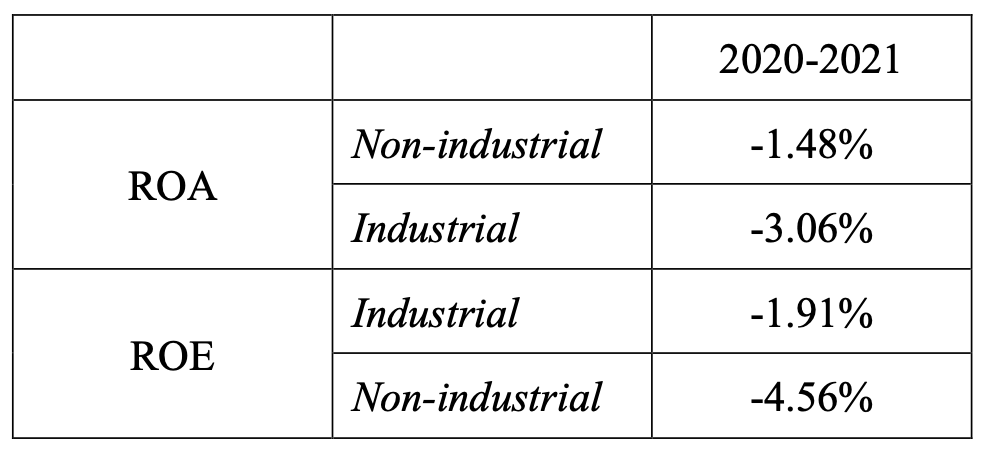
Next, we calculated the changes in the return on assets for the non-industrial sector. As shown in Table a, after the pandemic broke out, in listed private industrial enterprises, the return on assets decreased more significantly in the non-industrial sector than in the industrial sector, with the decline in the former twice as much as in the latter. This is consistent with the reality that the service sector is impacted harder by the pandemic.
Table a. Marginal changes in the return on assets of the industrial sector and the non-industrial sector in listed private industrial enterprises
Source: Authors’ calculations
With the above calculated ROA and ROE decreases for industrial enterprises in listed private industrial enterprises in 2022, we can figure out the ROA and ROE decrease for non-industrial firms among listed private firms in 2022 to be about 1.4% and 2%.
Finally, based on the shares of the two types of listed companies, we can calculate the decreases in ROA and ROE of listed private firms. In 2021, among the samples of listed private firms, 2231 were industrial, and 543 were non-industrial, with a ratio of 8:2. Based on this weight, it can be calculated that the decreases in ROA and ROE of listed private firms in 2022 are 0.8% and 1.2%, corresponding values are 6.7% and 8.9%, respectively.
(II) Calculation of cost of liabilities for listed private firms in 2022
We planned to calculate backward the change in the cost of liabilities of listed private firms in 2022, with the weighted financing rate of the business sector, which is a weighted average of the 2022 average general lending rate of financial institutions and the average issuance rate of 1-year medium-term notes of the same year. The weight is the relative value of new RMB loans and new corporate bonds in 2022.
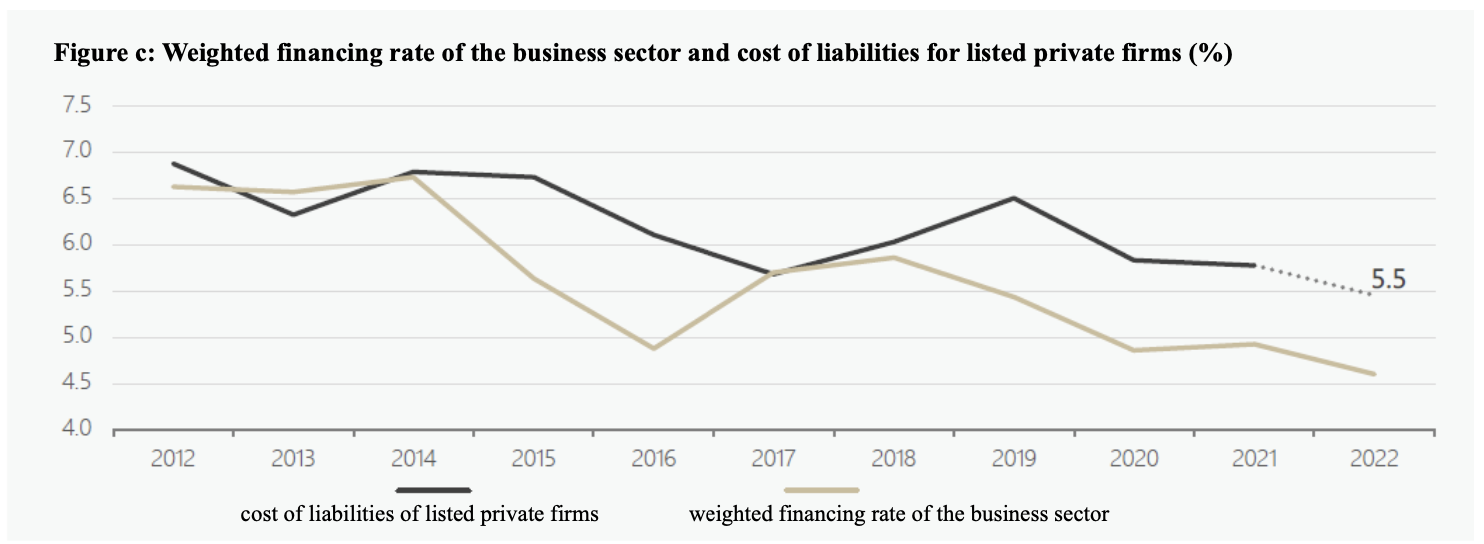
As depicted in Figure c, since 2012, the weighted financing rate for the business sector has also shown a trend of continuing decline. From 2012 to 2019, the weighted financing cost of the business sector dropped from 6.6% to 5.4%, a decrease of 1.2 percentage points. From the perspective of trends, the weighted financing rate of the business sector performs largely in line with the cost of liabilities of listed private firms. From 2019 to 2021, the weighted financing rate of the business sector and the cost of liabilities for listed private firms declined by 0.7% and 0.5%, respectively, indicating that, since the beginning of the pandemic, the marginal changes in both have been largely equivalent. Therefore, we assume that in 2022, the decreases are equivalent to the cost of liabilities for listed private firms and in the weighted financing rate of the business sector (0.3% lower than in 2021). It can be calculated that in 2022, the cost of liabilities for listed private firms fell by 0.3% over 2021 to 5.5%.
Source: authors’ calculations