
Abstract: COVID-19 has injured Chinese households and businesses’ mentality and balance sheets, and policy support is needed to repair these scars. Particularly, the liquidity crisis facing the real estate sector in China has exposed the inherent vulnerability of its high turnover growth model, which was exacerbated by deleveraging policies and Covid’s blow. Going forward, the real estate sector will see an orderly resolution of defaults and business model transformation. This article proposes a four-quadrant analytical framework to evaluate the influence of development and security issues on the valuation and structure of the Chinese capital market.
I. SCARS OF COVID-19
China has adjusted its Covid control policy and begun to get prepared for long-term coexistence with the virus. In the near future, hopefully in the second quarter of 2023, Chinese people will restore a normal life and pull the economy back on track. And now, it is time to look back on the scars the pandemic has left.
1. Where are the scars?
Covid has stalled economic development, frozen people’s life, and slashed income growth. It has damaged the balance sheets of households and businesses, and it takes time to repair them.
Covid has also injured people’s mentality, reducing their risk tolerance, resilience, and expectations for future growth, accessibility, and stability of income.
How has the scarring effect been manifested in statistics?
In theory, households spend some of their income on consumption and save the rest in bank deposits or money funds. When they need to buy real estate or run their own business, they will borrow from banks and pay back with their future income.
Then, we could calculate a ratio of the difference between incremental deposits and incremental loans to the total income of households over a period of time (e.g., a quarter). Deposits here include savings and money funds, while loans include loans to buy houses or do business.
As shown in Figure 1, the ratio has surged since March 2022, even if it had already been at a relatively high level compared with the previous 7-8 years. It indicates that households have become cautious with asset allocation, risk-averse, and pessimistic about the future.

Savings are generally defined as the remainder after deducting consumption (e.g., purchasing of goods, such as food, liquor & tobacco, cars, and of services, such as haircut) from the income of households. Savings can be used to invest or purchase real estate.
Figure 2 offers a clue as to how household savings has evolved in China.
The red line represents household survey results. Each major blow from Covid has been followed by a significant increase in the household savings rate. Part of the increase was passive savings due to stalled economic activities; part was preventive because households were less confident in future income growth.
The blue line indicates the household savings rate that we have calculated based on statistics on national income and retail sales of consumer goods. It, obviously, is different from the survey results, especially for the period after Covid. It shows that the household savings rate has kept rising, and people have been less willing to spend.

Other factors unchanged, the scarring effect largely explains why 2022 has seen real estate and stock market plunges. Similar downturns in the past have taken place against specific macroeconomic backgrounds, such as inflation surges, tightened regulation, liquidity crunch, or a sharp rise in credit rates—none of which was the case in 2022.
2. Policy intervention is important to scar repair
Natural disasters are believed to cause scars on human mentality. The negative impacts weaken as timepasses but still sustain for a while. Usually, they make people more risk-averse.
But there are exceptions.
Example 1: The Elbe River in Germany had a severe flood in 2002. Scholars have probed into the disaster’s impacts on household income and expenditure and found that not all households have been affected by the flood. The income and expenditure of the unaffected then serve as a useful control sample.
But no remarkable difference has been found between the affected and unaffected households in terms of their income and expenditure, which was unexpected from a scarring effect point of view.
Experts believed this was thanks to Germany’s sound social security system, which compensated people for their losses in the flood. With the policy support, the disaster left no severe or sustained impacts on local households’ balance sheets or mentality, and they rapidly resumed their normal life.
Example 2: While the United States has borne huge blows from Covid, there has been no significant scarring effect on American household savings in 2022. Had there been the scarring effect, the savings rate should have been much higher than before Covid, but we have actually seen decreased willingness to save and increased propensity for spending. This may be partly due to the country’s strong economic data and mounting inflation.
The scarring effect weakened rapidly because the U.S. government provided huge subsidies and transfer payments for households during Covid, which protected their balance sheets and cushioned the mental impacts, so that they could go back to normal soon after the virus was brought under control.
However, according to research on post-pandemic behavioral changes and China’s data as of today, the scarring effect is expected to continue for a while.
II. REAL ESTATE SECTOR IN CHINA: ORDERLY REBALANCING AND PROGRESSIVE TRANSFORMATION
China’s real estate sector experienced drastic adjustments in 2022. Data on house sales and newly commenced projects dipped, house prices fell, and default pressure prevailed. Pessimists saw the real estate bubble bursting which was believed to be irreversible from the experience of Japan and the US, with negative impacts on economic growth over the long term.
Next, we provide some different views from the perspective of intended/unintended inventory, oversupply, and price elasticity.
1. Unintended inventory of commodity housing
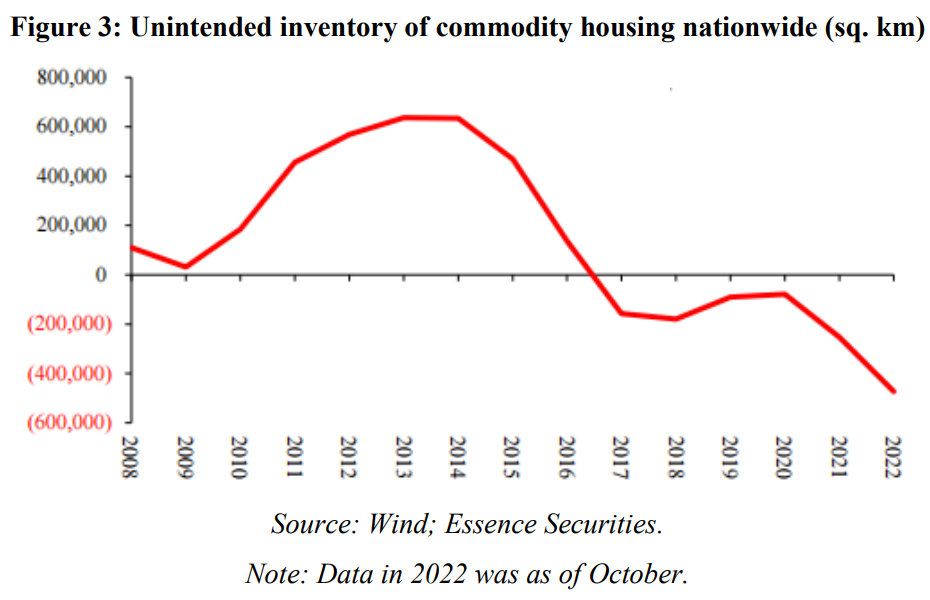
First, let’s look at an indicator we have been tracking, which is the unintended inventory of commodity housing of real estate developers. See Figure 3. Note that “0” in the figure does not indicate an inventory of zero; instead, it’s where the actual inventory of developers equals what they intend to hold.
It’s clear that during 2013-2014, developers once accumulated large amounts of excess inventory, but a large proportion of them had already been disposed of by 2018. The estimate shows that in 2021 and 2022, the level of unintended inventory held by Chinese real estate developers was extremely low compared with in history.
It requires several conditions to form a real estate bubble:
? Households and financial institutions are firmly confident in real estate sector’s future and house price growth.
? Extremely loose financial environment, where households and financial institutions have access to loans at low costs when they want to speculate in the real estate market. Sustained credit inflow and shared expectations for house price growth accelerate the forming of a bubble.
? House price surge stimulates house supply, as it results in developers proactively building and selling more houses.
But when the bubble bursts, there will be two problems.
On the one hand, the increase in house supply during a bubble is abnormal from a long-term view. It takes a long time to digest the excessive supply, exerting negative impacts on real estate investment and the demand of related industries in the mid to long run.
On the other hand, when the bubble bursts while the excessive supply has yet to be fully digested, the houses will have to be sold at an oversupply-induced lower price, damaging the balance sheets of banks and households.
Then, banks would have to repair their balance sheets by tightening credits, improving the requirement on lending, re-raising capital, or even hiding their bad debts. At the same time, households have become heavily indebted to banks in their speculative activities in the housing market, and it takes long for them to recover from the blow as a result of the house price fall, too.
2. Investment in real estate development as a share of GDP
A devastating real estate bubble formed via the above-mentioned process is supposed to be accompanied by an abnormal swell of real estate investment.
Let’s look at the data on the Japanese real estate sector. As shown in Figure 4, before 1985, real estate investment accounted for around 8% in the Japanese economy. Still, it surged to over 10% after the real estate bubble appeared in 1987, indicating that house supply was increasing.
After the real estate bubble burst in 1991, the real estate investment/GDP ratio in Japan began to decline. The early fall reflected the elimination of excess supply; the later decline may be more related to the rapid population aging.

As shown in Figure 5, the United States had a similar experience before 2004; real estate investment accounted for nearly 8% of the total GDP.
As we all know, Japan in the 1980s and the US in 2000 were already highly developed economies with high per capita income and completed urbanization.
After 2003, the ratio in the US began rising to 10%, reflecting the supply expansion and the market bubble. Since then, with the bursting of the bubble, the ratio has experienced a long period of sharp decline, a process of digesting excess supply and exerting pressure on the balance sheets of enterprises and households. It was not until 2014 that the US housing market looked largely stable, and until the last two years, the proportion of US real estate investment in GDP was barely close to 7.3%, but it still did not reach the level before 2003.

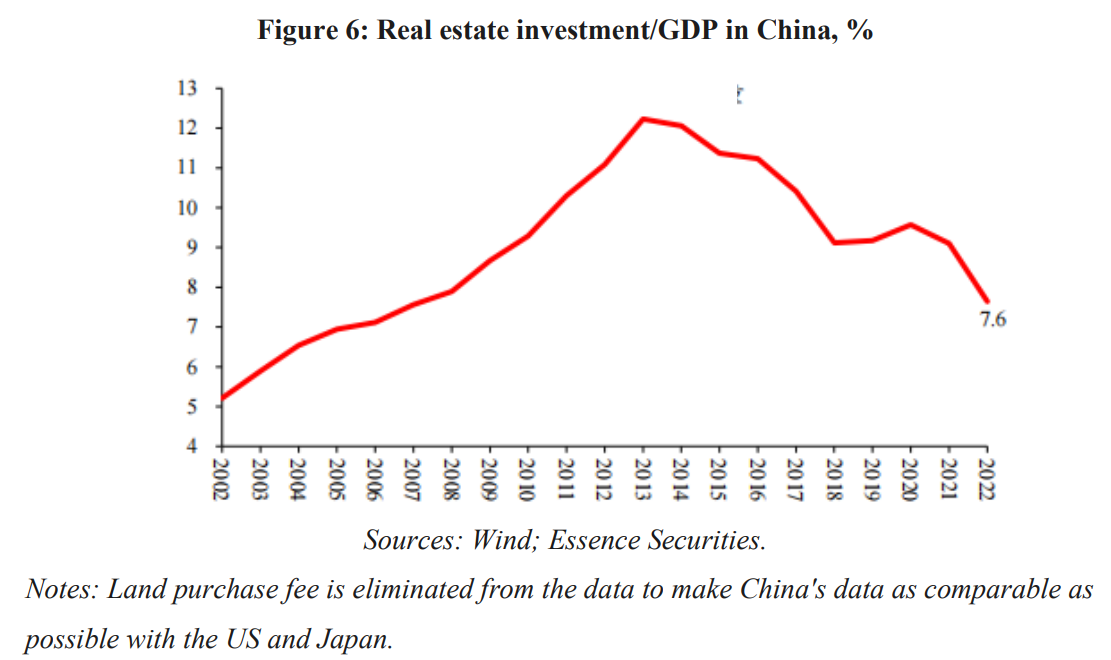
In the case of China, as shown in Figure 6, we remove the land purchase fee in real estate development and investment to make China's data comparable to the US and Japan. It can be seen that real estate investment/GDP peaked at around 12% in 2013, then experienced a fluctuating decline after 2014, and is expected to be around 7.6% by 2022, which is comparable to the level in Japan in the early 1980s before the bubble burst and the level in the US before 2003.
It is hard to conclude such a ratio is high, given that China has not reached the finishing line of urbanization and its per capita income is rapidly rising.
3. Price elasticity of new houses and second-hand houses
In addition, it can be verified from another angle – housing price elasticity. In the past 15 years, China's real estate market has experienced five rounds of cycles. We analyze by calculating and comparing the housing price elasticity of each round of real estate market decline.
The price elasticity is calculated as follows: count the decline in transaction volume and the decline in the price of new or second-hand housing, and the ratio of the decline in price to the decline in transaction volume is regarded as elasticity.
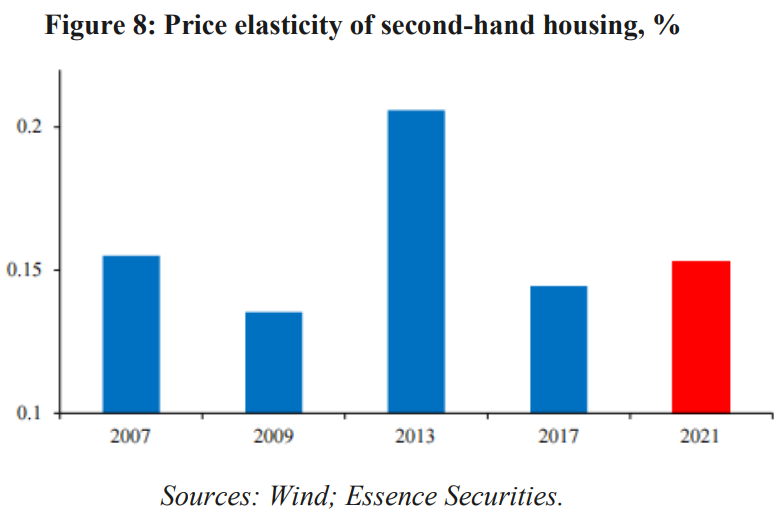
As shown in Figures 7 and 8, in 2013, when real estate investment/GDP was highest and estimated real estate inventory was highest, the elasticity of new housing prices in the process of price decline was also highest. To some extent, price elasticity represents market supply pressure or the slope of the supply curve. As a result, when supply pressure was greatest in all aspects in 2013, the elasticity of price decline was also greatest.
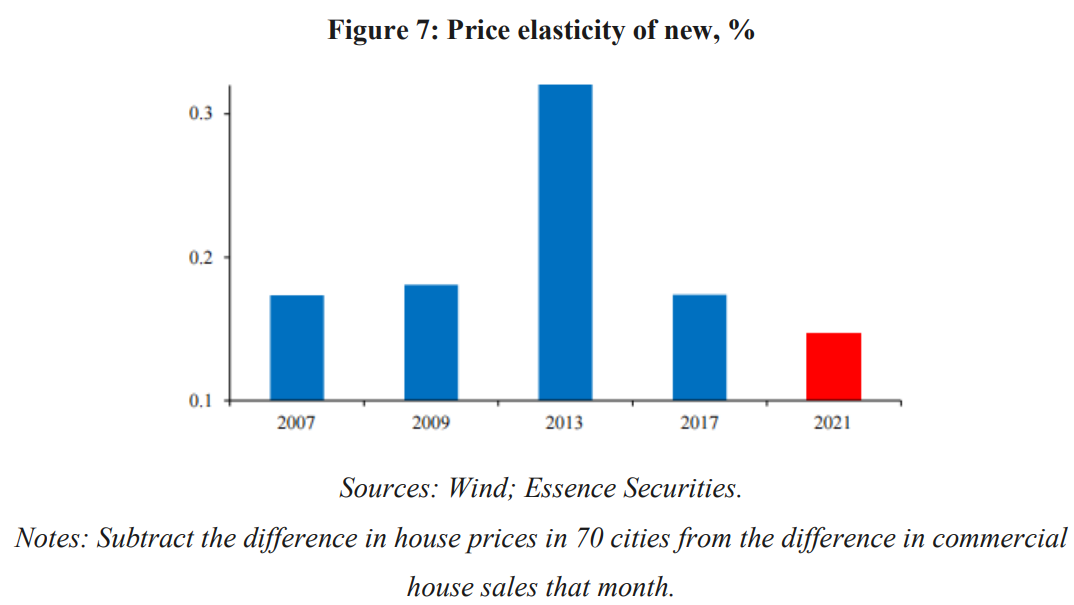
In comparison, the decline in transaction volume in this round of real estate price declines since 2021, including the impact of the pandemic and market adjustment, is quite remarkable. Nonetheless, the price elasticity of new homes since 2021 has been the lowest in the previous 15 years. This also implies that the new housing market is not experiencing significant oversupply.
The price elasticity of the second-hand housing market in 2013 was also very high, indicating significant supply pressure. Although price pressures have been greater this year, they are still significantly lower than in 2013, close to the level in 2007 and historically at the median level.
The supply pressure on the second-hand housing market seems to be slightly higher than that of the new housing market. An additional explanation may be that some residents may be forced to reduce their excess real estate holdings after suffering the impact of the pandemic on their production operations and balance sheets, just like reducing their holdings of stocks, thus causing additional supply pressure to the second-hand housing market.
4. The main reasons for the sharp adjustment of the real estate market
We believe that the real estate market this year has mainly been hit by two factors, rather than the impact of the bursting of the bubble.
One factor is the scarring effects of the ongoing pandemic that intimidate potential home buyers and drive the reduction of house hoarding, which caused pressure on the demand side.
Another factor is the high turnover model, which has gained popularity in the real estate industry since 2016. It is essentially a high-leverage model that is inherently fragile, relying heavily on continuous and smooth financing and debt instruments. Such vulnerability was fully exposed as a result of real estate regulation, which forced the entire industry to overturn its business model. This process has been hampered by the scarring effect of the pandemic on the demand side.
These two factors largely explain the real estate industry's downturn in 2022: low housing sales and new construction data, a sharp drop in development investment growth, and widespread default risks.
5. The real estate industry is currently in the process of orderly liquidation and gradual transformation.
The Chinese government has recently adopted strong support policies for the real estate industry, relieving liquidity pressure on large real estate companies. This could indicate that the real estate industry has begun a systematic supply-side clearance and gradual business model adjustment.
The biggest issue confronting the real estate industry in the medium to long term is that data on new constructions have generally remained at a rather low level in recent years due to orderly supply-side clearing. Based on real estate investment/GDP and our estimates, the voluntary inventory in the real estate industry is at a low level.
If the scarring effect fades away and the business model is transformed, we will have to consider the possibility of insufficient market supply after market demand normalizes.
Ⅲ. COORDINATE DEVELOPMENT AND SECURITY
1. Changes in the global political and economic environment
The global economy experienced nearly three decades of rapid development oriented by growth and efficiency, through openness and integration, and ended with raging economic growth during the post-Cold War era. China is undeniably one of the biggest winners.
The 30-year globalization has profoundly altered the global geopolitical landscape. However, as the geopolitical environment has changed as a result of globalization, as well as the evolution of the political and economic situation in many countries, security concerns have become an issue that many governments, businesses, and financial institutions must consider when thinking about growth and efficiency. This is an important factor to consider.
For example, when considering the global distribution of supply chains and production capacity, multinational company management should consider not only increasing efficiency and lowering costs, but also supply chain security and resilience, backup and redundancy, and so on. When institutions allocate assets in the international financial market, they must consider whether their US dollar assets will face the same fate as the Russian central bank's foreign exchange reserves, which have been frozen or confiscated due to a variety of political factors.
As another example, the imposition of additional restrictions on many technological fields by western governments is widely regarded as reflecting their growing security concerns.
Therefore, taking security concerns into account while pursuing economic growth has become a widely held concern around the world. After all, security is the foundation of development, and development ensures security.
It is unclear what China's future legal and regulatory system for coordinating security and development will look like. Policy formulation, regulations, and the legal system all require investigation and improvement. However, a closer examination of some of the government's work in this area and its implications will undoubtedly provide some insights.
2. Analysis of how security and development issues affect the valuation system of the capital market
Now that the world and China are considering security and development, how will changes in the themes of the times affect the capital market valuation system, particularly the valuation structure?
As the system of policies, laws, and regulations becomes more detailed and sophisticated, we can expect to see an increase in the number of cases.
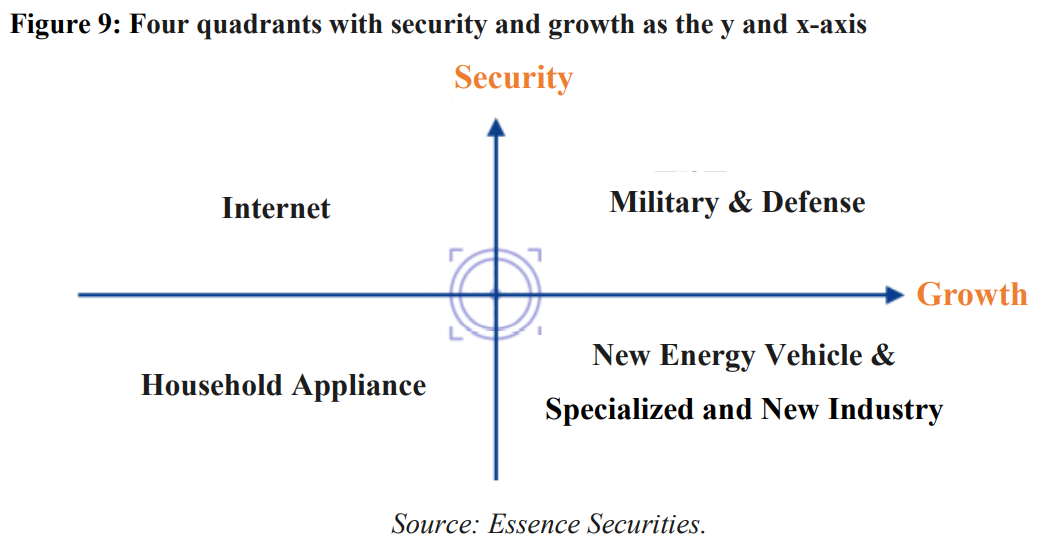
Our basic idea is that we can establish a two-dimensional four-quadrant coordinate system, the horizontal axis is the growth dimension, and the vertical axis is the security dimension.
On the horizontal axis of this four-quadrant system, the further to the left, the weaker the growth momentum and potential of a given industry or enterprise; the further to the right, the opposite. On the vertical axis, it describes the degree of safety concern, and the lower it goes, the less safety concern there is, or the industries or companies associated with it have little regard for safety; the higher you go, the greater the security concern.
It should be noted that the vertical axis represents a security dimension that, in theory, should represent a broader security concept. Financial, economic, ecological, territorial, political, and ideological security, among other things, should all be considered. In a nutshell, it refers to the overall security concerns of a government.
From the horizontal axis, we know that in the Chinese capital market, there are usually some simple rules:
First, when purchasing bonds, it is necessary to purchase bonds from SOEs when the company's fundamentals are similar. The reason is straightforward. On the one hand, SOEs operate with greater stability, but of course, there are many stable private enterprises. When the industry, on the other hand, experiences unexpected shocks and difficulties, the possibility of SOEs receiving government assistance is at least equal to, if not greater than, that of private enterprises.
Second, when buying stocks, it is necessary to buy private enterprise stocks when the fundamentals of the company are similar. SOEs are overly stable and have insufficient risk exposure, whereas private enterprises have higher growth demands and can better match stock investors' growth risk exposure requirements.
Historically, industries with lower growth tend to provide stable business environments where SOEs can thrive. But in those competitive industries with high growth, uncertainty in technological development and low entry and exit barriers, the edge of SOEs is not that prominent relative to private enterprises.
Based on the context mentioned above, as Figure 9 shows, we try to list some cases in the four quadrants with security and growth as the y and x-axis, respectively. Part of the reason for the attempt is to reflect the changes in security concerns over the past years. Part of the reason is that the cases can help illustrate the logic of the analysis in the following paper.
(1) Quadrant 1
The first quadrant has two features, i.e., high growth and security-related. Typical industries include sensitive areas like key technologies critical to the development of advanced manufacturing, “bottleneck” technologies, and the military and defense industry.
Given their high growth potential and importance to national security, these areas might be the focus of the new system for mobilizing the resources nationwide to achieve breakthroughs. Yet it remains to be seen how the new system will play its role in the first quadrant.
The challenge is, if SOEs with relatively stable operation dominate the sectors in the first quadrant, they might not be capable of seizing the best technology path and driving market growth amid rapidly growing and evolving technological environment.
Nevertheless, to what extent they could address the security concern is also worth considering if the area is dominated by private enterprises.
(2) Quadrant 2
The second quadrant is still defined by an emphasis on security. Yet the second feature is weak growth or even zero growth, which means the technology landscape, business models, and markets in the area are relatively stable.
(3) Quadrant 3
The third quadrant features zero growth and irrelevance of security concerns. In this area, the government should stick to its long-term policy by further opening up, removing administrative monopoly to incentivize competition, and supporting and encouraging private enterprises to grow and thrive.
(4) Quadrant 4
The area features relatively strong growth potential and meanwhile little relevance to security concerns. Undoubtedly, private enterprises are the prevailing force to cope with high uncertainty due to the constantly evolving technology and business environment.
A major challenge facing the area is that western governments have begun to intervene and subsidize relevant sectors to gain competitive advantages, which distorts the global business environment. It is thus quite demanding for the industries to establish and maintain competition rules that are open and fair under the framework of WTO in order to stimulate globalization of technologies, standards, and division of labor as well as prosperity in a broad sense.
3. Representative cases
Given that the security dimension has been taken into account in recent years, case study was employed to review how the changing process affects the valuation system of the capital market and illustrate the analysis above.
(1) Military and defense industry (Quadrant 1)
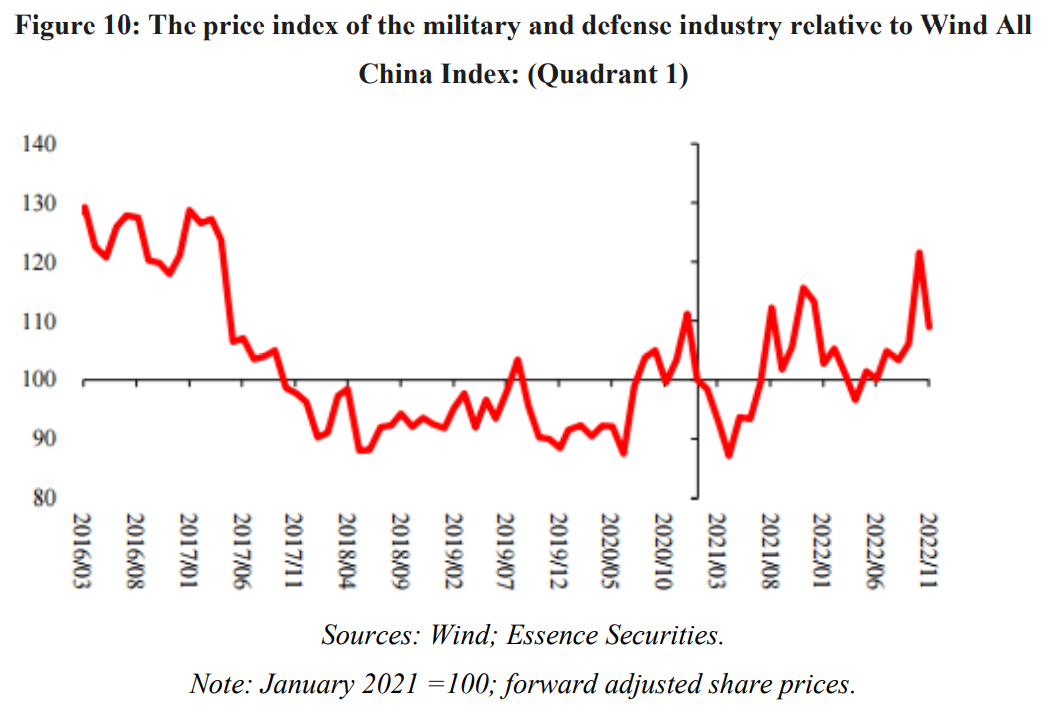
First, we think that a typical industry in the first quadrant is the military and defense industry which has strong relevance to security and positive growth potential. Specifically, Figure 10 demonstrates the price index of the military and defense industry relative to the Wind All China Index by setting a certain time point as 100. It can be found that since the second half of 2020, the price index of the military and defense industry has risen compared with the Wind All China Index despite some vitality, and the comparative return of the industry has widened significantly.
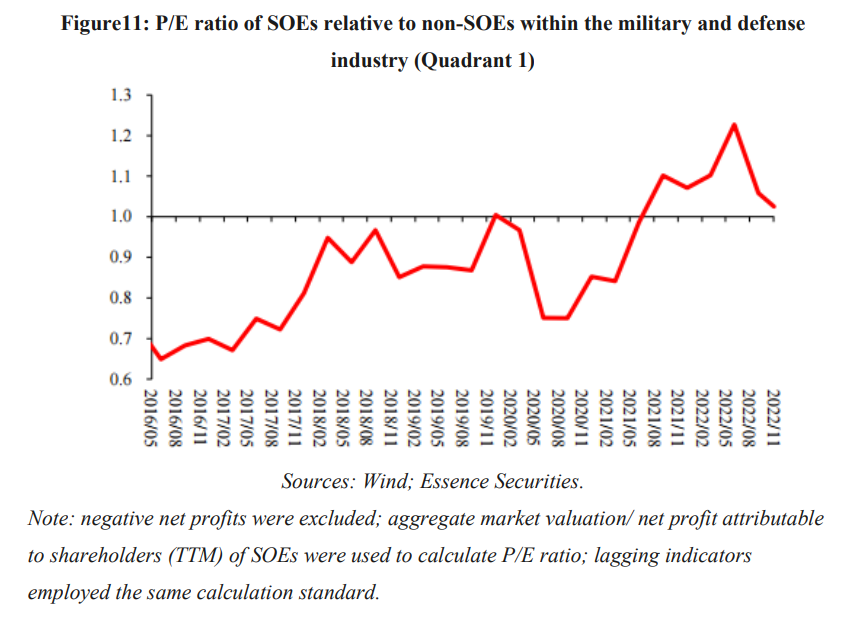
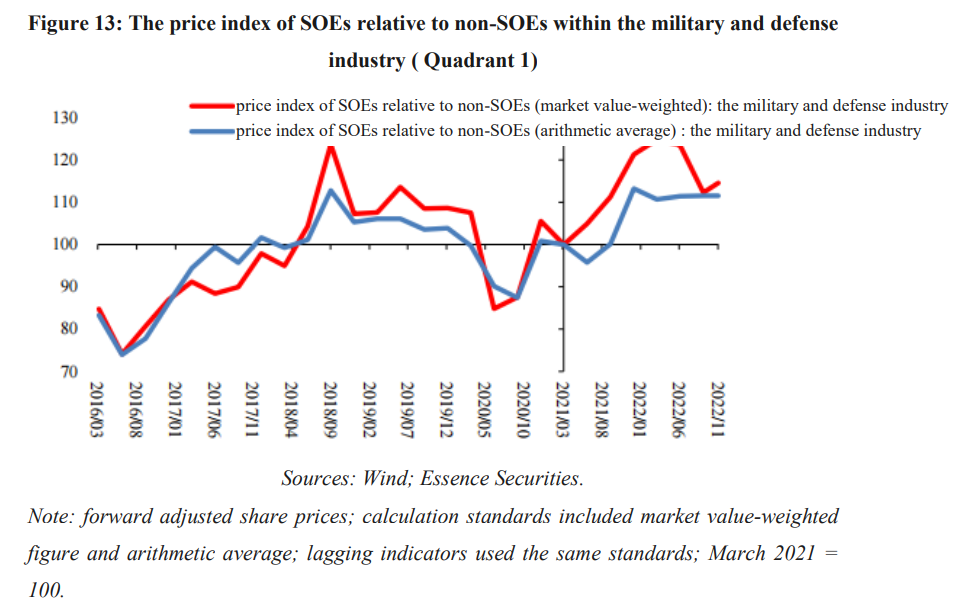
As mentioned earlier, given the environment and features of industries in the first quadrant, SOEs in these industries may have extra advantages which will be manifested in their valuations. Therefore, as shown in Figure 11 and 12, when the military and defense industry was generating returns compared with the market, within the industry itself, since Q3 2020, the P/E and P/B ratios of SOEs have risen sharply compared with non-SOEs, suggesting higher valuation advantage of the former; as illustrated in Figure 13, within the military and defense industry, the price index and profitability of SOEs also increase relative to non-SOEs.
Indeed, the higher excess return of the military and defense industry relative to Wind All China Index might be explained by other causes. But the prominent edge of SOEs relative to non-SOEs in valuation and returns within the industry might provide another piece of evidence worth thinking about.

(2) Internet industry (Quadrant 2)
The Internet industry is a representative case in the second quadrant. It is an important sector in the process of curbing the unregulated expansion of capital which clearly involves security concerns. With the end of the high-growth period, the industry has shifted to low-to-medium growth over the past years, which basically fits the features of the second quadrant.
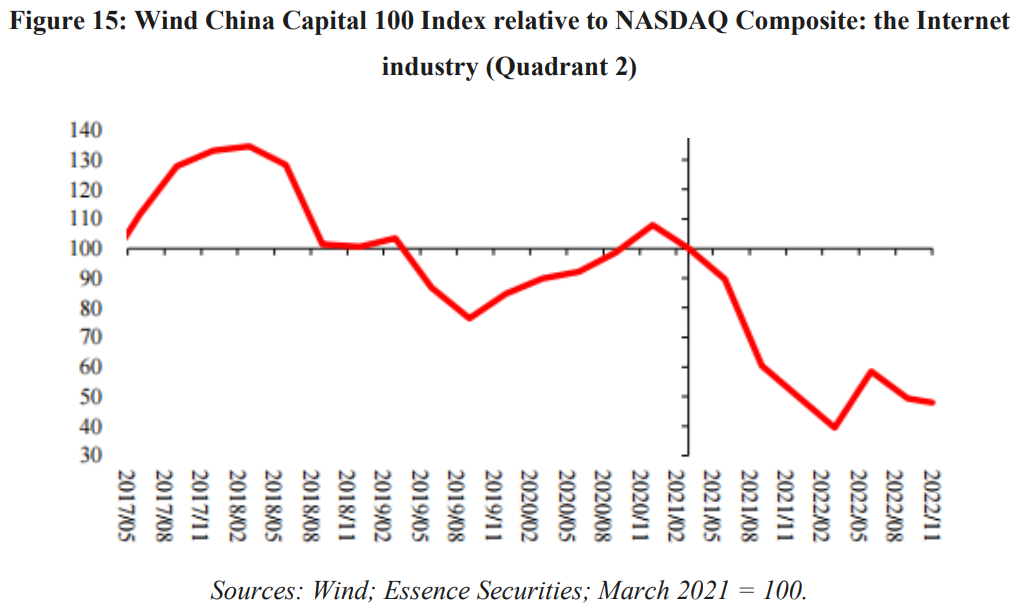
Among the industrial indices that can represent the Internet industry, we selected Wind China Capital 100 Index which reflects a rather macro picture and multiple industries. As shown in Figure 14, most of the companies included in the index are typical Internet firms; even those in the traditional sectors are closely engaged in the Internet. A sample of only 100 China concept stocks also excludes cases with small valuations and transactions.

As shown in Figure 15, using the NASDAQ Composite as the benchmark, Wind China Capital 100 Index has weakened significantly since 2021 and has only stabilized since the second quarter of 2022 after a slide.
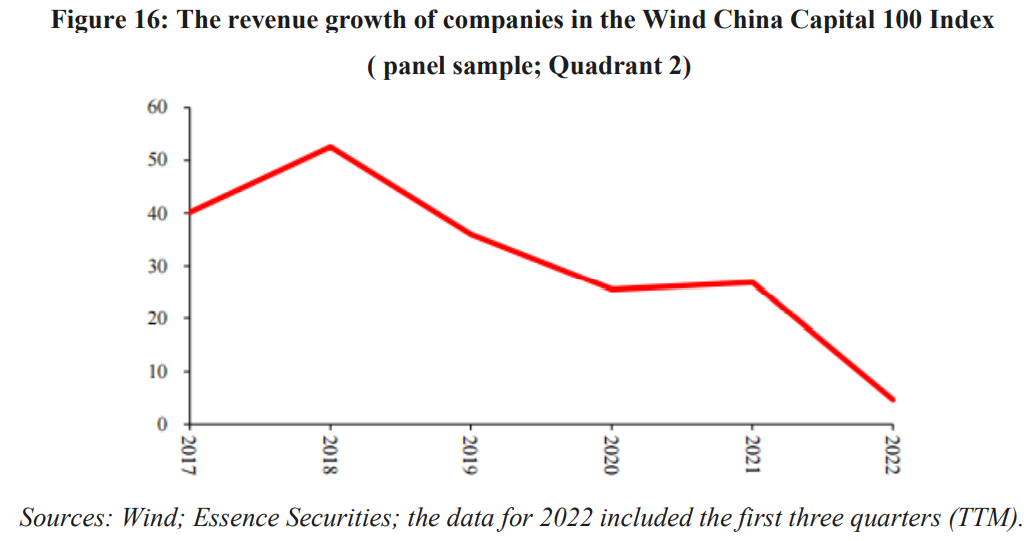
As demonstrated in Figure 16, since 2022, the revenue growth of companies included in the Wind China Capital 100 Index has plummeted from over 25% to lower than 5%.
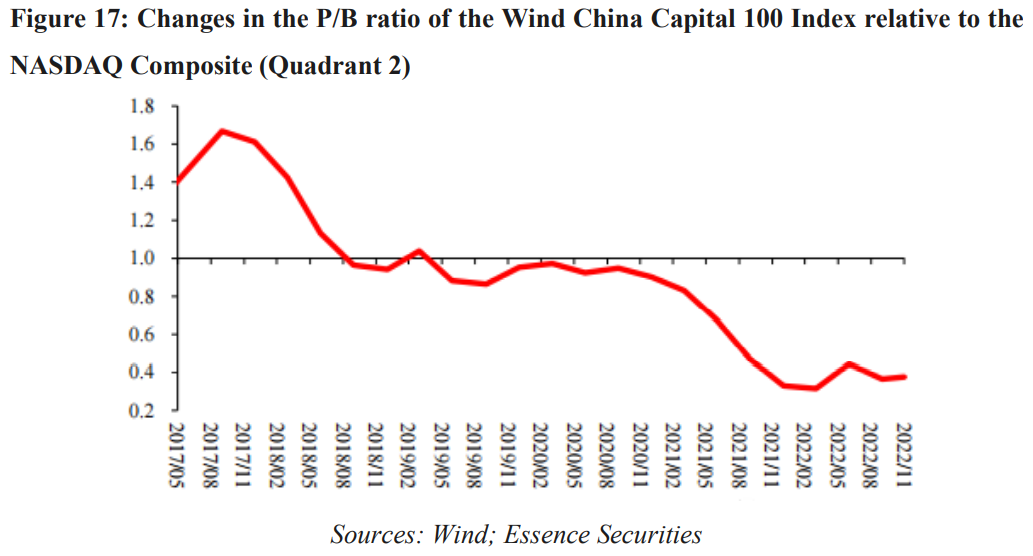
Based on valuation, the P/B ratio of the Wind China Capital 100 Index relative to the NASDAQ Composite in Figure 17 demonstrates that the former had a comparative advantage in valuation before 2018. With the growth rate slowing down, the valuation of the Wind China Capital 100 Index was about the same as the NASDAQ Composite. Since 2021, Wind China Capital 100 Index has been at a growing disadvantage in valuation relative to NASDAQ Composite.
Although a thorough legal framework has not been established to regulate the Internet industry, it seems that stronger regulation will be the trend.
(3) Household Appliance (Quadrant 3)
In fact, many industries belong to the third quadrant, yet household appliance is a more typical case with no relevance to security and low growth in general. Figure 18 illustrates the price index of the industry relative to the Wind All China Index.

Within the household appliance industry, as shown in Figures 19 and 20, the valuation of SOEs does not diverge significantly compared with non-SOEs. Whether from the perspective of the P/E or P/B ratio, the relative valuation is rather stable, which is in sharp contrast with the situation within the military and defense industry.


This suggests that from the standpoint of market pricing, Quadrant 3 barely involves security concerns. The competitive environment in this area is relatively transparent and stable.
(4) Power equipment (Quadrant 1)
The reason why the power equipment sector was mentioned in this part is that I’m not sure to what extent power equipment is relevant to security concerns. For some analysts at home and abroad, they doubted, worried, or believed that the power equipment industry poses a security concern. In theory, producers can install a backdoor in the power equipment. If two nations were in confrontation, either side could open the backdoor and paralyze the power system of the other side, which realizes the effect of defeating the enemy without a fight. In this sense, power equipment is the infrastructure of great importance to national security, thereby posing security concerns.
Based on the market pricing of the power equipment industry, as shown in Figure 21, the price index of the industry relative to the Wind All China Index has demonstrated considerable return, which might imply the rapid growth of the industry.
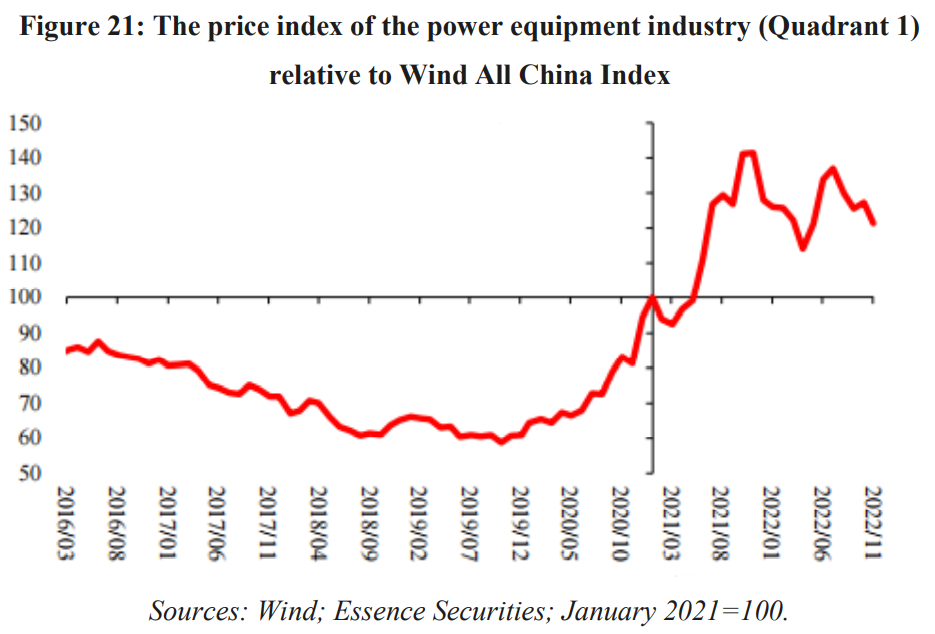
Within the power equipment industry, as illustrated in Figures 22 and 23, the valuation of SOEs relative to non-SOEs has started to rise since 2021. This is similar to the case of the military and defense industry, and therefore we put the industry in the first quadrant. Yet it is open to debate how the government and market think of the industry and whether it is highly related to security concerns.


(5) New energy vehicle (Quadrant 4)
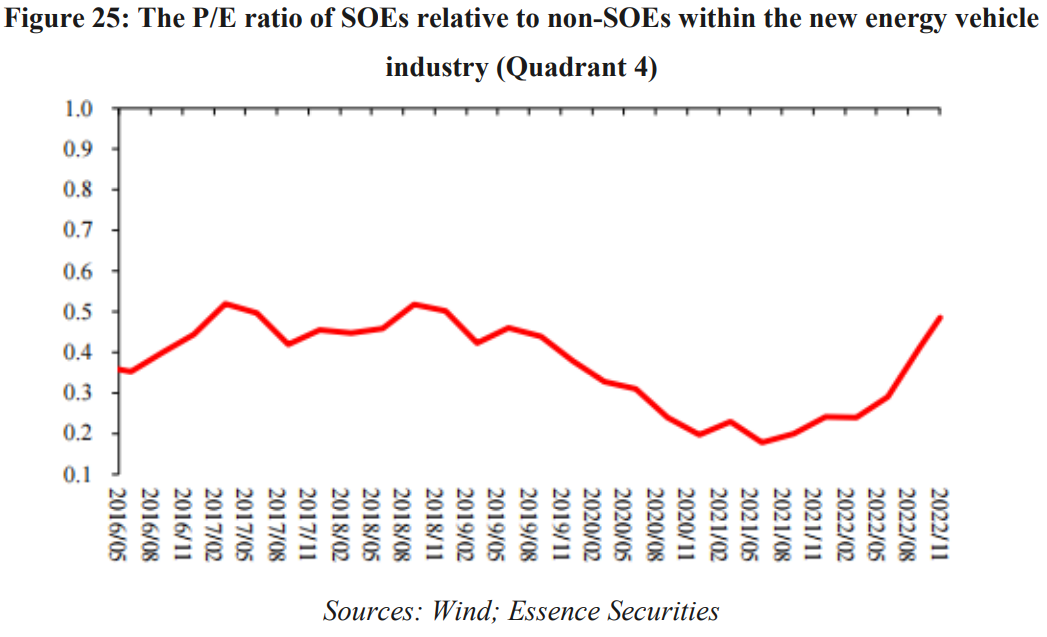
The new energy vehicle (NEV) industry is a typical case in the fourth quadrant. It is a private-led industry with high uncertainty and high growth. Meanwhile, the industry also needs global rules to manage subsidies and industrial policies of different countries in order to create a level playing field.
Based on the market pricing as shown in Figure 24, the price index of NEV industry compared with Wind All China Index has increased sharply since late 2020.
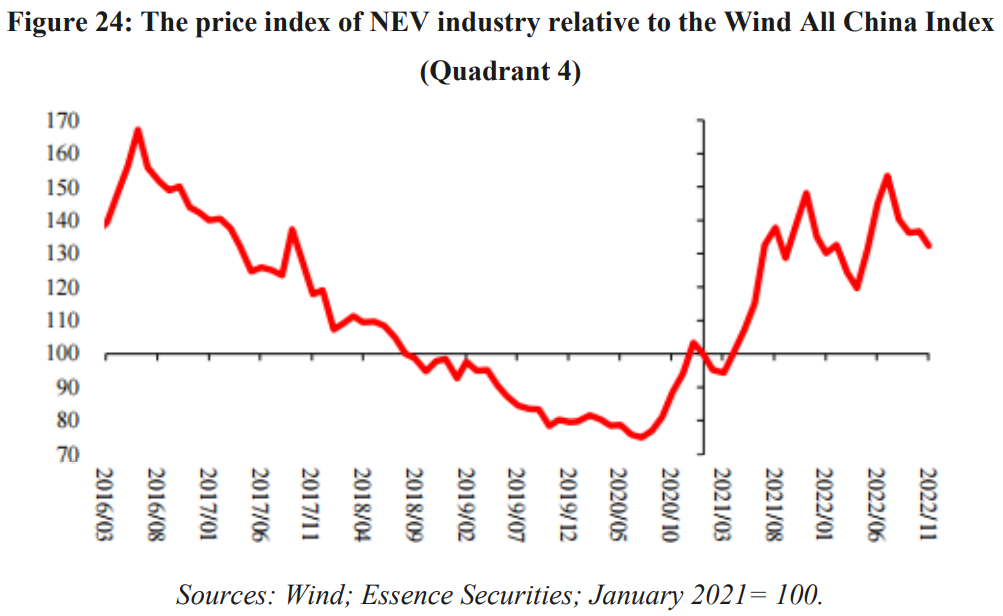
From the perspective of valuation within the industry, the P/E ratio of SOEs relative to non-SOEs seems to have risen over the last six months, but the valuation advantage of SOEs is not prominent when we compare the P/B ratio. In fact, while the industry gained much more returns than the general market from 2020 to 2021, the comparative valuation disadvantage of SOEs within the industry even widened.

(6) Specialized and new industry (Quadrant 4)
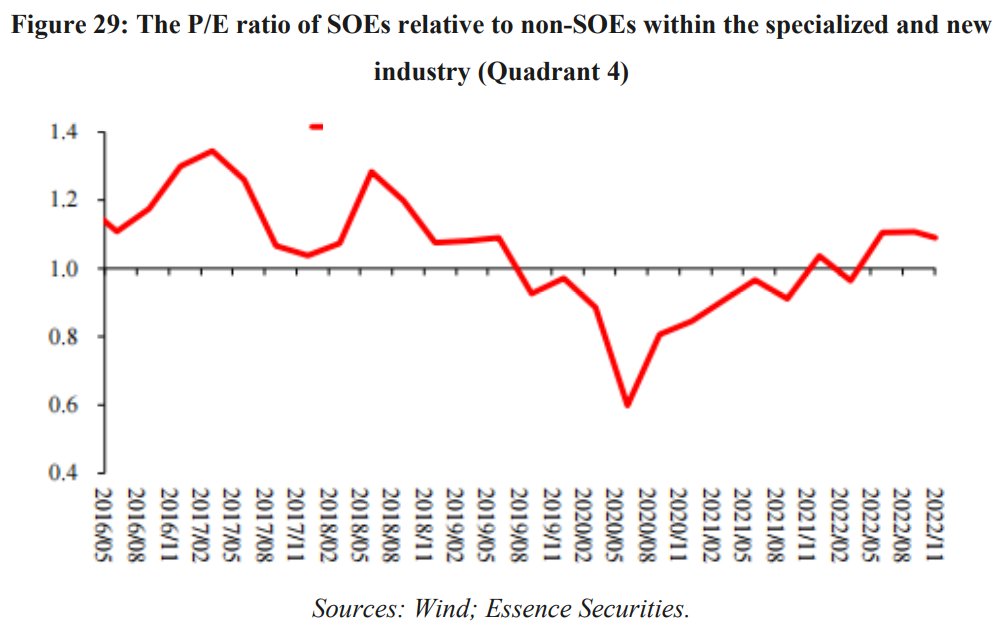
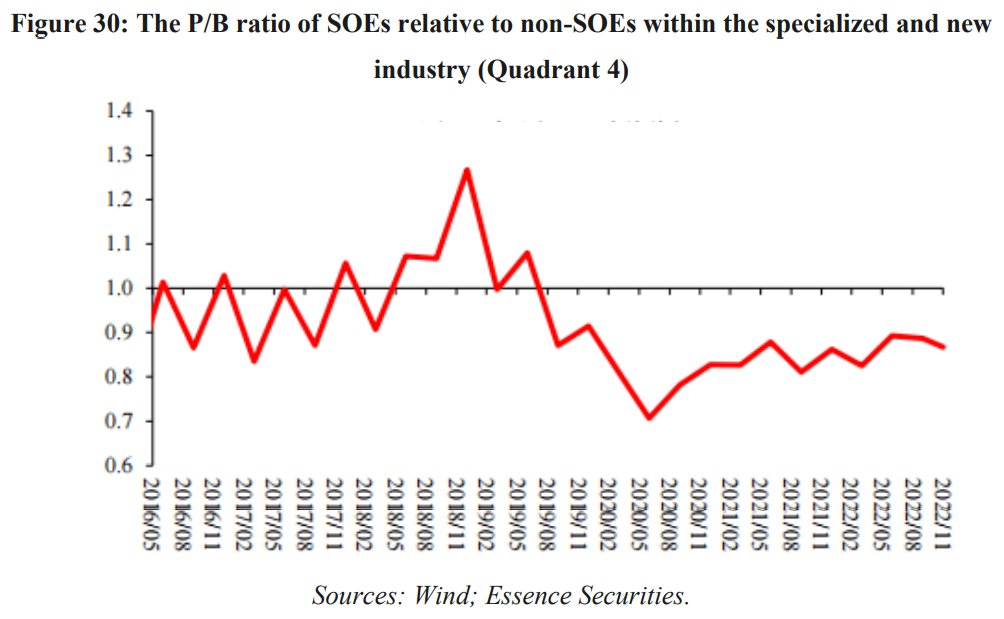
Given that security concern involves many specific segments with great uncertainty in technological development, it is impractical to let SOEs completely dominate all these segments. Therefore, in certain areas, SOEs mainly play the guiding role, whereas private enterprises might be the leading players in many niche sectors. The “specialized and new” industry might be a typical case. With a focus on addressing the weaknesses of the manufacturing industry, the industry is characterized by great technology uncertainty, thorough industry segmentation, wide coverage of areas, and high yet uncertain growth potential.

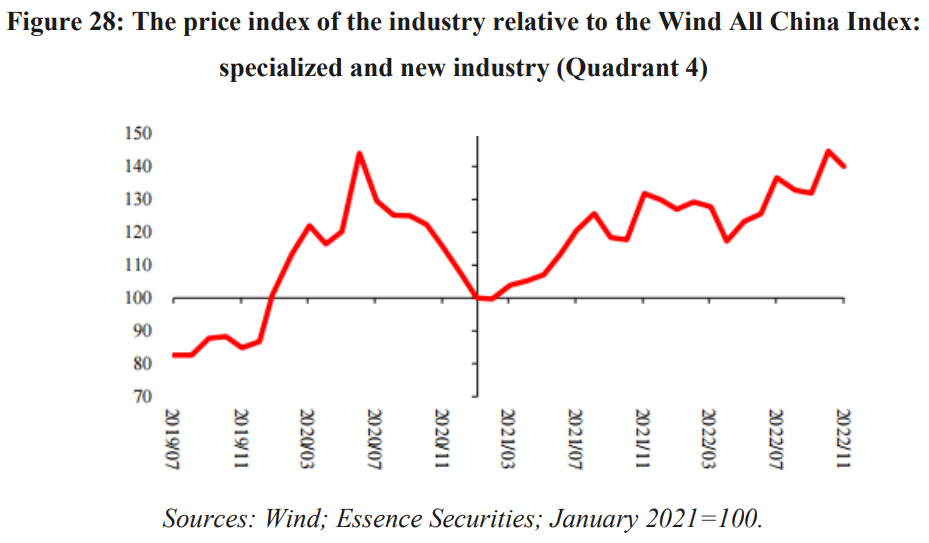
From the perspective of valuation, as illustrated in Figures 29 and 30, SOEs does not have a much larger valuation edge compared with non-SOEs within the industry in terms of P/E ratio, while the change at the P/E level might have something to do with imbalanced profits.
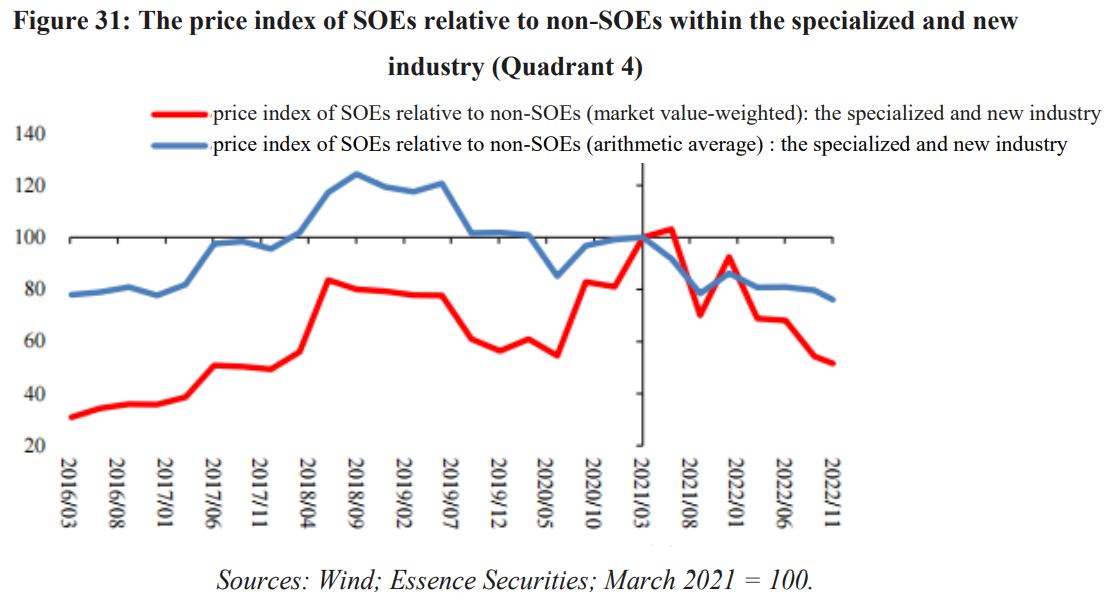
As demonstrated in Figure 31, within the industry, SOEs do not show a greater edge in stock prices compared with non-SOEs, and their edge has even weakened marginally since 2021.
But, of course, the position of the industry is open to debate. Given the importance of the specialized and new industries to securing independence and controllability of the industrial and supply chains, some may argue that the industry involves security concerns and thus fits better in the first quadrant.
This is the speech made by the author at the annual strategy conference of Essence Securities on December 13, 2022. It is translated by CF40 and has not been subject to the review of the author himself. The views expressed herewith are the author’s own and do not represent those of CF40 or other organizations.