
Abstract: The article examines the reasons for the sharp increase in Chinese households’ deposits in the first three quarters of 2022 based on the analysis of the capital flow statement. It also puts forward countermeasures.
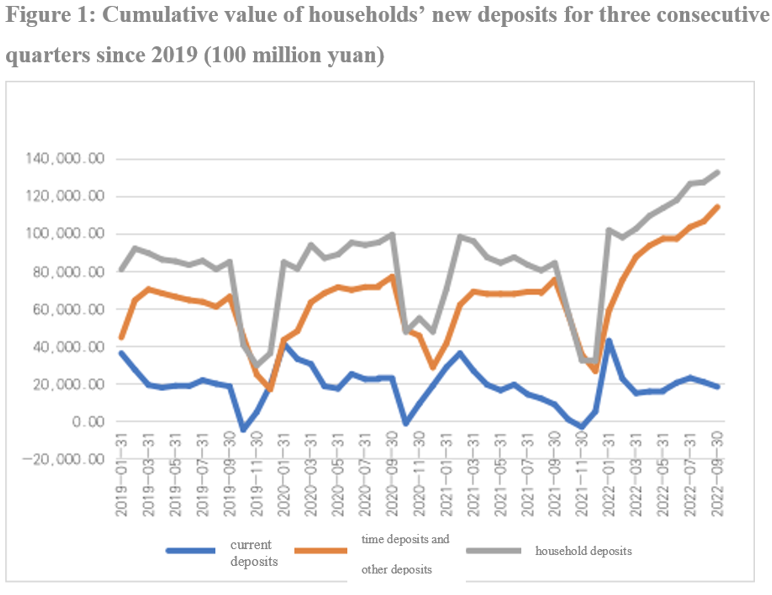
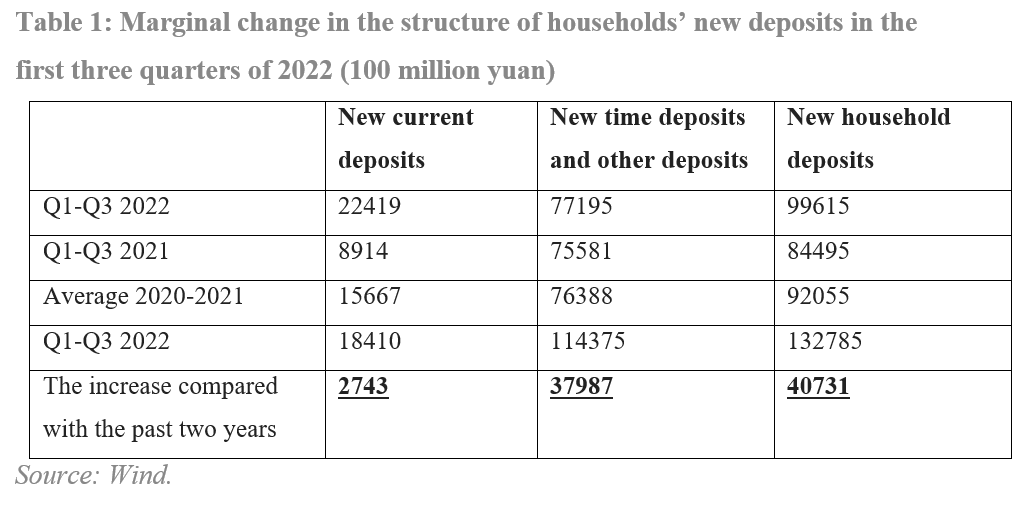
In the first three quarters of 2022, there has been a substantial increase in China's household sector deposits, which has aroused market attention and discussion. From January to September 2022, China's household deposits increased by 13.28 trillion yuan compared with the end of 2021, of which short-term deposits increased by 1.84 trillion yuan, and time deposits and other deposits increased by 11.44 trillion yuan. As shown in Figure 1, the growth of household deposits in the first three quarters of 2022 significantly exceeded the average level in the first three quarters of 2020 and 2021, and the main increase came from time deposits and other deposits. The increase in demand deposits was similar to the past three years. Table 1 shows the structural distribution of the marginal change of households’ new deposits. In other words, the question is why there is a 3.8 trillion yuan increase in household deposits and other deposits.
I. THE DECLINE IN CONSUMPTION CAN, AT MOST, EXPLAIN 1 TRILLION YUAN OF THE CHANGES IN NEW HOUSEHOLD DEPOSITS
In the case of For stable income, households need to increase savings by reducing consumption. The change in savings and the propensity to consume are two sides of a coin. We first examine the changes in propensity to consume and the resulting changes in consumption.
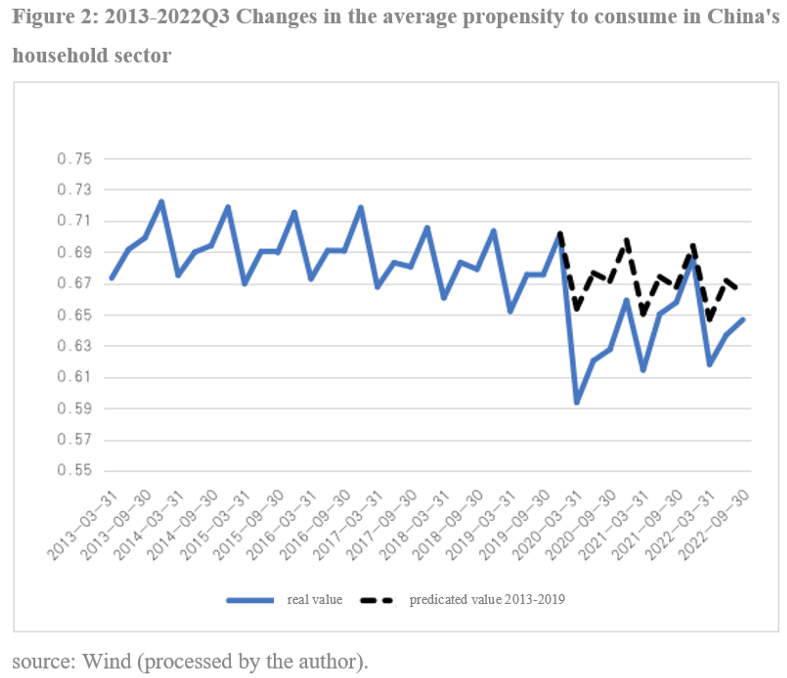
Since the pandemic, the average propensity to consume in China's household sector has experienced three stages of "decline-recovery-decline". We calculate the average willingness to consume using "per capita consumption expenditure /per capita disposable income". As shown in Figure 2, from 2013 to 2019, China’s average willingness to consume saw seasonal changes, with an overall downward trend. The propensity to consume declined rapidly at the beginning of the pandemic in 2020, but then, with the rapid recovery of the economy, it rebounded in Q4 2021 to the pre-pandemic level. At the beginning of 2022, with surges of new cases, the propensity to consume fell again further away from the pre-pandemic level (see Table 2).
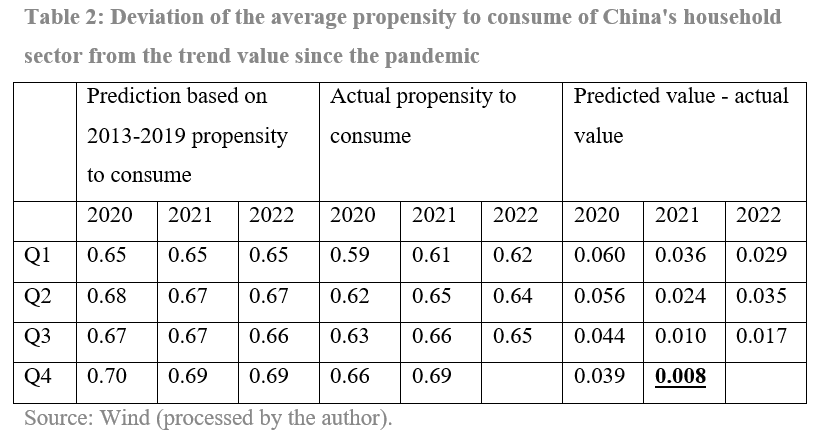
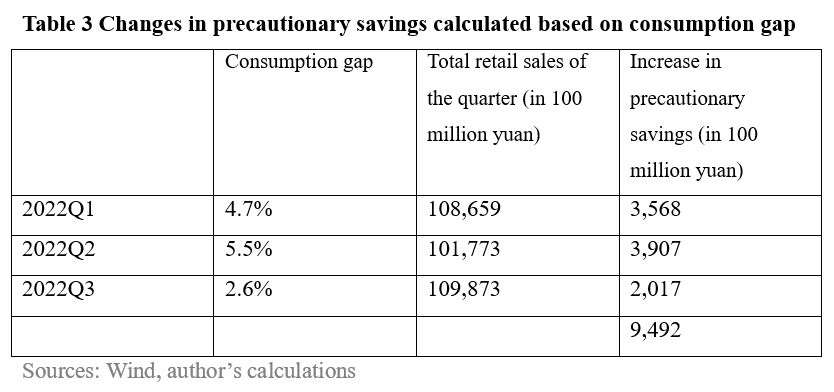
The results show that the consumption reduction caused by the decline in propensity to consume is about 949.2 billion yuan. The calculation logic:
(1) Divide the propensity to consume by the trend gap to obtain the consumption gap corresponding to the decline of the propensity to consume.
(2) From 2017 to 2021, the proportion of households’ final consumption in China's GDP final consumption expenditure was stable at 70%. Multiply the total social retail sales of the quarter by 70% to obtain the household consumption part of the total social retail sales in the quarter.
(3) Multiply the household consumption gap by the total social retail sales corresponding to the household sector in the current quarter to obtain the reduction in consumption due to the decline in propensity to consume.
There are two mainstream understandings of the decreasing propensity to consume.
The first view is that the pandemic and related factors have prevented people from spending and that the increase in residents' savings was, in fact, passive savings, or what some call excess savings. This view assumes that there is no systematic change in residents' actual propensity to consume. In other words, if the dampening effect of the pandemic and related factors on consumption diminishes, this part of savings will be converted into consumption relatively smoothly. For example, the US household sector had accumulated a large amount of excess savings during the pandemic, which did turn into consumption after the fiscal stimulus was withdrawn and propped up the high level of US consumer spending for a considerable period.
The second view is that the rising demand for precautionary savings has caused the significant increase in resident deposits. What causes the former is the change in the long-term income expectations of the household sector in the context of increased economic uncertainties and a growing need to maintain a higher level of savings to cope with uncertainties.
Both views are consistent with the lasting depressing state of household consumption since the pandemic. However, the first view needs more evidence from the income side. Both passive and excess savings should come from an over-than-expected increase in income. Income growth beyond expectations in the household sector does not exist. From an accounting perspective, surpluses and deficits should add up to zero, and an excess surplus in one sector must correspond to an excessive deficit in others. Back to the US example, the root cause of the excess savings in the household sector during the pandemic corresponded to the deficit of the US government sector, which directly increased the disposable income of the household sector using subsidies, and formed passive savings or excess savings as well. Moreover, the performance of the consumption structure of the household sector in China does not support this explanation, either. Comparatively speaking, the second view is more consistent with the economic logic and reality than the first one, i.e., the motive of precautionary saving of the household sector rose, which consequently led to the reduction of consumption and conversion of the surplus into savings.
II. THE DEPOSIT INCREASE IN THE HOUSEHOLD SECTOR MAINLY COMES FROM THE DECREASE IN HOME PURCHASES, REFLECTING THE CHANGE IN THE LOGIC OF RESIDENTS' ASSET ALLOCATION
As noted earlier, precautionary savings can only explain less than $1 trillion of the change in the new deposits in the household sector. An implicit assumption is that all new precautionary savings were converted into time deposits, not any other financial assets. Another more direct and apparent reason for the increase in deposits is the decrease in residents' spending on home purchasing. For example, from January to September 2022, home sales in China were 3.5 trillion yuan less than in the same period last year. The figure is roughly equal to the new deposits by residents. However, home sales include loans, so the contribution of reduced home purchase spending was not actually that much.
As can be seen, both the increase in precautionary savings and the decline in spending on house purchases encounter the same problem in explaining the changes in households’ new deposits, as they only take into account household spending while neglecting cash inflow into the household sector and structural classification.
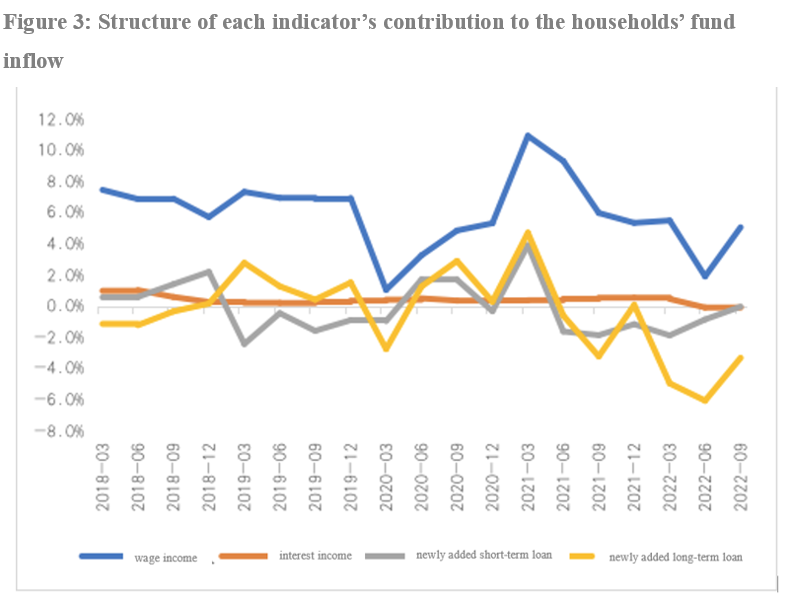
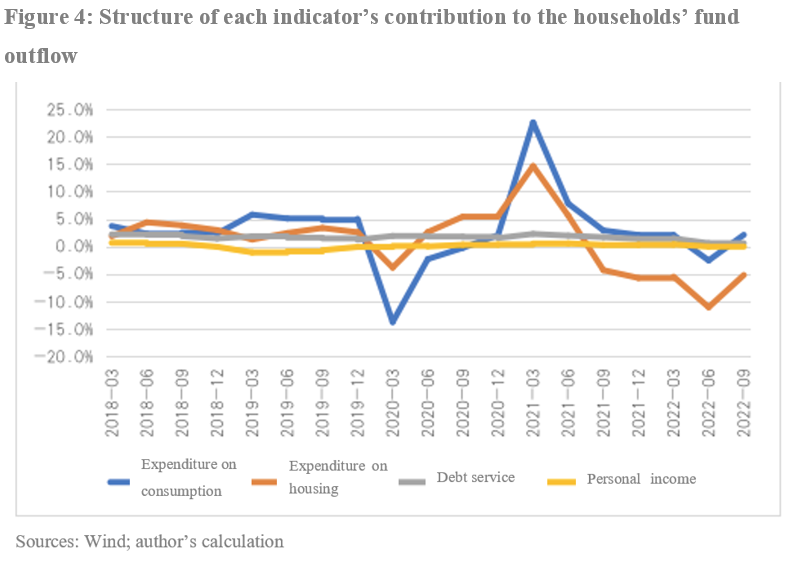
Given that, this paper compiled a quarterly flow-of-funds table of the household sector, including four indicators concerning the inflow and outflow of funds, respectively. These indicators basically cover all the household sector’s important items (see Table 4). Although the table is only a preliminary estimate and may lack precision statistically, the method can help us observe the latest structural changes and trends in the household sector under a unified framework.

As shown in Figures 3 and 4, over the last year, from the inflow side, wage income has contributed steadily to the fund inflow of the household sector with a slight decline, while loan has made the most significant impact on the fund inflow, with the newly-added loan continuing to contract. From the outflow side, consumption has contributed nearly zero to the outflow growth, while spending on house purchases has greatly influenced the outflow. Meanwhile, fund outflow in the household sector is falling significantly faster than the inflow, leading to a substantially higher surplus.
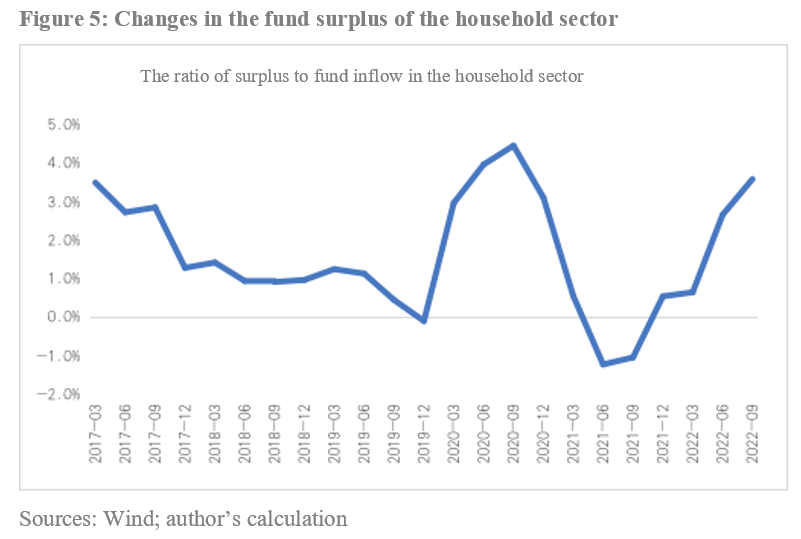
Since the Covid-19 pandemic, changes in the fund surplus of the household sector (fund surplus=inflow-outflow) can be divided into three stages, as shown in Figure 5. The first stage is the the pandemic’s initial phase, during which fund surplus rose rapidly amid the first wave of pandemic-induced shock to the macro economy. The second stage is from late 2020 to the third quarter of 2021, during which the ratio of fund surplus to inflow in the household sector declined sharply and even turned negative in the second and third quarters of 2021, which suggests a rapid increase in household spending. The third stage starts from the 4th quarter of 2021 to now, when the surplus has climbed rapidly again.
The changes in the fund surplus of the household sector can be reckoned based on the flow-of-funds data. In the first three quarters of 2022, the cash flow statement of the household sector registered a 4.6 trillion yuan of surplus, with an increase of 5.6 trillion yuan than the same period of last year that recorded a 1.1 trillion yuan deficit. From the changes in household financial assets, money market funds held by the household sector increased by 409.7 billion yuan compared with late 2021. After adjusting for valuation effects, stocks and non-monetary funds held by households contracted by 30.7 billion yuan. Although data on wealth management products directly held by residents are not available, according to the data released by the Banking Wealth Management Registration and Custody Center, the scale of China's wealth management products was 29.15 trillion yuan by the end of June 2022, with an increase of 150 billion yuan compared to 29 trillion yuan at the beginning of 2022. Adding up the three items, the net increase in non-deposit financial assets of households in the first half of 2022 is 529 billion yuan. In other words, the household sector accumulated a large surplus in the first three quarters of this year, and most of it was converted into deposits, especially time deposits.
It should be noted that there is no causality between reduced household expenditure on home purchases and increased deposits. Both are a result of the households’ changing asset portfolios. Real estate has long been a major target in the portfolio of Chinese households, most notably because of sustained and predictable increase in their valuation. Once such an expectation is broken, real estate would be less attractive as an asset allocation option for households.
We could explain this further from a return on assets point of view. Based on the house price-to-rental ratio in China, the return on house rental is around 1.5-2%; in many first- and second-tier cities, the number is below 1.5%. In comparison, China’s benchmark interest rate on 1-year fixed deposit is 1.5%; those of commercial banks are about 15-25 basis points higher, and the rates on fixed deposits with longer maturities are even higher. Combined with other risk factors, including liquidity premium and asset valuation changes, real estate has become much less attractive than fixed deposits for asset allocation. In short, households never struggle with a choice between current and fixed deposits; the observed increase in fixed deposits is the transfer of incremental household assets from real estate to fixed deposits.
III. DEPOSIT RATE SHOULD BE MORE FLEXIBLE
The above analysis indicates that the surge in Chinese household deposits results from reduced house purchases and increased precautionary savings, both showing that households are striving for a more favorable account balance. From an asset allocation point of view, while building up precautionary savings, households are transferring more incremental assets from real estates to fixed deposits, a proactive asset portfolio adjustment. The transfer might be a “stress response” of the household sector to the real estate turmoil, but there is no reason to expect this process to come to a sudden pause until we see a substantive reverse in expectations.
Higher fixed deposits from households may seem favorable for banks because it could stabilize their liability, improve their liquidity and reduce their leverage. However, it also increases their longer-term liability. Chinese household deposits have an average maturity of 2-3 years, with a much higher interest rate than interbank funds with shorter durations. In this sense, the massive rate cuts on fixed deposits in September by major banks in China have relieved their liability pressure.
On the other hand, the banking sector now faces mounting lending pressure amid sluggish household and business borrowing. The restrictions from both the loan and the deposit ends have made banks more reliant on the interbank and bond market to adjust their non-deposit liabilities and non-loan assets.
Given this, consumption increase’s impact on incremental household deposit may still be at the less-than-1-trillion-yuan magnitude. Until we see substantive improvement in households’ expectation of the real estate market, their surplus income will continue to be placed in deposits, and banks will still find it hard to increase household borrowing. The key to the problem is that banks’ balance sheet expansion is restricted by their interest rate structure; even if they can expand in the short run, it will impair their ability to support the real economy and sustainability.
Thus, Chinese banks need to adjust the benchmark rate structure and make the deposit rate more flexible in reflecting the actual market condition, in order to relieve the asset-liability dilemma. Policy should focus on stabilizing households’ expectations for the real estate market, while providing them with more inclusive financial products, especially equity products, so that they can allocate their assets in a more reasonable and sustainable manner.
The article was first published in CF40's WeChat Blog on November 13, 2022. It is translated by CF40 and has not been reviewed by the author. The views expressed herewith are the author's own and do not represent those of CF40 or other organizations.