
Abstract: This article probes into the main forces driving China’s export expansion since 2020 and offers a clue as to the trend going forward. The authors highlight three stories about China’s export:1) the share effect played the biggest role bolstering China’s export growth in 2020; 2) external demand expansion drove China’s export boom in 2021, with the share effect declining coupled by rising structural differentiation; 3) under greater strain from falling external demand, China’s export could see intensified structural divergence.
There are mainly two ways for an economy to increase export: external demand expansion, and improving competitiveness. The former manifests the aggregate effect: all exporters receive a boost when global demand rises; the latter shows the structural effect: more competitive products tend to have a greater share of the global market.
Sometimes, the two effects work simultaneously; but other times, they offset each other. We decompose export growth into demand effect-driven growth and share effect-based growth.
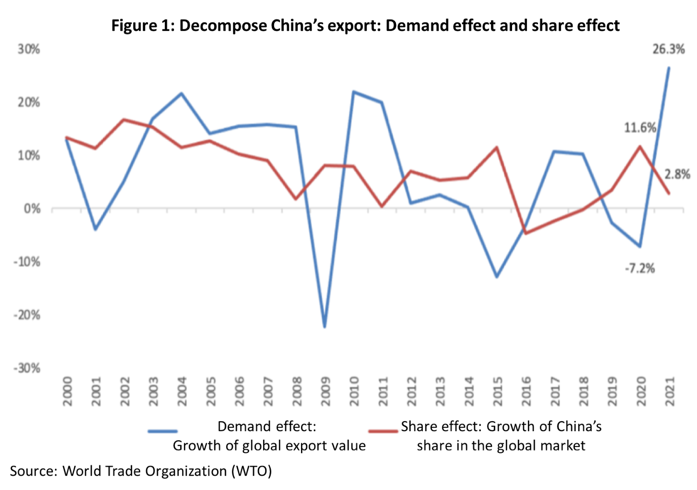
As Figure 1 indicates, during 2002-2008 when global economy was on a continuous upward ride, China had its share of benefits from globalization: booming external demand and rising share both played a part sustaining double-digits growth of China’s exports.
But in 2009, the second year into the global financial crisis that plunged the world economy into recession, China’s export tumbled 16%, the culprit being the decreasing external demand as a result of global trade contraction, instead of export substitution by other economies. Thus, it is the balance between the demand effect and the share effect that determines export growth.
China’s export has been much more resilient than expected since the Covid outbreak, playing an important role sustaining the country’s economic recovery. It recorded two-digit year-on-year growth for many of the months over the past two years, but the stories behind have been different. Finding out the core factor underlying these different stories can help build a deeper understanding of China’s strong export and offer a clue as to the trend going forward amid global demand downturn.
I. 2020: CHINA OBTAINED A GREATER SHARE OF THE GLOBAL MARKET BASED ON ITS SOUND SUPPLY CHAIN SYSTEM
The share effect was the major force driving China’s export boom in 2020.With global trade battered by the Covid-19 pandemic, global commodity export value grew by -7.2% that year; but owing to the share effect, China scored a year-on-year growth of export of 3.4%. WTO data shows that in 2020, China accounted for 14.7% of global export, 1.5 percentage points higher than in 2019.
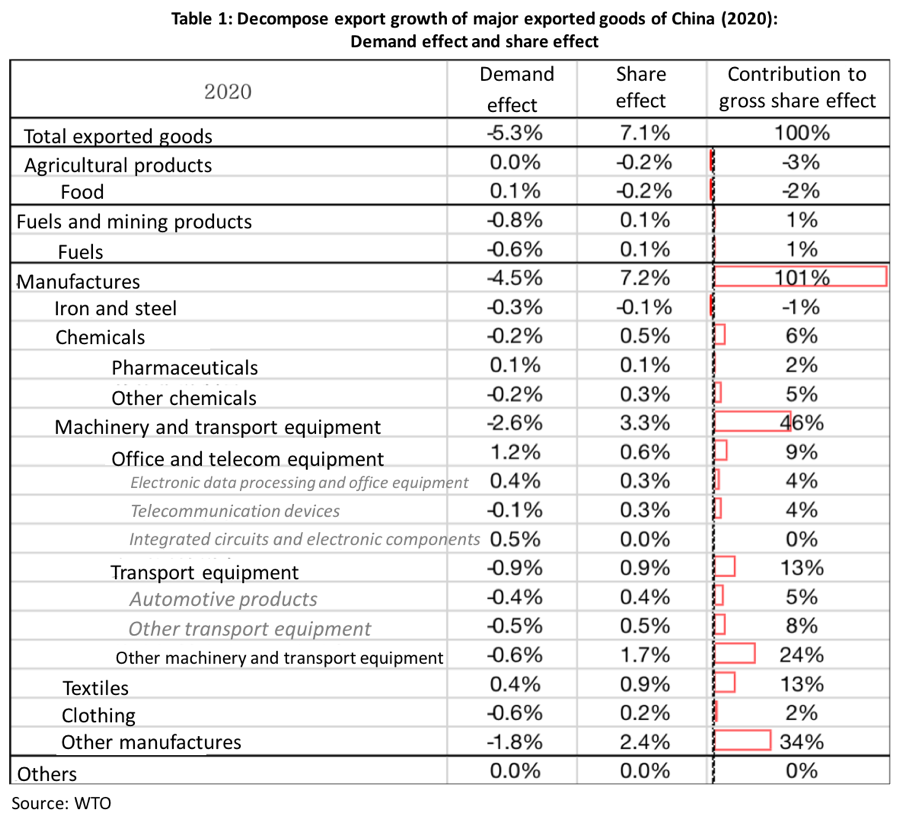
Different from technology-driven share growth, China had a larger portion of the global market in 2020 because of its sound domestic supply chain system. According to Standard International Trade Classification (SITC), we have decomposed the growth of export of various products into demand effect-driven growth and share effect-based growth, and calculated the demand effect and the share effect on China’s aggregate export based on the proportion of these products (Table 1).This method could reveal a clearer picture about the impact of structural changes on China’s export. Result shows that there has been significant share effect in almost all exporting industries.
To be specific, in 2020, China’s share of global agricultural product market edged down slightly, while its share of global fuel and minerals moved up a bit. But neither made a big difference as neither was among China’s major exporting goods. Manufacturing goods had the major share, and most manufacturing products had experienced negative demand effect and positive share effect, indicating that the expansion in the export of these products was based on substitution. More importantly, the positive share effect was observed not only in technology- and capital-intensive sectors, but also in labor-intensive industries. For example, textiles and garments contributed to 1% of China’s total share in global export and 1.1% to gross share effect which even exceeded the two much larger categories, office supplies and communication devices which contributed 0.6% combined. This is very different from traditional share increase driven by technological development which is observed only in technology-intensive products.
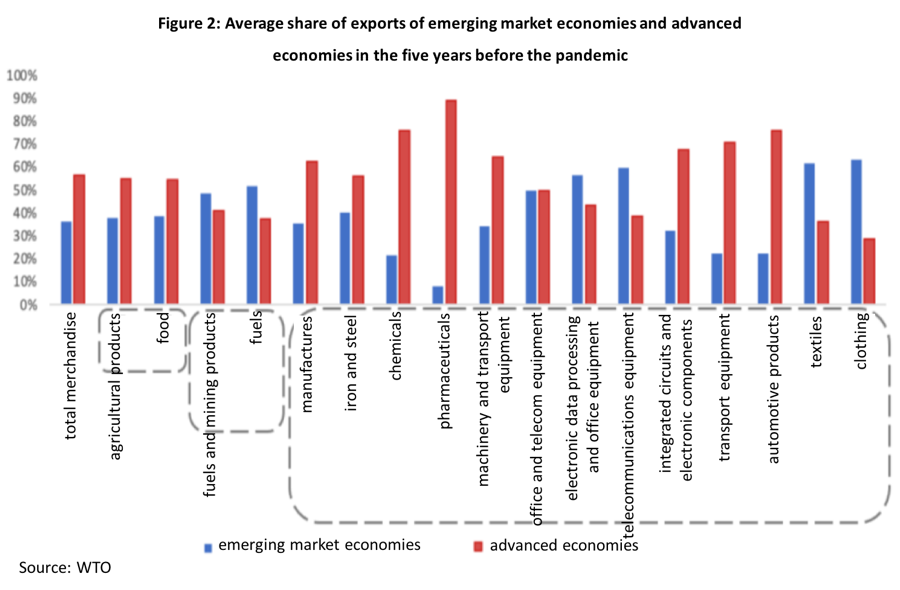
Let’s look at the changes in other countries’ share of global exports of these products in 2020. We have selected a total of 65 economies with complete data and a share of 0.1% or more in global total export value that account for over 94% of global total export value combined. We first divide them into emerging market economies and developed economies. As shown in Figure 2, during the five years before Covid (2014-2019), emerging market economies had a larger share in global export of fuel and minerals, primary electronic data processing devices and office supplies, and textiles and garments; while developed economies had the lion’s share in global export of most of the manufacturing goods.
We compared the composition of global export of these goods in 2020 with that before the pandemic, and discovered that the share of both emerging market economies (China excluded) and developed economies in textile export had slumped, while developed economies’ share in total export of some of the manufacturing goods also fell.
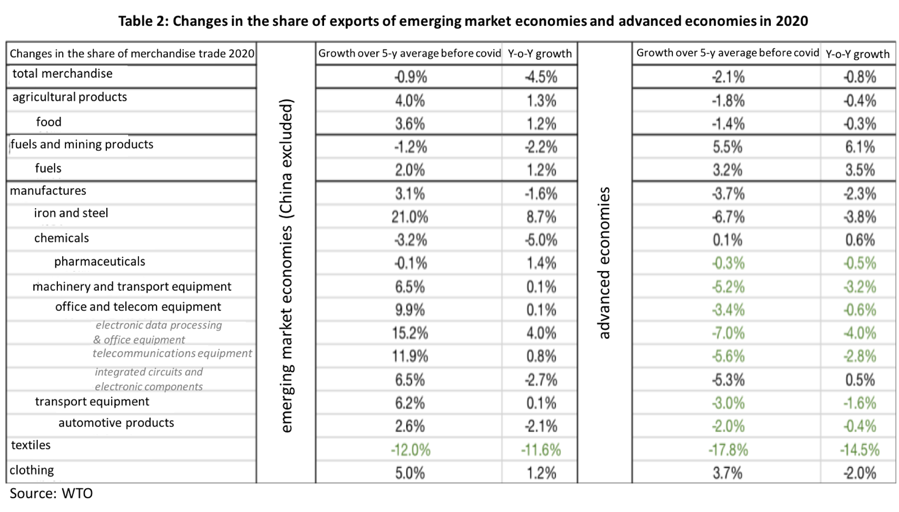
To answer the question which countries’ export was replaced by China, we adopt the same method to process the export data of 65 economies and work out the changes in each country’s share of export in the early stage of the pandemic. For countries A and B that export the same product, only when the following three conditions are met simultaneously, we say that country A’s product may have replaced the export share of country B. These necessary but insufficient conditions include: (1) the export of the mentioned product from country B has been considerable and stable. If export of the product from country B only accounts for a small share, there may be large changes due to the base effect and a high probability of randomness. (2) Country A's share of exports of the product rose significantly, while country B's share decreased accordingly. (3) The terms of trade of country A are more favorable than those of country B. For example, country A contained the spread of the pandemic more quickly than country B.
In summary, the products of China have replaced the export share of other economies in 2020 mainly in the fields of pharmaceuticals, transport equipment and textiles.
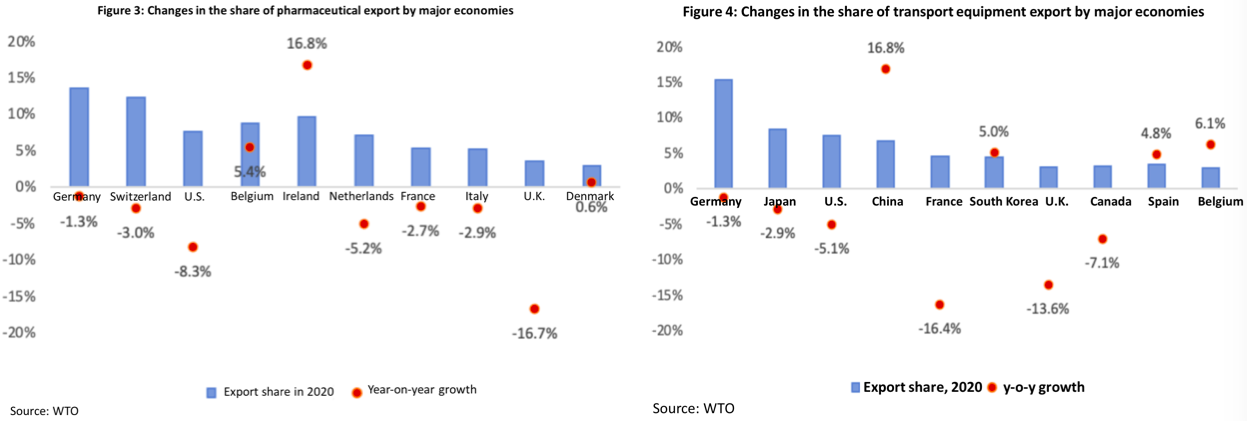
For pharmaceuticals, among the top 10 exporting economies, the UK (-16.7%) and the US (-8.3%) saw their share of export of pharmaceutical products drop to their lowest levels since 2010. Switzerland (-3.0%), France (-2.7%) and Germany (-1.3%) also saw their share of export fall slightly. These countries have all been hit bitterly by the pandemic. While domestic demand in these countries has increased sharply, the production capacity shrunk, resulting in a gap between production and demand for medical supplies.
In terms of transport equipment, among the top ten exporting economies, Germany, Japan and France all saw their share of export of transport equipment drop to their lowest levels since 2010, with France (-16.4%) and the UK (-13.6%) recording a larger decline.
Advanced manufacturing, represented by automobiles and transport equipment, is highly dependent on upstream and downstream supply chains, international division of labor, and logistics. Even if the local pandemic is controllable, manufacturing can also be affected by the pandemic in other countries, which can lead the supply chain to the risk of a standstill.
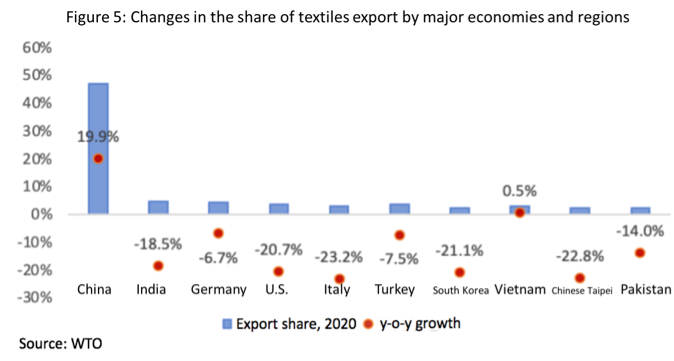
In terms of textiles, the top ten exporting economies, except China, all experienced a large contraction of export. Among them, the export shares of Italy, South Korea, the United States and Japan dropped by more than 20%, while the share of China’s export of textiles in the global market significantly increased by nearly 20%. This is because, for one thing, the production capacity of emerging market economies has dropped sharply due to the impact of the pandemic, and some orders thus have shifted back to China; for another, the growing demand of masks and other pandemic prevention materials has driven China’s textile exports.
To sum up, here is the first story about China's exports: at the beginning of the pandemic in 2020, China effectively controlled its spread and restored the production order in the first place, and then took over export shares of the economies that were severely hit by the pandemic with its resilient supply chains at home. This take-over occurred not only in high-tech and capital-intensive industries, but also in labor-intensive industries; China not only replaced some of the exports of developed countries, but also that of emerging economies. Therefore, at a time when the global supply capacity was seriously damaged, China took the lead in resuming production, giving full play to its manufacturing foundation and competitive advantages formed over a long period of time, and finally achieving positive growth in trade in goods in 2020.
II. 2021: SYNCHRONIZED GLOBAL RECOVERY DRIVES EXTERNAL DEMAND EXPANSION, AND SHARE EFFECT SHOWS STRUCTURAL DIFFERENTIATION
The expansion of external demand is the most important factor driving the rapid growth of China's exports in 2021, which can explain more than 80% of the annual export growth rate. In 2021, the global economy gradually got rid of the severe shock in the early stage of the pandemic and began to recover simultaneously, so China’s external demand improved significantly. In that year, the value of global exports of goods increased by 26.3% year on year, and the geometric average growth for the two years was 8.2%. Despite the base effect, it is mainly because the global economy has bottomed out. Structurally, both emerging economies and developed economies saw substantial growth in their exports of goods, and China was no exception. In 2021, the value of China’s exports increased by 29.9%, and the share of exports in the world’s total reached 15.1%, hitting a new high both in export scale and share.
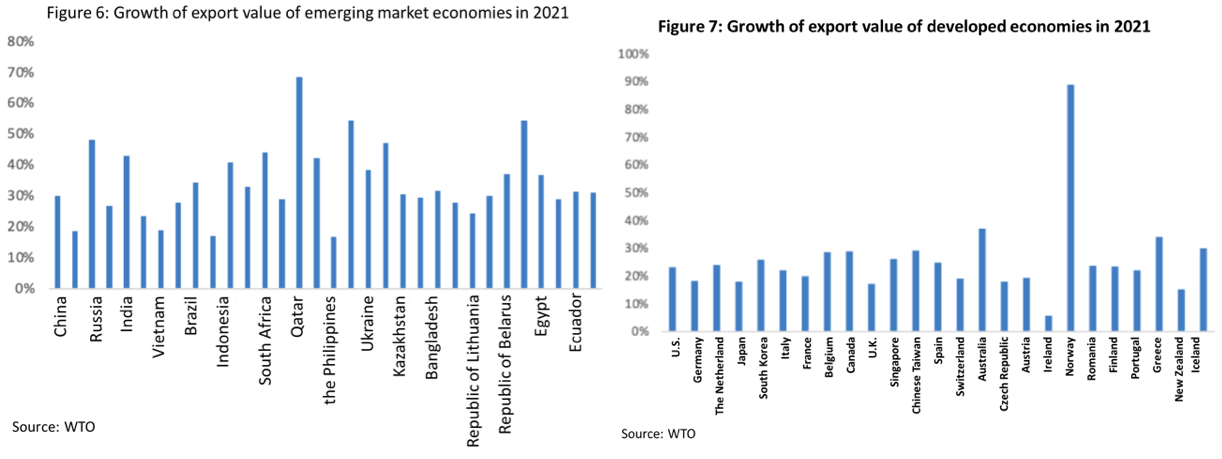
While the expansion of external demand drives China's export growth, the share effect on China's exports remains positive, albeit greatly reduced. With the gradual restoration of production capacity overseas and the manifestation of macroeconomic policy stimulation on demand, the supply-demand gap faced by most countries has begun to decrease. Nonetheless, with a robust domestic production and supply system, China's proportion of global exports continued to rise in 2021, with the share effect adding 2.8 percentage points to China's exports.
Meanwhile, the share effect in 2021 revealed a strong structural differentiation, with the export share of some merchandise declining while the export share of others increased. We sample 64 major economies and use their merchandise export data to depict global merchandise exports. These sample countries' total exports accounted for approximately 85% of the world's total.
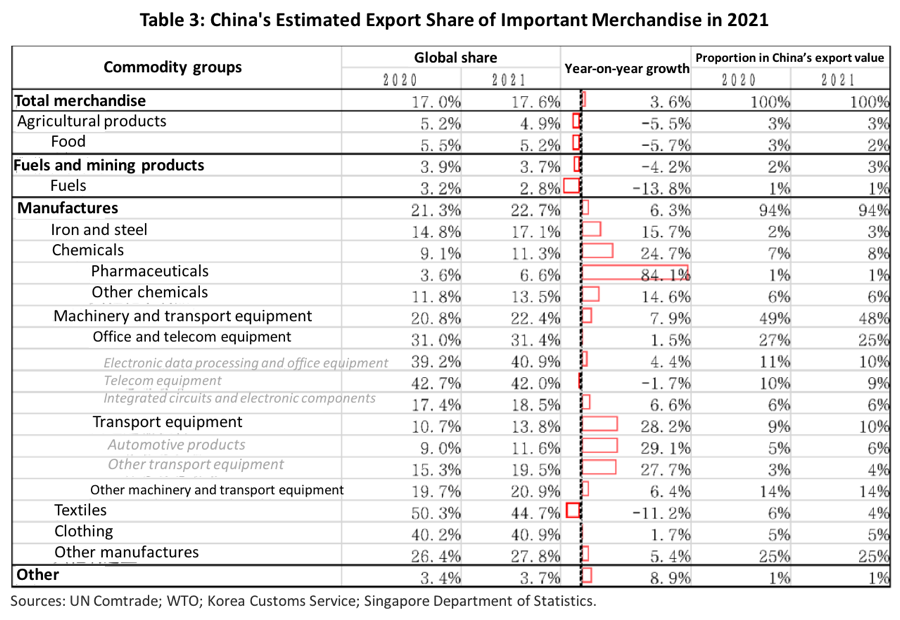
According to the estimations, China's proportion of agricultural products, fuel and mineral items, and some manufactured products has decreased. As a result of the international pandemic control and supply chain repair, China's export substitution role has weakened. The textile business is a good example. The textile orders that flooded China in the early stages of the pandemic have now migrated out, resulting in an 11.2% fall in China's textile export share in 2021, while India, Pakistan, and Turkey's proportions have begun to climb, all with an increase of over 20%.
Merchandise such as transport equipment and chemicals, on the other hand, have a bigger share effect than in 2020. Chemicals (+24.7%) and transport equipment (+28.2%) climbed strongly in the manufacturing industry. Automation products, particularly automobiles (+29.1%), not only maintained the early-stage growth momentum but also opened up the foreign market with the unique benefits given by new energy vehicles, increasing the export growth rate of the end consumer goods.
It is worth noting that the sale of intermediate products, such as steel, has emerged as a new component propelling China's exports. China's steel exports have been declining year after year in recent years, as has its share of global steel exports. With the revival of overseas demand in 2021 and the growth of international steel prices, there has been a significant disparity between domestic and foreign steel prices, reflecting the domestic steel price advantage. China’s steel export value climbed by 81.8% year on year in 2021, with its share of world exports increased from 14.8% to 17.1%. This product category contributed 1.5 percentage points to China's export growth. Other intermediate products, such as copper, aluminum, and different chemical products, performed similarly.
To sum up, the second narrative of China's exports is that the expansion of external demand brought about by the synchronized global recovery has become the most important factor driving China's exports, while the share effect weakened and showed structural differentiation. The prosperity of China's exports in 2021 is primarily due to the global economy's revival. The manufacturing substitution previously gained through domestic supply advantages is still present, albeit weakly, and the share of some items has even reverted to pre-pandemic levels. However, China's domestic exports of some intermediate commodities (steel) and final consumer goods (automobiles) remain strong, and the country's proportion of global exports continues to grow dramatically.
Ⅲ. 2022: EXTERNAL DEMAND BEGINS TO FALL, BUT A DEMAND-SUPPLY MISMATCH PERSISTS IN SOME COUNTRIES AND PRODUCTS
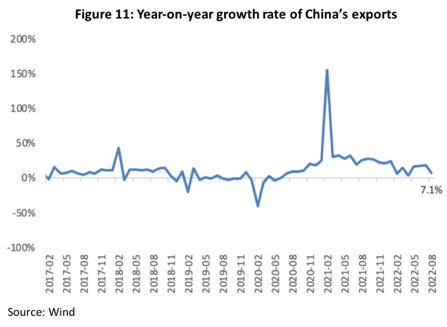
China's export performance remained resilient in the first half of 2022. In July, exports increased at a rapid rate of 18.0% year on year from a high base, exceeding market forecasts. In August 2022, export growth was 7.1% (in US dollars), a considerable decrease from the preceding two months. Due to a paucity of monthly data on global trade items, we concentrate on the major logic influencing current exports by tracking changes in China's exports.
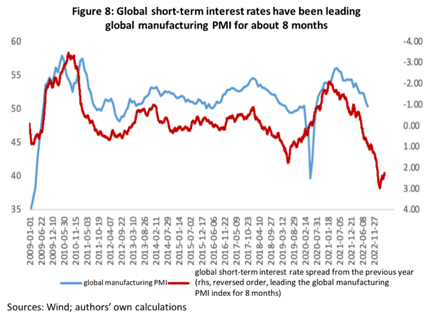
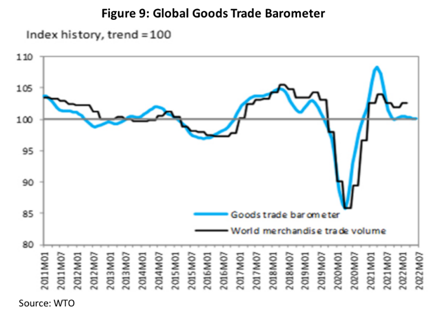
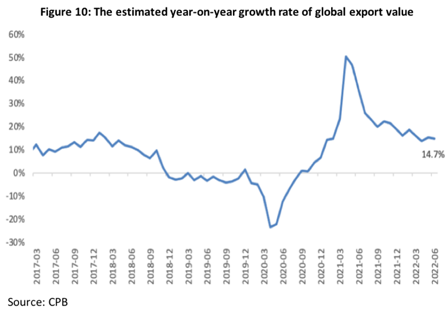
Basic fact 1: As developed countries have entered into the rate hike cycle, China’s external demand has started to decline. In 2022, to cope with surging inflation, major developed economies began the rate hike cycle, putting downward pressure on China’s external demand. As shown in Figure 8, global short-term interest rates have been leading the global manufacturing PMI index for 8 months. Along with the rise of global interest rates, the global manufacturing PMI index has also fallen sharply, with the JP Morgan global manufacturing PMI dropping to 51.1 and 50.3 in July-August, down 1.2 and 1.9 percentage points respectively compared with the average of the second quarter. According to the latest WTO report, the Global Goods Trade Barometer in July was already below the trend line of goods trade, and the yoy growth of global trade in Q2 further decreased. Based on the high frequency data of the Netherlands Bureau for Economic Policy Analysis (CPB), we estimate that the global export value in Q2 increased by 14.6% year on year, down by 2.3% compared with Q1; the global export value in June rose by 14.7%, a decrease of 0.6% compared with the previous month. Therefore, we believe that China’s external demand has slowed down, weighing on goods exports.
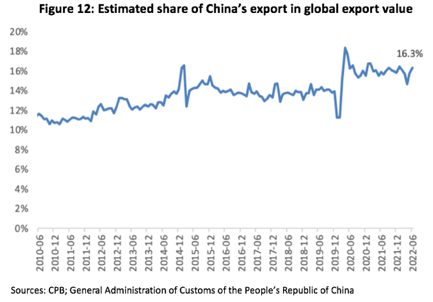
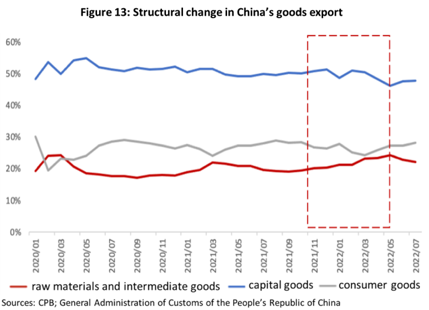
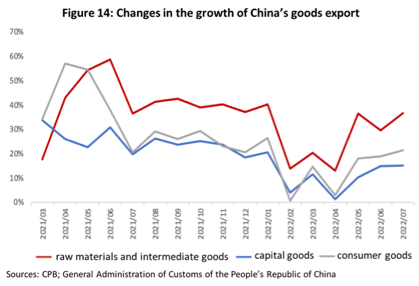
Basic fact 2: The share effect has not weakened substantially, and exports of certain intermediate and consumer goods remain resilient. Based on CPB’s estimate, China’s share of global export value in the first half of 2022 was basically stable, with an average of around 16.0% and a modest increase to 16.3% in June. In terms of the structure of China’s goods export, the share of raw materials and intermediate goods increased for eight consecutive months from 19.1% to 24.2% and outperformed the same period of last year despite a slight fall in the past two months. From the second half of 2021 onwards, exports of raw materials and intermediate goods have started to outgrow those of capital and consumer goods and also outpaced the overall growth of China’s exports with the gap still widening. Combing the share of these products and the growth, the explanatory power of exports of raw materials and intermediate goods in July for China’s overall export growth is over 45%, while that of capital and consumer goods is 40% and 33% respectively.
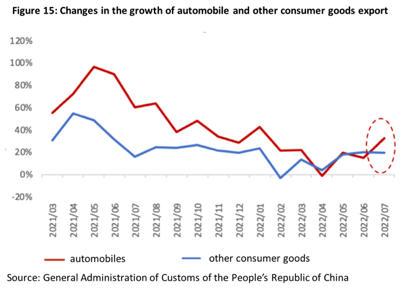
While exports of consumer goods slowed down, exports of automobiles, especially new energy vehicles, have become the main driver of China’s export. In the first 7 months of this year, the growth of automobile exports reached 32.4%, far higher than that of total goods exports and other consumer goods exports. Automobiles now account for 4.5% of China’s total exports, up by 0.4 percentage points from the same period of last year, contributing to 1.4 percentage points of China’s total export growth.
Basic fact 3: China’s exports to EU outpaced China’s overall export, with the growth rate of raw materials and intermediate goods way higher than other goods. The US and the EU have long been important export destinations for China, contributing to 30% of China’s total export value. Since Q2 of this year, China’s exports to the US have slowed down substantially, whereas the growth of China’s exports to EU has bounced back sharply and remains ahead of China’s total export growth. From the perspective of export structure, China’s exports of raw materials and intermediate goods to EU significantly outpaced other goods, with the growth rate hitting 45.5% in July.
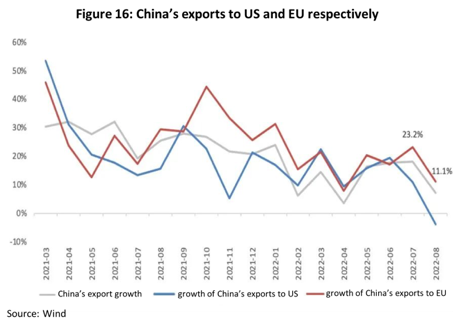
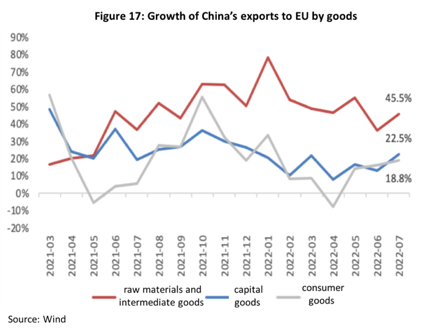
Based on the three basic facts mentioned above, it is not hard to tell that the third story of China’s export is gradually unfolding. The fundamental logic behind the story might be: as weaker external demand weighs on exports, China’s exports will show greater internal differentiation due to the considerable supply and demand gap in certain areas and products.
The main thread of this logic is that the Russia-Ukraine conflict and its subsequent impacts have widened the disparity of supply capacity among different economies. On the one hand, as Russia is the world’s major supplier of energy and metal minerals, the geopolitical conflict and sanctions on Russia will directly restrict the supply of these raw materials. On the other hand, due to its heavy dependence on Russian energy, Europe is facing a severe energy crisis after the outbreak of the conflict. Surging energy prices not only undermine Europe’s production capacity but also affect Europe’s exports of energy-intensive products, which exacerbates the supply-demand imbalance. In this case, it becomes more cost-effective to import intermediate goods directly from China, and similar situations have been very well reflected in the intermediate goods industries including copper, aluminum, and steel.
In other words, China’s exports are likely to show distinct structural features under the pressure of weaker external demand. On the one hand, falling external demand will reduce the export demand for all kinds of products, especially the demand for capital and consumer goods. On the other hand, since Europe is still grappling with high production costs, even if rate hike will dampen some demand, the production of intermediate goods still has a supply and demand gap which is hard to be closed simply by rising interest rates. This presents a structural opportunity for China’s exports of intermediate goods. However, soaring raw material prices might make differential impacts on the product prices, real profits and cash flows of China’s downstream and upstream industries. Hence attention needs to be paid to companies’ cash flow gap to prevent interruptions to the current structural improvement in the industrial sector.