
Abstract: This text examines the U.S. and Chinese economic performance and forecasts China’s equity market for the rest of the year. It warns against probable RMB depreciation that could be triggered by depleting growth momentum and a stronger USD.

I. FOREIGN CAPITAL FLOWS IN CHINA'S STOCK AND BOND MARKETS SINCE 2022: WHAT AND WHY
Since 2014, we have been debating whether foreign capital is wiser money. The market continued to decline in 2018 and 2019, but more foreign capital was invested. Looking back, you'll observe that since the government encouraged financial opening-up in 2016 and 2017, foreign money has been expanding the allocation in Chinese assets, which explains the sporadic volatility in 2018 and 2019. The appeal of Chinese assets has been rising consistently, with an annual inflow of foreign capital of roughly RMB 200–400 billion.
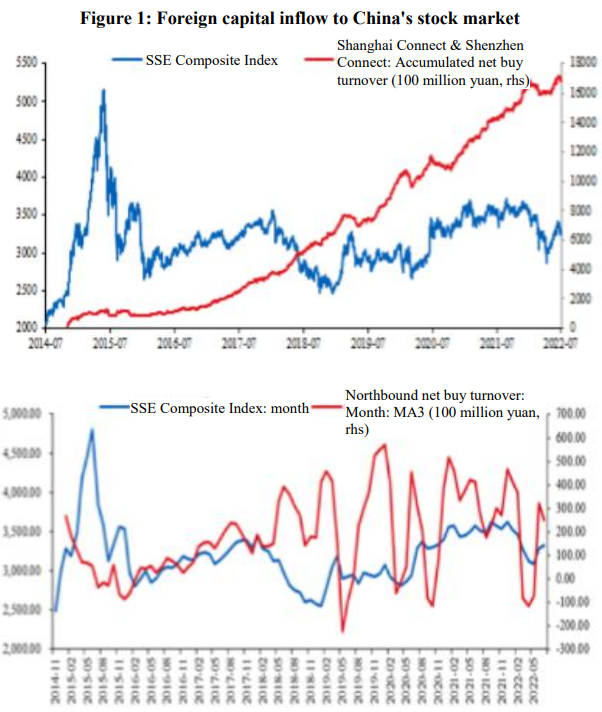
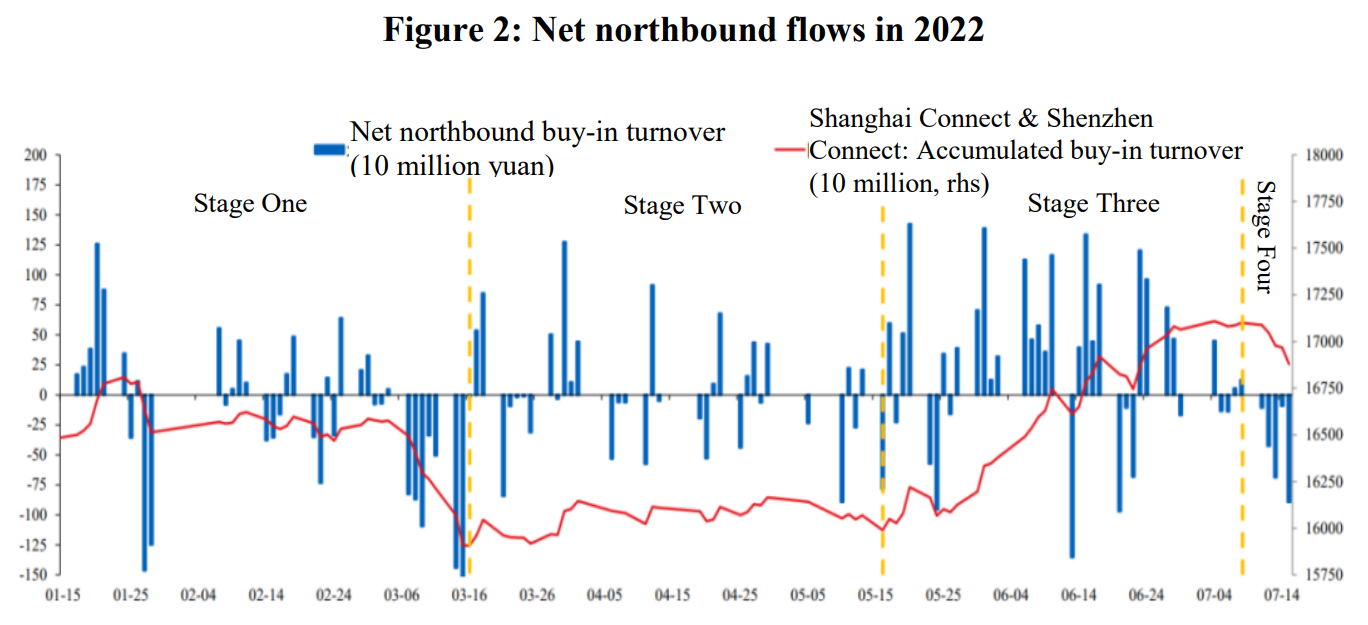
The northbound capital flow in 2022, fluctuated with market performance, can be divided into four stages.
? Stage 1: In the first turbulent quarter, it was normal to see tens of billions of RMB of outflow and inflow.
? Stage 2: Even when the stock market reeled from the pandemic from March to May, foreign capital did not withdraw in panic.
? Stage 3: Then you saw about 100-billion-yuan foreign capital inflow from May to June, partly because the SCI hit the bottom on May 13 and ushered in a clear rebound.
? Stage 4: In July, mortgage defaults caused concerns among northbound investors who took away about 20 billion yuan within a week or two.
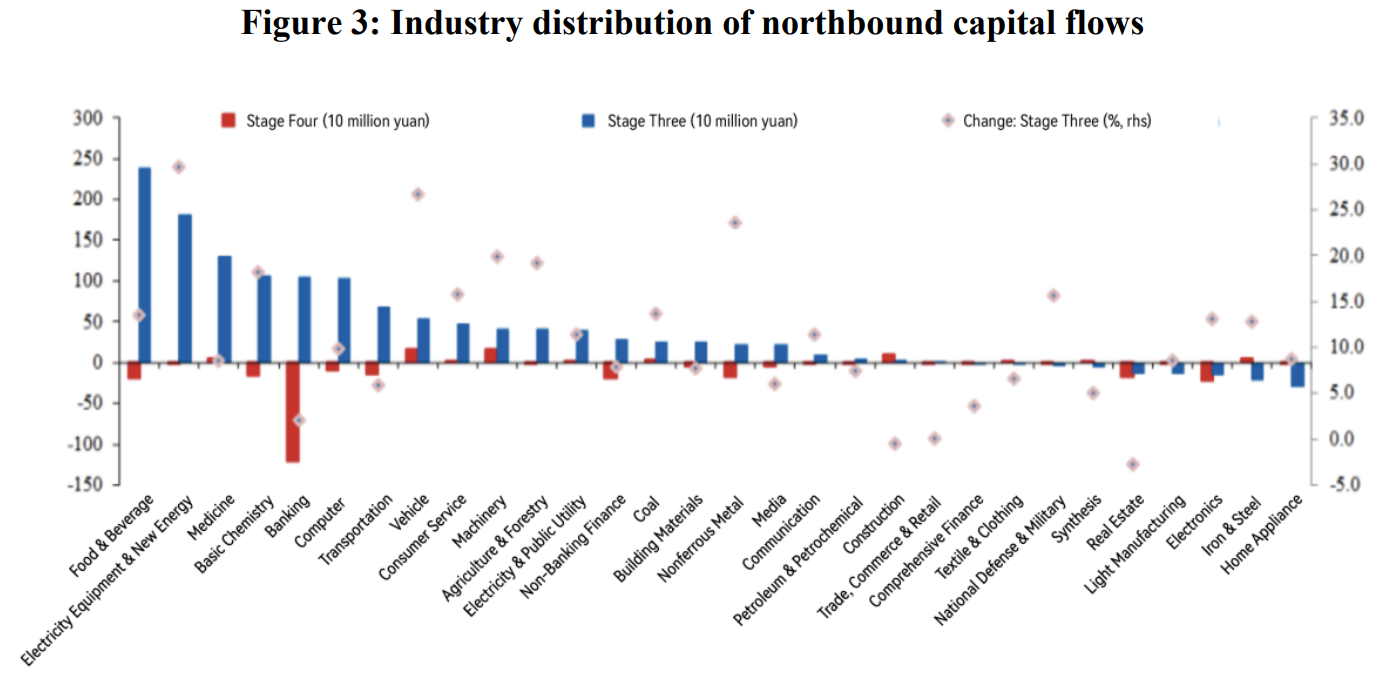
Among them, the large capital inflow in Stage Three is focused on core assets, good tracks, and sectors that benefited from stabilization policies, namely food, beverage, new energy, medicine, and basic chemicals. Most of the 23-billion-yuan outflow during this period came from the banking sector due to the recent mortgage defaults.
By excluding the exchange rate hedging cost, we have a net spread closer to that at the transaction level, which is worse than the China-U.S. spread. From February to April, the China-U.S. interest rate spread narrowed and turned negative manifested by the net capital outflow from the Chinese bond market, a rare situation since 2016.
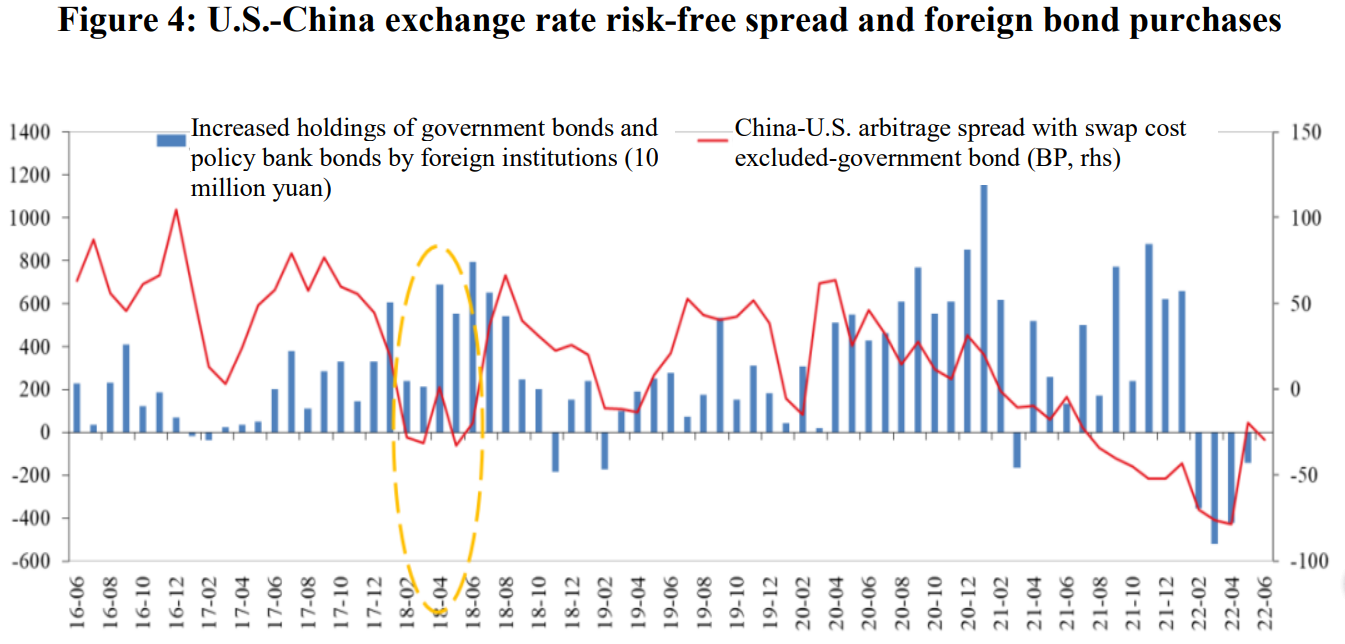
I would like to share some views on the negative China-US interest rate spread and its impact on capital flows and the value of RMB.
? The negative spread persisted for many years before 2008 when China joined the global industrial chain with its competitive advantage in export. Its goods trade surplus fuel the amount of foreign exchange, resulting in excessive domestic liquidity, for which China’s central bank raised the foreign exchange deposit reserve ratio to stabilize the exchange rate. That’s why you don't see capital outflows during that time.
? Why is the analysis of the negative China-U.S. interest rate gap less important than discussing the negative U.S.-Germany, U.S.-Japan, and U.S.-Europe spread? Because, unlike China, there are mature carry trades between major currency pairs. China has not yet opened operating accounts, and the RMB overseas don’t have a very large volume for carry trade, such as the US$1.5-trillion liquidity between the yen and the dollar. I think that the RMB is different from other currencies in the open financial market.
? The narrowing China-U.S. spread and the RMB devaluation in March and April is essentially due to internal reasons. The central bank had warned about the risk of depreciation and argued against overly suppressing RMB appreciation. At that time, many enterprises were willing to settle foreign exchange. The dollar was stronger and so was the yuan. The market had very high expectations for stable domestic growth. In March and April, however, the rising COVID-19 infections put the production chain and domestic assets on hold. The mainstream equity assets fell relatively sharply. At present, the operating account has not been fully opened, and the absolute aspect of the exchange rate is still based on exports and domestic economic prosperity as the most fundamental factors to analyze. We don’t have a mature or large basis for hedging transactions, and analysis methods for currencies such as the United States, Japan, and the United States and Europe may not be fully applicable in China.
Ⅱ. ANALYSIS AND FORECAST OF INTERNATIONAL AND DOMESTIC SITUATION
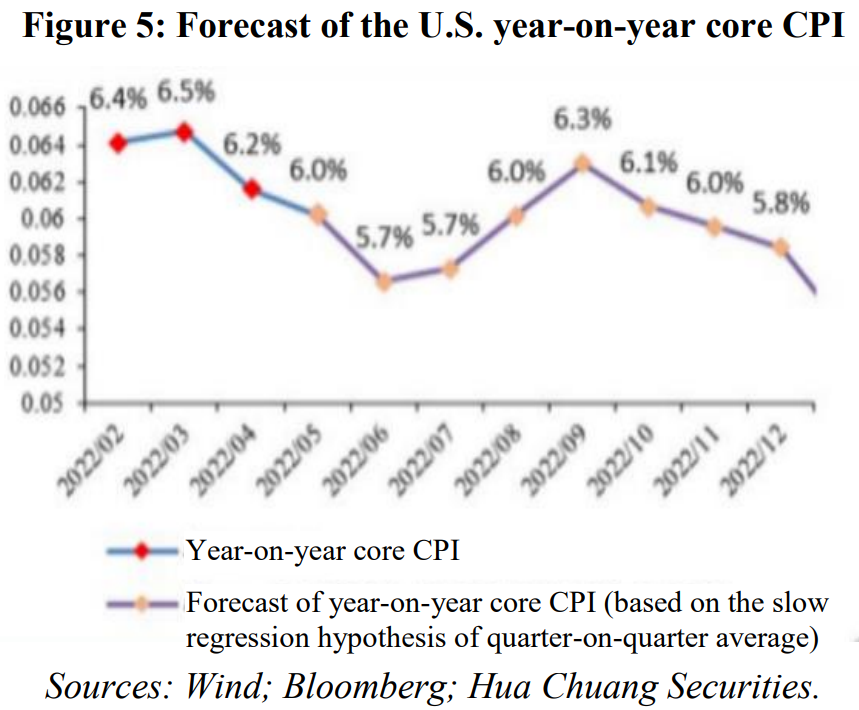
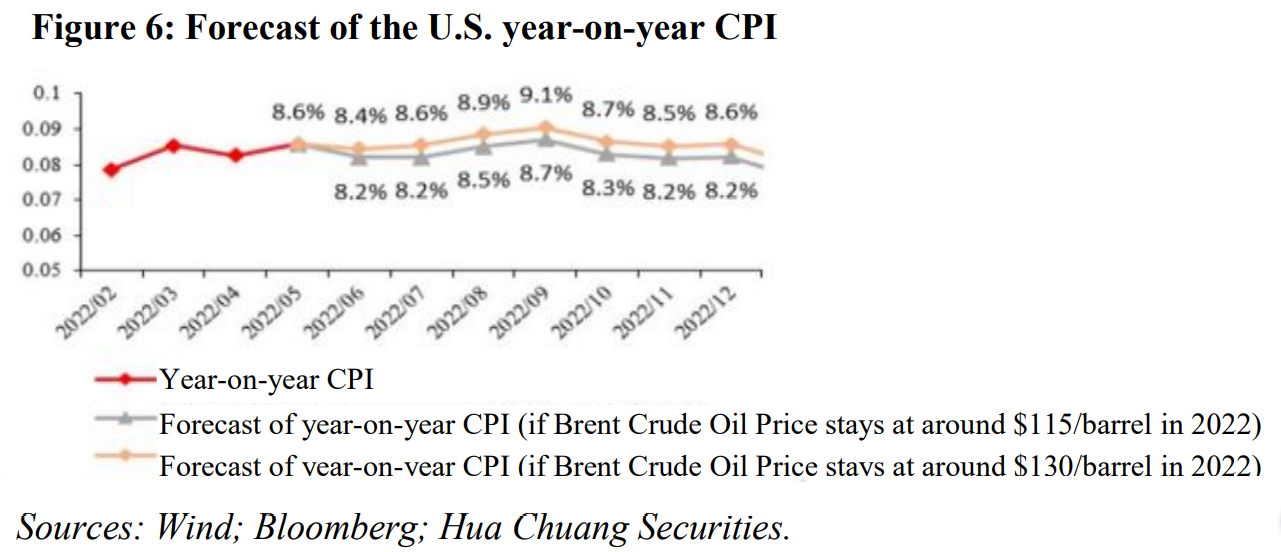
First, for U.S. inflation, we did a sensitivity test of different U.S. CPIs and found that the recent inflation is not likely to fall with certainty. There is a possibility of a second micro-charge, so we cannot say that US inflation has now peaked.
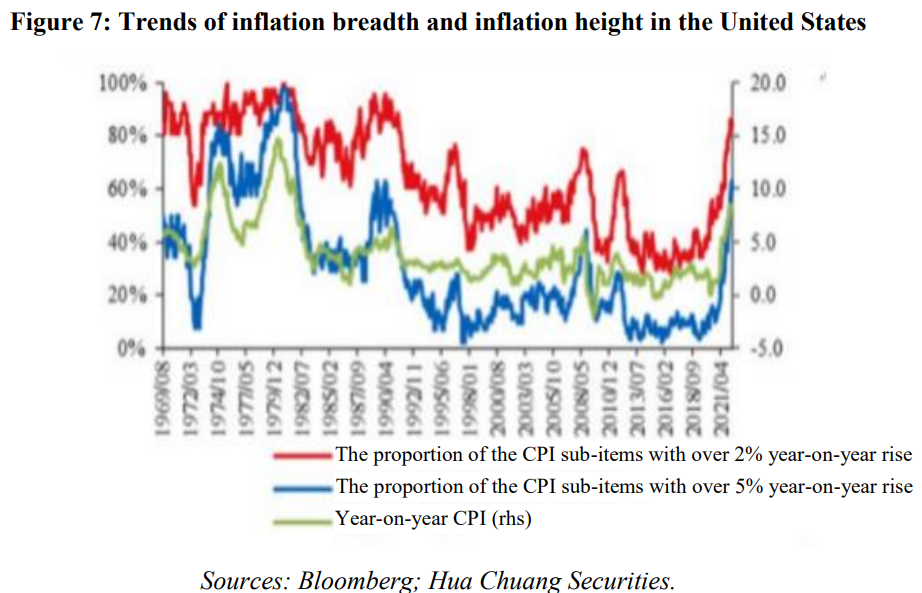
Second, it is easy to think that the 9% inflation rate Americans are having now is far from the 14.8% they did in 1980, so drastic tightening appears not to be as necessary as in 1980. We think it might be a bit narrow if merely looking at inflation from its height, so we add a breadth indicator that might give us a clearer picture of the reality.
There are about 100 sub-items in the U.S. CPI, and the breadth indicator focuses on the number of sub-items with an increase of more than 2% (=the Fed’s average inflation target) rather than the weight. The indicator is 85%-90%, meaning that when an American looks around and sees roughly 90 out of 100 items getting more expensive by over 2%. What does 90% breadth mean? This was the case at the peak of stagflation in the 1980s when 90% of the CPI rose more than 2%.
If you only look at the height indicator, the current inflation is distinct from 1980, but if you add the breadth indicator, inflation is closer to 1980 than we thought. Therefore, we believe that the width and height need to be viewed in parallel. In the past two years, U.S. inflation has been pushed up by the soaring prices of oil, rent, service, and used cars, but nowadays, more and more subjects are driving inflation.
What does wider inflation mean?
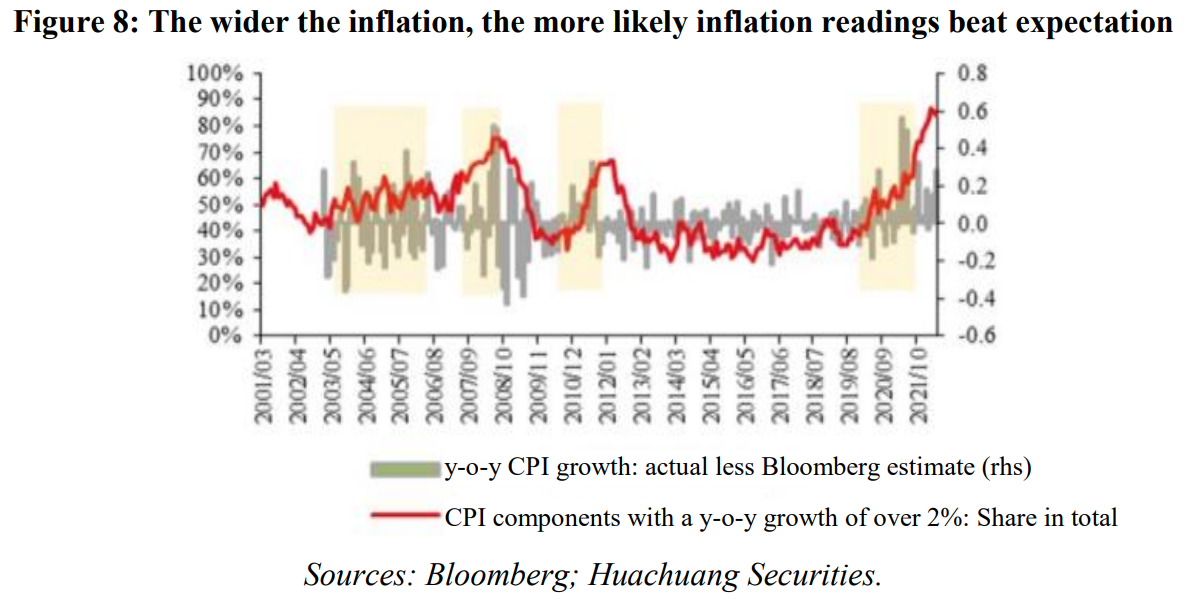
? Economists may be entering the "error time." From our model, when 80 of the 100 subjects have an increase of more than 2%, it is difficult for the forecasting model to figure out the supply and demand or pricing indicators of each of these item, because tracking 80 indicators is more prone to error than tracking one or two indicators. So economists will enter "error time" as the subjects become more complex and inflation becomes difficult to judge.
? Since 2000, the inflation breadth has been high. Figure 8 shows that when the red line is at a high level, the official U.S. CPI is always higher than the consensus of Bloomberg economists. This shows that when it is too wide, the inflation is likely to exceed expectations and financial institutions and economists may enter a state of running with inflation. Therefore, we think it's very likely that the U.S. inflation and interest rate hikes will go beyond expectations.
We believe that the inflation in the U.S. now is more a result of supply-side factors with which there is hardly anything monetary policy can do. Fast monetary tightening to slash demand is the only option for the Fed to control inflation. Indicators show that the U.S. economy remains strong. In one word, the U.S. is seeing tightened, but not collapsing demand. In the third quarter of 2022, the U.S. economy will influence the Chinese economy mainly via its beyond-expectation inflation and rate hikes, but these are unlikely to deal major blows to real economy demand until later in the fourth quarter of the year.
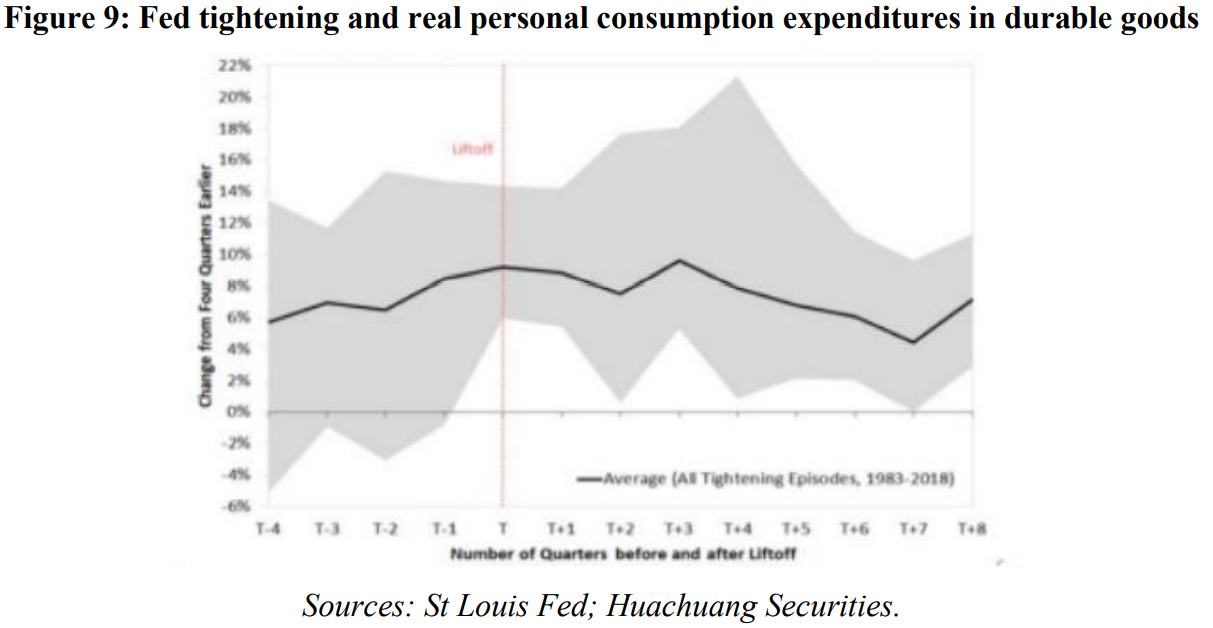
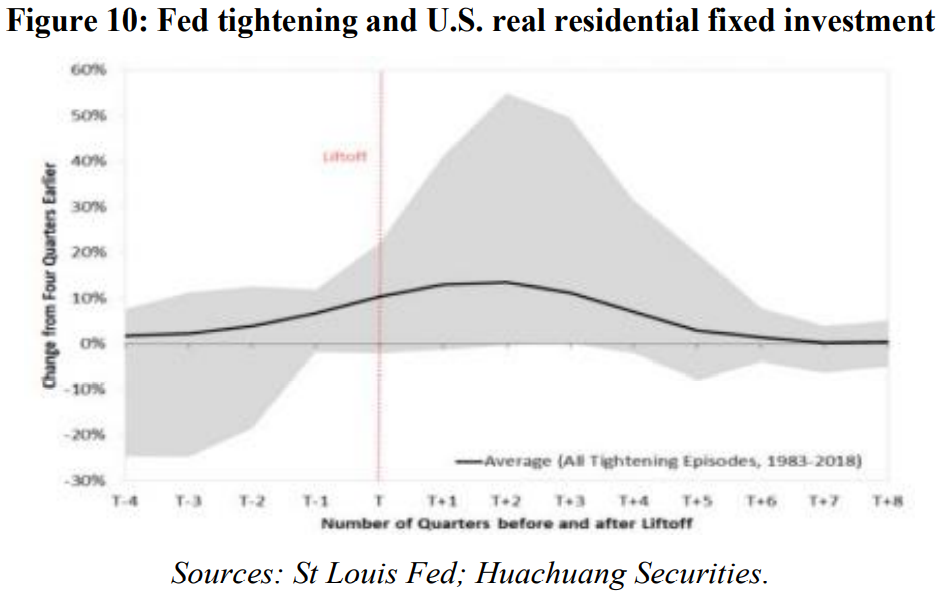
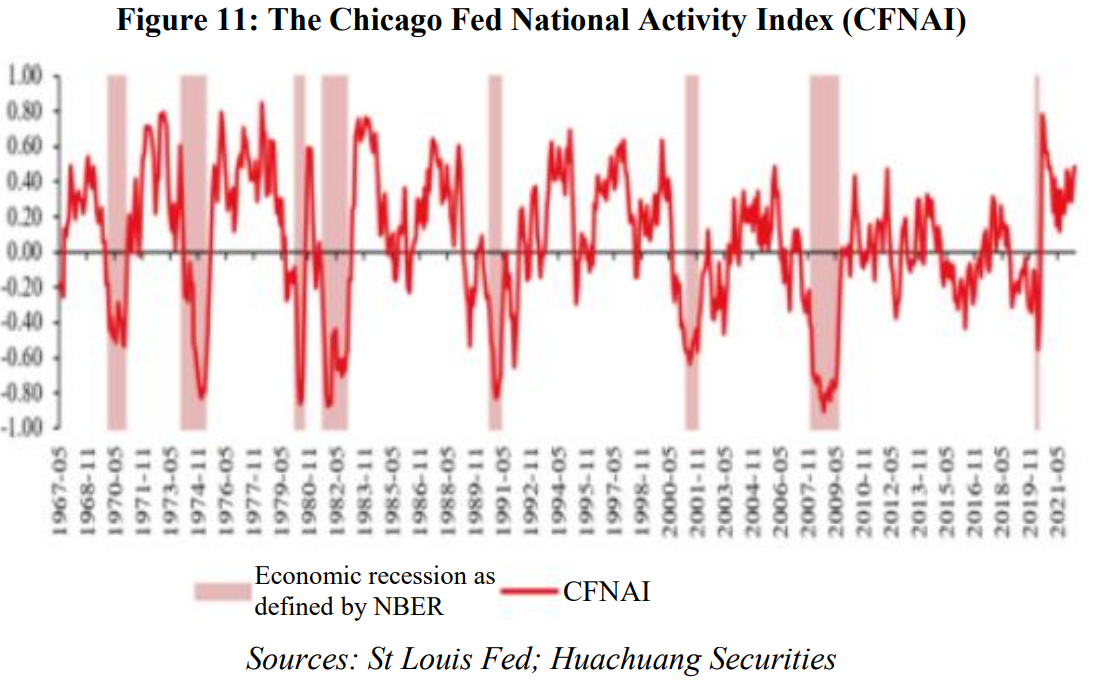
I would also like to share some of my views on the Eurozone. Many of the crises facing the Eurozone at the moment are implying future opportunities:
? The current inflation challenge could turn out an opportunity to solve the negative interest rate problem the Eurozone has been beset by ever since 2017. Investors are troubled when assets with negative interest rate absorb a disproportionate share of market resources. Europe has been experiencing net fund outflow since 2017, with the euro gradually becoming the second indebted currency after the Japanese yen. While inflation is a problem of today, it may address the negative interest rate issue in the future and make European assets more attractive.
? The current pandemic challenge could turn out an opportunity to promote fiscal integration in Europe with the issuance of the Euro bond, despite its limited scale. A lack of fiscal integration has been a long-standing headache for the European Union, and the Euro bond has marked a major step forward toward solving the problem.
? The Ukraine crisis, in the long term, could elevate public support for expanding military spending.
If Europe can survive the crisis, it will embrace several new possibilities:
? Euro as an international currency will have greater support from the Euro bond as a liquid and safe asset the scale of which could be on steady rise;
? Europe will have stronger military strength which could also underpin a strong Euro;
? It will shake off the negative interest rate problem with more attractive assets.
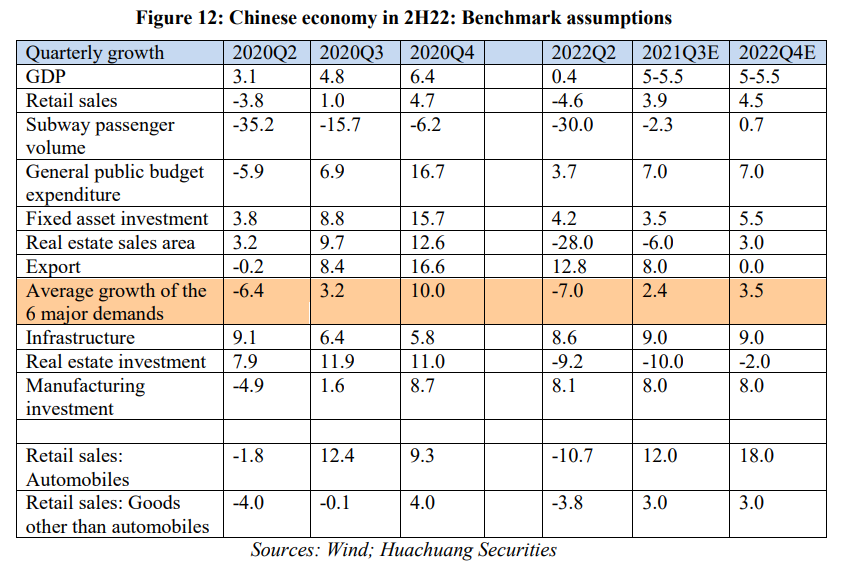
A certain extent of liquidity stress in China in 2H22 is foreseeable after international comparison. We predict that the Chinese economy will remain on track toward recovery in Q3, but it will be hard to beat expectations again entering Q4: the y-o-y growth of GDP will see increased but still controllable volatility, staying at around the same level or slightly drop by no larger than 0.5 percentage points compared to Q3. The annual result may well show a “squat-and-jump” trajectory, with the economy “squatting down” in Q2 before “jumping” in Q3 and leveling off in Q4.
Back in 2020, China’s growth kept rising quarter by quarter as the economy gradually shook off the blows from the Covid outbreak. If we decompose the three major forces driving growth (investment, consumption, export) into six types of demands which are social retail sales, travelling, government expenditure, fixed asset investment, real estate sales and goods export, back in Q4 2020, four of the six demands recorded a y-o-y growth of over 13% or 14%, and only with that did China manage to realize a y-o-y GDP growth of over 6%. But such strong rebound is hardly foreseeable in Q4 this year because there is basically no item whose growth can reach as high as 10-12%. We believe that China’s recovery will be pretty desirable in Q3, but it will lose some of the momentum in Q4.
III. Chinese capital market in 2H22: mounting external uncertainties but solid internal recovery
Based on the above analysis, in the second half of the year, the Chinese economy is expected to face mounting external uncertainties including the Fed’s tightening and geopolitical disruptions, but it may well regather the recovery momentum.
The third quarter will feature steady rebound. China’s domestic recovery momentum will stay firm, while the U.S. economy is unlikely to suffer any collapse despite its rising tightness with higher-than-expected inflation and fast rate hikes on the horizon which actually may have bigger impacts on the financial market sentiment in China. We thus remain neutral, if not a bit optimistic, toward the performance of the Chinese equity assets in Q3.
However, several key factors are expected to see fundamental changes in September which could make Q4 much harder:
? China’s CPI will exceed 3% in September, and it will not fall back down anytime soon – not until next spring, at least. That will increase worries over monetary tightening.
? China in September and October this year will face an extremely high base export record because of the export boom around 12 months ago as a result of the Omicron outbreak in Vietnam and other Southeastern Asian countries back then. Export growth may well plunge compared with a year ago, adding to negative market sentiments.
? By September, monetary tightening in other countries will have lasted for half a year, and Europe is expected to implement its planned rate hikes. Any decrease in demand in the U.S. in Q4 is also noteworthy.
? Major policy moves to stabilize growth are unlikely in Q4, as most such policies will have been delivered in Q3 to realize a decent annual result.
Hence, we caution against a certain extent of equity market decline in Q4, and expect that the Chinese market will continue to pay close attention to external uncertainties.
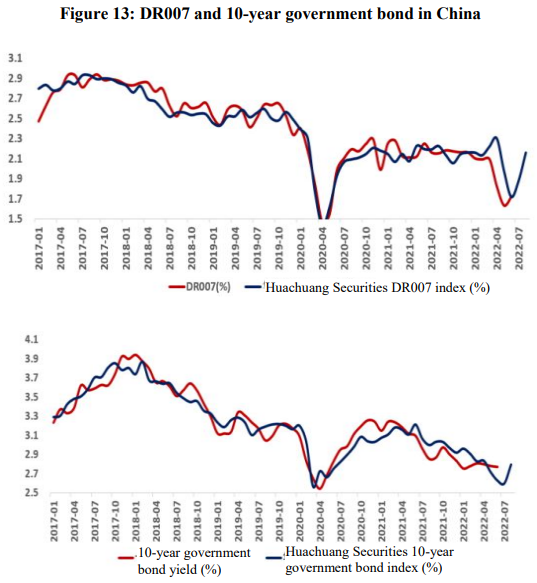
We apply two models, one on DR007 and the other on 10-year government bond, to depict the trajectory of the interest rate in China, having included both internal and external indicators. Results show that Q3 will see robust economic recovery which will naturally bring up the interest rate.
IV. RMB EXCHANGE RATE OUTLOOK
Fundamentals underlying the Renminbi (RMB) exchange rate have been different from before. Given the strong export in the recent two years, the Chinese private sector has accumulated USD 200-300 billion of foreign exchange reserves. With the Chinese economy and the PMI picking up in Q3, businesses will be more willing to clear the outstanding reserves, thus helping to deliver a stronger Renminbi. A strong willingness of foreign exchange settlement was also a major contributor to the unexpected rise in the RMB earlier this year.
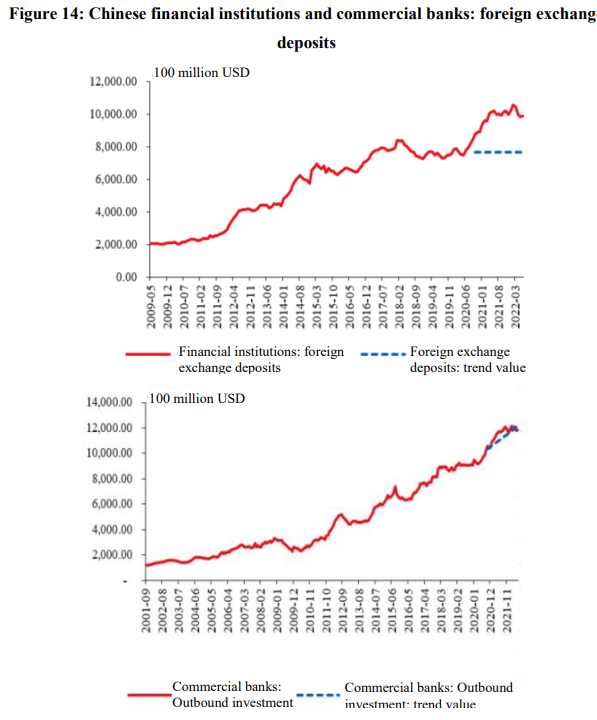
We have measured the willingness of foreign exchange settlement not just by the settlement rate, but also by the difference between the export settlement rate and the import payment rate. This is, as a matter of fact, more of an indicator of business willingness to keep holding their foreign exchange reserves. Among all macro indicators, our research shows that PMI turns out the most explanatory one on the level of foreign exchange settlement willingness. We have also enquired some of the businesses and senior dealers who believed that many of the bogus companies speculating in arbitrage dealings have been closed down ever since 2015 as capital regulation in China strengthened. Most of the remaining ones have real businesses to do in China, and as long as more orders are placed domestically, they will have strong willingness to clear their foreign exchange reserves so that they can expand investment and inventories.
The increase of forex settlement rate in late 2021 and early 2022 is related to the adjustment of macro policy after October, 2021, the rise of PMI to over 50% after bottoming out and its continued mild expansion for 2-3 months in a row, as well as the market’s expectations of China’s stabilization policy including a policy shift in the real estate sector in late 2021 and early 2022.
After the Covid-19 pandemic hit Shanghai in this April, the rising trend of the forex settlement rate was interrupted, with the volume of spot exchange transactions in Shanghai dipping to 1/3 of the previous level. Before the Covid-19 outbreak, the average daily trading volume in Shanghai was between $40 billion and $60 billion, while during the pandemic, the average daily trading volume once dropped to just over $10 billion. The onshore trading volume was particularly low. The disrupted supply chain further undermined companies’ willingness to settle foreign exchange, and meanwhile PMI also dropped. Hence we say PMI is the best macro indicator that can explain and correspond to companies’ willingness to settle foreign exchange. Even when compared with indicators such as the US bond rates and the US dollar index, corporate willingness to settle foreign exchange is more in line with the move of PMI.
Back to the trend of the RMB exchange rate. Domestically, it is certain that China’s economy will recover in Q3; though externally, liquidity tightening would accelerate, the financial sector will bear the brunt of the impacts, and the possibility of declined external demand in Q3 is rather low. So the RMB exchange rate is expected to remain stable. In addition, the quarterly domestic interest rate might fluctuate with a modest rise, and the interest rate spread between China and the United States will improve slightly. At the same time, if the performance of equity assets is neutral or even positive, RMB would be supported by the growth of major assets, and the good returns on physical investment and all types of assets. Therefore, we have confidence in the stability of the RMB exchange rate.
But in Q4, on the one hand, exports might drop; on the other hand, we need to watch closely the settlement of unsettled foreign exchange. If disruptions from outside of the US (mainly from Europe) occur, the US dollar would keep strengthening as investors turn towards this safe-haven asset. At that time, China will have passed the period with the strongest recovery momentum, and PMI might begin to fluctuate a lot, which will put greater pressure on RMB depreciation or lead to higher volatility of the RMB exchange rate.
This article is the transcript of the author’s keynote speech at the CF40 bi-weekly Youth Forum on "Global Capital Flows and New Trends in Capital Markets". The views expressed herewith are the author’s own and do not represent those of CF40 or other organizations. It is translated by CF40 and has not been reviewed by the author.