
Abstract: The paper examines the relation between export and manufacturing investment, and the driving force of this round of manufacturing investment growth to assess the conditions of the macro economy. Specifically, it divides the manufacturing sector into three subsectors, i.e. raw materials, capital goods and consumer goods, and decomposes export growth into quantity effect and price effect for manufacturing and its sub-sectors. It points out that if the prices of raw materials go up in 2H22, macro policies will need to address the new demand gap brought about by investment in manufacturing as well as the cash flow gap of the corporate sector. In addition to monetary policy, government spending should be expanded to relieve corporate cash flow pressure and prevent such pressure from triggering wider debt risks.
Since the outbreak of the COVID-19 pandemic, investment in China’s manufacturing sector has delivered impressive performance, even briefly surpassing the pre-pandemic level.
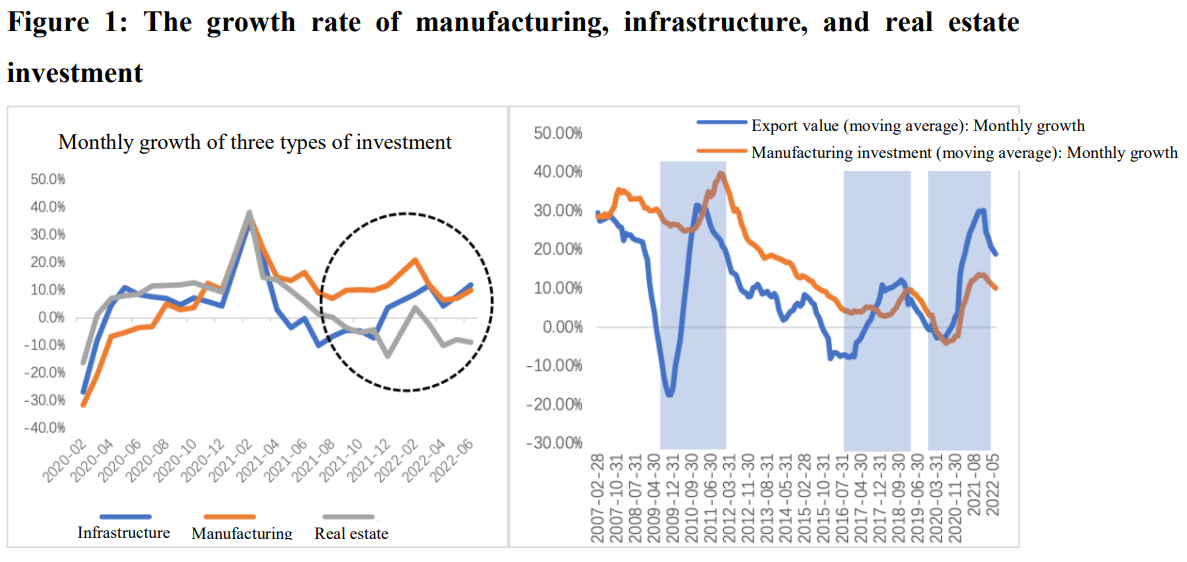
It is especially the case in the 2H21. With the Chinese economy caught between stagnant infrastructure investment and falling real estate investment, robust manufacturing investment played an important role in propping up investment. Later, when infrastructure investment began to rise, manufacturing investment still maintained a 10% growth, which jointly made up for part of the investment shortfall caused by the declining real estate sector in the 1H22.
When viewed over a longer time span, manufacturing investment is closely related to the performance of export. As shown in Figure 1, during the periods of 2009-2010, 2017-2018, and 2021-2022, changes in export growth always led the changes in manufacturing investment. This might indicate a key relation between export and manufacturing investment.
In the 2H22, as central banks worldwide follow one another into rate-hike cycles and the global economy continues to go downward, China’s export may encounter a turning point. Once this occurs, it remains to be seen whether export will drive down manufacturing investment as it did in the past. Domestically, there is great uncertainty about whether real estate investment can stabilize in the 2H22; sustained growth of infrastructure investment relies on fiscal funds being in place and the implementation of infrastructure projects. As export and manufacturing investment are closely intertwined, their dynamics would determine whether there will be a new demand gap caused by internal and external factors. Therefore, understanding the driving forces of this round of manufacturing investment growth and clarifying the relation between exports and manufacturing investment are essential for the assessment of the macro economy.
Next, we examine the structural features of manufacturing investment and export, and attempt to build an explanatory framework by combining different logical reasoning.
I. MANUFACTURING SECTOR: PROFITABITLIY IS IMPROVED MAINLY IN THE RAW MATEIRALS SECTOR, WHILE INVESTMENT IS CONCENTRATED IN THE CAPITAL GOODS SECTOR
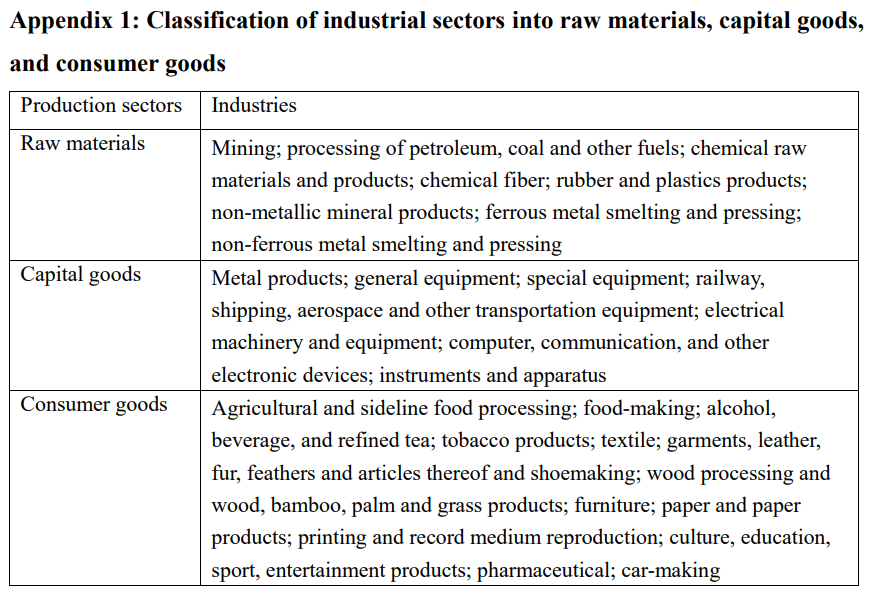
We divided the manufacturing sector into three subsectors: raw materials, capital goods, and consumer goods (see Appendix 1). The main reason for this classification is that capital goods and consumer goods are both end products, and they will face cost pressures from higher raw material prices at the same time, yet the transmissions of such pressures may vary.
Under this classification, we analyzed the structural performance of the three subsectors since 2021, and found: since 2021, improvement of cash flows has mainly occurred in the raw materials sector, while the growth of fixed-asset investment has mainly occurred in the capital goods sector.
As shown in Figure 2, since 2021, the improvement in both operating income and total profits has been significantly higher and more sustained in the raw materials sector than in the capital goods and consumer goods sectors. This structural feature is in line with the large "PPI-CPI" scissors gap over the same period.
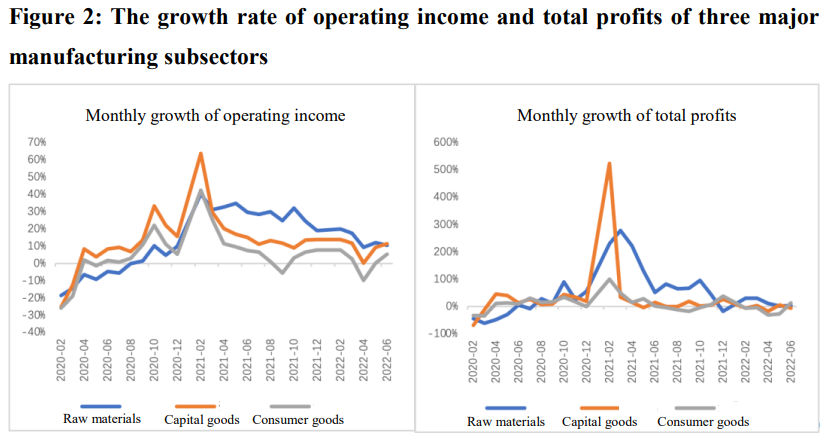
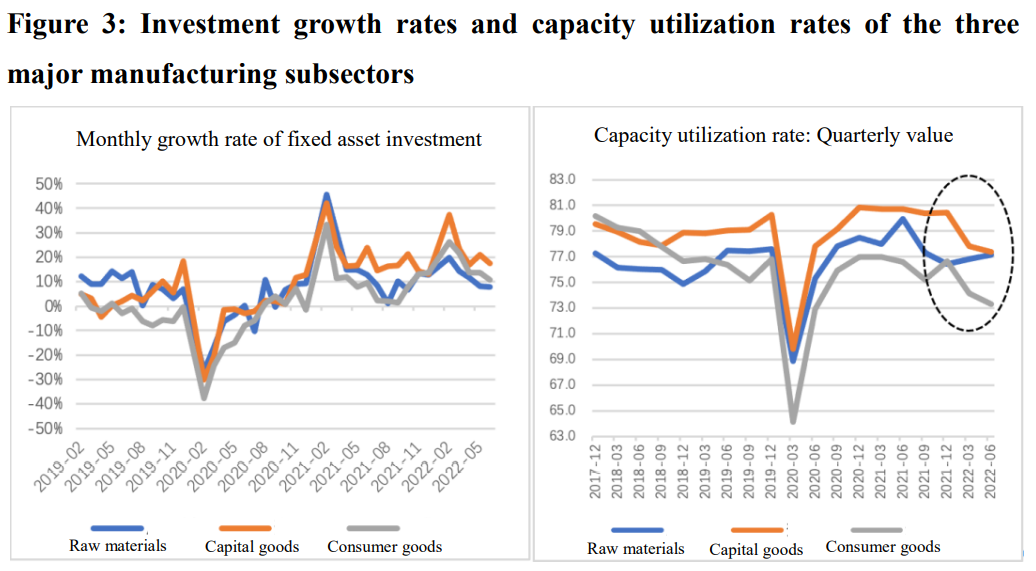
The abovementioned facts suggest that changes in profitability do not fully explain the structural features of manufacturing investment. As mentioned earlier, the raw materials sector has the best improvement in cash flows, but the weakest growth of investment. As demonstrated in Figure 3, based on the performance of fixed-asset investment, investment in the raw materials sector has always stood at a low level, especially in the 1H22, which fails to reflect the effect of improved profitability. Restrictive policies imposed on some industries can largely explain why better profitability in the raw materials sector does not lead to larger investment. In contrast, the capital goods sector has the highest and most continued investment growth, followed by the consumer goods sector. Clearly, the structural feature of manufacturing investment does not match the changes in profitability.
In contrast, the differentiated performance of capacity utilization rates may be more in line with the structural features of investment. An indicator closely related to investment is the rate of capacity utilization. As shown in Figure 3, the capacity utilization rate of the capital goods sector was significantly higher than that of the other two sectors before the pandemic. After the outbreak of the pandemic, the capacity utilization rate of capital goods recovered the fastest and returned to the pre-pandemic average level in the third quarter of 2020. Capacity utilization rate of the capital goods sector had remained high throughout 2021, above the pre-pandemic average and significantly higher than that of the other two sectors. This means that the production in the capital goods sector felt significant capacity constraints during those years, which led to a relatively strong demand for investment and expansion. The capacity utilization rate in the consumer goods sector contrasts sharply with that of the capital goods sector. As shown in Figure 3, after the pandemic, the capacity utilization of the consumer goods sector experienced a round of recovery before starting to weaken in 2021, and has since then remained lower than the pre-pandemic average. It declined further in the 1H22.
It is worth noting that in the 1H22, the profit of the raw materials sector continued to improve, and the year-on-year monthly growth remained positive, but the profit improvement of capital goods slowed down significantly. At the same time, the capacity utilization rate of the raw materials sector remained basically the same as that in the 2H21, but that of capital goods and consumer goods has dropped rapidly from the high level in the 2H21, indicating a relaxation of the capacity constraints faced by the capital goods and consumer goods sectors. This may reflect both an increase in production capacity brought about by previous investment and the weakening of actual demand. It also corresponds to the reality that the growth of manufacturing investment began to slow down in the 1H22.
II. EXPORT: CAPITAL GOODS ARE THE MAIN EXPORT SECTOR; PRICE EFFECT IS THE MAIN FORCE TO MAINTAIN THE CURRENT EXPORT GROWTH RATE
Referring to the standards defined by Zhou Shen (2006), we had 5962 sample commodities sorted according to industrial classification for national economic activities, and examined the structural features of exports on this basis. Then we decomposed export growth into quantity effect and price effect for the manufacturing sector as a whole and its sub-sectors. Quantity effect refers to the increase in the export value caused by the increase in the number of export products, and the price effect refers to the increase in the export value caused by the increase in the export unit price.
Following are two basic facts we have observed.
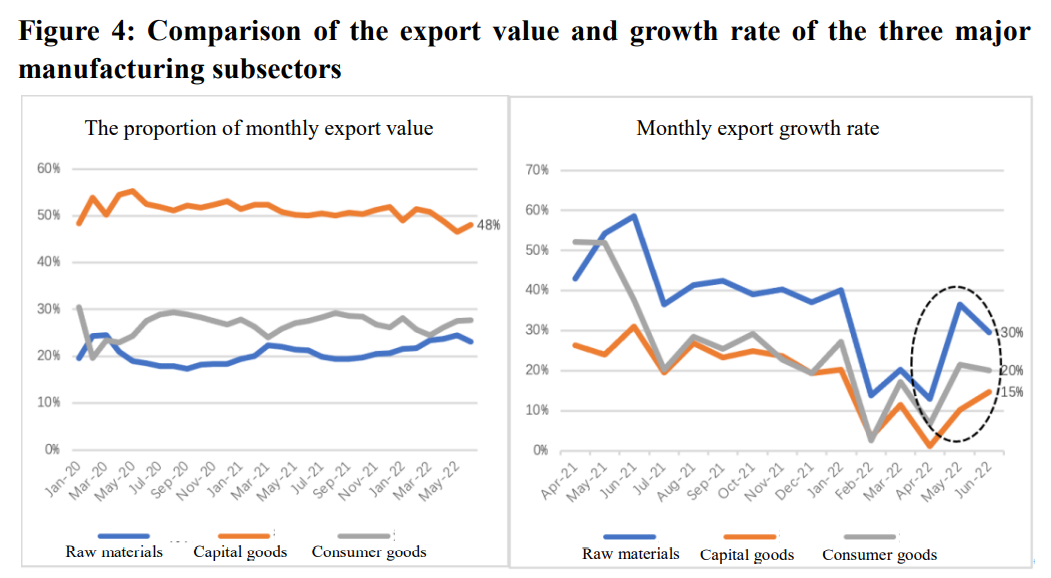
FACT 1: The export of capital goods accounts for more than half of the total export value, but its growth in the 1H22 is significantly lower than that of the other two sectors. As shown in Figure 4, since the outbreak of the pandemic, the share of capital goods exports has remained at around 50%, while the share of raw materials and consumer goods sectors averaged at 22% and 28%, respectively. This shows that current export is dominated by the export of capital goods. Another interesting phenomenon is that in 2021, the growth rate of the export value of capital goods and consumer goods remained roughly at the same level, but entering 2022, the growth rate of export value of capital goods fell significantly below than that of consumer goods. From May to June, the growth of China’s overall export value decreased by an average of 8 percentage points compared with the 2H21. Combining factors of the export growth of capital goods and the share of capital goods in total export, it can be concluded that the capital goods sector explained about 5 percentage points of the decline, raw materials and consumer goods 2 and 1 percentage points, respectively. In summary, the falling growth rate of the export value of capital goods is the main reason for the decline in the overall exports.
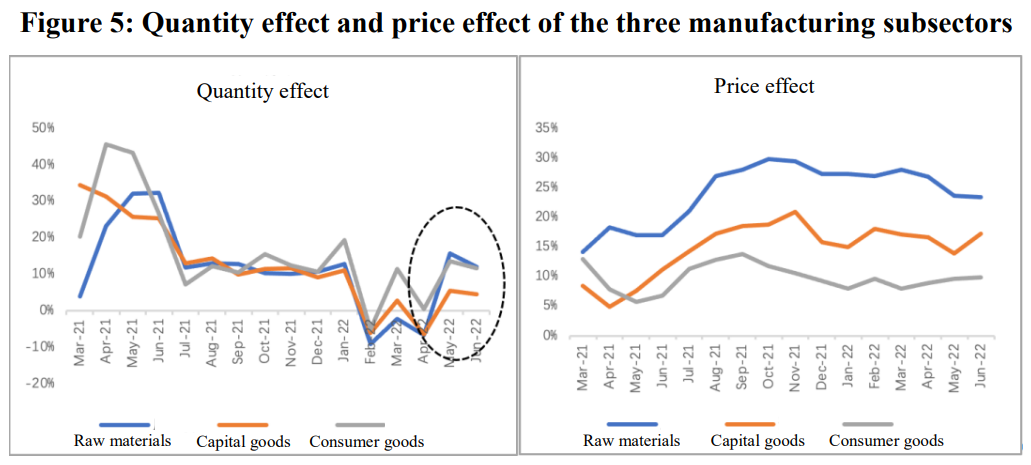
FACT 2: The price effect shows strong rigidity, with the decline in export growth mainly manifested as a lower quantity effect of capital goods. Per Figure 5, since the 2H21, the quantity effect of the export of raw materials, capital goods and consumer goods have all been slashed from back in 1H21 and highly volatile especially in early 2022 under COVID’s blow and influence from the base effect. In comparison, the price effect has remained at a rather high level minus a few small dips, exhibiting considerable rigidity. If price change is demand-induced, it should move in the same direction as quantity fluctuation, as was the case in 1H21. Hence, price effect rigidity in the past year may have been largely backed by cost rigidity.
More importantly, during May and June 2022 as export picked up, the quantity effect of raw materials and consumer goods basically recovered to the average level in 2H21, but that of capital goods was still half as much as the 2H21 average and the only item seeing a substantial drop. Hence, the first fact noted above can be further boiled down to the conclusion that the reduction in the quantity effect of capital goods is the main factor paring down China’s total export value growth.
III. CAPITAL GOODS ARE MUCH MORE EXPORT-DEPENDENT THAN RAW MATERIALS AND CONSUMER GOODS
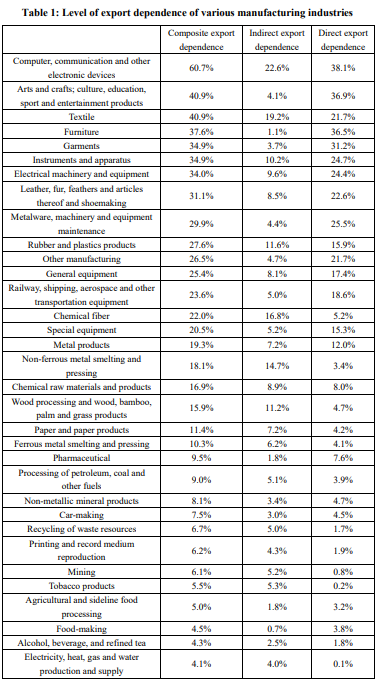
We could proceed to look at various manufacturing sectors’ actual export dependence. There are many indicators to measure export dependence, and for the purpose of this article, we chose the share of final consumption expenditure on export in total output in 2020 to measure the direct export dependence of a sector.
We should also consider indirect export dependence. When the output of a certain sector is not exported but inputted as an intermediate into the production of other sectors and exported as a part of their output, this sector is essentially exporting—indirectly. Indirect export dependence is usually higher than direct dependence for most of the raw material providers such as chemical fiber makers. Their direct export dependence was 5.2% in 2020, but their indirect export dependence came in much higher at 16.8%, because they deliver intermediate goods used in textiles and garments which are then exported as final products. Based on these, we could calculate a composite export dependence (direct + indirect) to measure the level of export dependence of a sector.
As shown in Table 1, industries in the capital goods sector rank among the upper 50% in terms of both direct and indirect export dependence, indicating a much higher level of correlation with export than raw materials and consumer goods. In addition, we observe obvious divergence within the latter two sectors: some of the industries in the consumer goods sector are highly reliant on export, such as garments, furniture and entertainment products; while some show a very low level of export dependence, such as alcohols and drinks. The indirect/composite export dependence is much higher than direct dependence in some of the industries such as chemical fiber and non-ferrous metal. That’s because these are raw materials, or intermediate goods, which are exported only as part of the final products. This also validates our assertion that the price effect rigidity comes from the cost end.
Ⅳ. CONCLUSION
Based on the above analysis, we try to give two logical clues to summarize our observations.
CLUE 1: After COVID-19 struck, demand for China's industrial products, which have become temporary substitutes due to global economic recovery and supply chain disruption, has surged, but its production capacity cannot meet the demand, leading to increased manufacturing investment particularly in capital goods, a sector that heavily depends on and impacts exports.
CLUE 2: The supply of some raw materials was stalled, at the same time when restrictive policies were limiting the production capacity of some raw material industries. Both supply and demand factors fueled raw material price hikes and created cost pressures on both the capital goods and consumer goods sectors. The domestic industrial product sector passed on a considerable part of the cost pressure through exports in the form of high export price. Among the three sectors, capital goods bore more cost pressure than consumer goods and transferred this pressure overseas through exports.
From the perspective of the quantity effect, in 1H22, the interest rate hikes of major central banks may continuously suppress external demand, which may reduce the quantity effect on export value. Given the fact that the capacity utilization rate of the industrial product sector already went down in 1H22, the investment in this sector may decline significantly. Specifically, the capital goods sector, which has driven the most investment in manufacturing in the past year, is likely to experience a decline in the willingness to expand production capacity. Meanwhile, preliminary measurement results show that the quantity effect of exports may have a positive effect on manufacturing profits, and this effect is more significant for export-dependent industries; the price effect on manufacturing profits is negative. For the more export-dependent capital goods, some raw materials, and consumer goods sectors, the increasing cost is adding pressure on corporate profits (see Appendix 2).
The price effect of exports mainly depends on the trend of raw material prices, but even if prices remain at the current level, the price effect in 2H22 will largely be weakened due to the base effect. If the cost pressure caused by previous increase in the price of raw materials can be alleviated, it will offset some of the profit pressure on the capital goods and consumer goods sectors caused by the decline in external demand. The balance sheet of the corporate sector is still stable, and macro policies should focus on the possible investment gap in the manufacturing sector, ease the situation through interest rate cuts, investment subsidies, and increased government spending.
However, if the supply (production capacity) constraints in 2H22 cannot be substantially improved and there will be no collapse of overseas demand, then raw material prices will likely remain high. If this happens, the capital goods and consumer goods sectors will face pressure on the supply and the demand ends, a greater challenge to companies’ cash flow, and a blow to investment willingness. In addition, rising capital goods prices generally translate into increased production costs over a longer period, which in turn will reinforce the obstinacy of global inflation.
In this case, the corporate sector may face significant cash flow pressure, which will directly affect the stability of companies’ balance sheet. The macro policy will have to take into account this cash flow gap in addition to the demand gap brought about by investment in manufacturing. However, it is difficult to address cash flow pressure only by monetary policy. There is an urgent need to expand government spending to relieve cash flow pressure and prevent such pressure from triggering wider debt risks.
Appendix 2: Quantity effect and price effect of exports, export dependence, and manufacturing profits
We use regression of panel data to test the factors driving profit growth of industrial enterprises. The dependent variable is profit (profit growth rate), and the explanatory variables are revenue (revenue growth rate), quantity (quantity effect on export), price (price effect on export), and the interactions between dependence (composite export dependence) and export quantity and price. The industry (i) and time (t) effects are fixed. The regression equation is as follows:

The empirical test employs monthly data from February 2021 to June 2022, with a total of 16 periods, covering 28 industries related to manufacturing. The revenue and profit growth rates of industrial enterprises are both monthly values. The export quantity and price effects are processed by the same method applied in the second part of the article. The composite export dependence of each industry is calculated according to the 2020 input-output table. The regression results are reported in the table below:
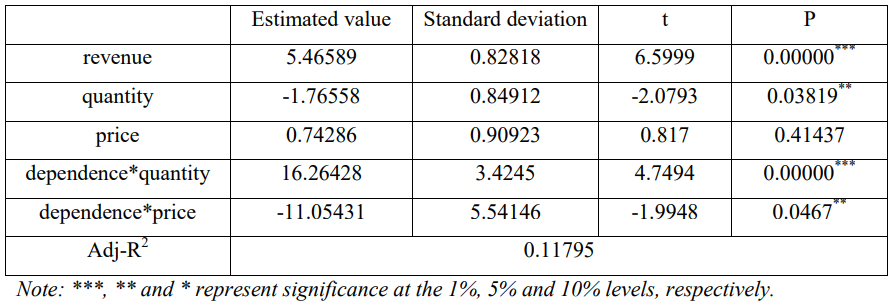
The results show:
(1) There is a significant positive correlation between corporate profit growth and revenue growth.
(2) The coefficient of export quantity effect is negative, but the coefficient of the interaction term of export dependence and quantity effect is positive. This means that, after the correction of the interaction term, for industries with high export dependence, the export quantity effect can promote the growth of corporate profits, while the price effect will inhibit the profit growth.
The article was first published in CF40's WeChat Blog on August 8, 2022. It is translated by CF40 and has not been reviewed by the authors. The views expressed herewith are the authors’ own and do not represent those of CF40 or other organizations.