
Abstract: China’s financial market slump during January to April was mainly caused by short-term factors, but also reflects the market’s concerns over the uncertainty about China’s long-term growth. In this context, the author evaluates the prospect of China’s long-term economic growth, on the premise that China is about to pass the threshold for high-income economies. From now up to 2035, China will have to maintain a high level of growth in order to become a moderately developed country. To reach that goal, the country needs to continue to prioritize economic development, enhance the rule of law, deepen economic openness, and improve institutional arrangements.
I. RECENT FINANCIAL MARKET PERFORMANCE
As shown in Figure 1, from January to April of 2022, the correction of the real estate market, resurgence of COVID-19 pandemic, Russia-Ukraine conflict, and policy shifts have together led to the sharp decline in China’s equity market.

By the end of April, the A-share market had fallen close to an extremely low level.
As illustrated in Table 1, valued at price-to-earnings ratio, most of the indices have dropped below the lower quartile; valued at price-to-book ratio, most of the indices have been below the first decile.
In addition, between late April and early May, at the trading level, the A-share market has clearly become insensitive to a series of bearish factors.
Compared with similar sharp market declines in history, the most striking feature of this round of market slump is the absence of a visible, broad-based liquidity crunch. In fact, since the beginning of 2022, the liquidity condition has remained stable, even loosened slightly.
In the past, market dive was usually a combined result of investors’ gloomy outlook for profits and tightened liquidity condition. But in the down market during the first 4 months of 2022, the factor of shrinking liquidity can be ruled out.
Therefore, if we rule out the effect of tightened liquidity on the market slump throughout history, in this round of bear market, investors’ dark forecast of the future economic fundamentals in terms of valuation is very rare and extreme.
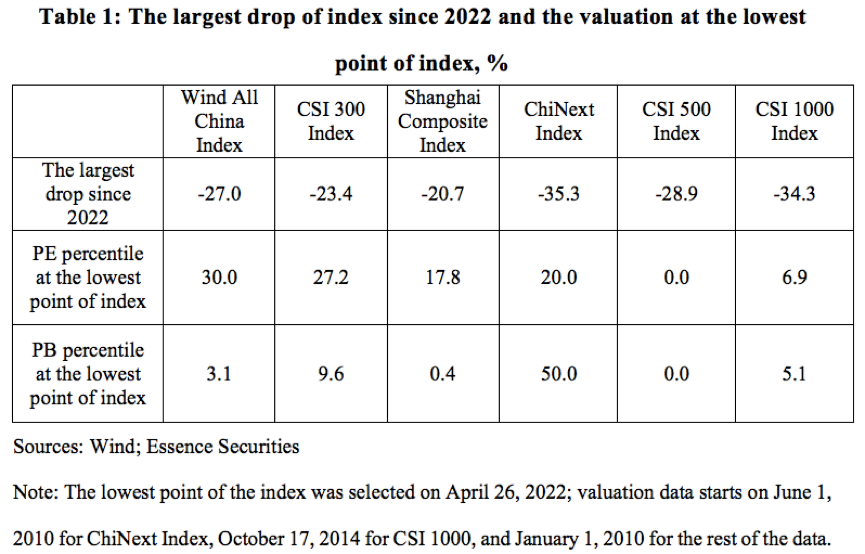
As of early this May, such an extreme valuation might have fully or even excessively taken into account bearish factors concerning economic fundamentals that have materialized or can be expected.
Since May, in addition to the market rebound through transactions, some factors related to economic fundamentals have also begun to turn around, such as better control of the pandemic, improved bank credit supply, loosened liquidity condition, the rollout of stabilization policy, and the correction of former policies by the regulatory authority.
Under this condition, the market has staged a significant rally in recent 2 months. At the moment, we tend to believe that the market is still in the process of rebound attributed to valuation repair and improved economic fundamentals. Based on market transactions and the fundamentals of the economy, the process is expected to continue.
II. THE CHALLENGES OF BECOMING A MODERATELY DEVELOPED COUNTRY BY 2035
Looking back at the market slump from January to April of this year, apart from the well-known short-term factors, another key factor is the market’s concerns about the certainty and visibility of the long-term growth outlook.
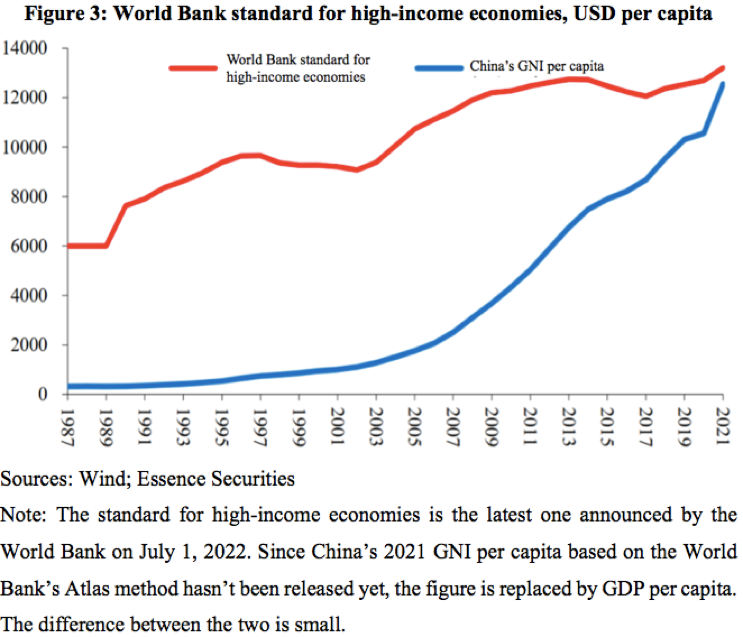
In this context, it is necessary to further evaluate the prospect of China’s long-term economic growth, on the premise of a highly possible event—China is about to pass the threshold for high-income economies defined by the World Bank.
1. China is about to pass the threshold for high-income economies defined by the World Bank
How to measure the per capita income level of an economy?
The World Bank once set different thresholds to classify world economies into low, middle, and high-income ones in 1987. The threshold for high-income economies was USD 6,000 per capita (unadjusted for inflation). Thereafter, the World Bank used a weighted average of the GDP deflators of China, Japan, the United Kingdom, the United States, and the Euro Area to adjust for inflation for the income classification thresholds.
Therefore, the thresholds haven’t changed in real terms since 1987, and are in essence a fixed standard for over 30 years, as shown in Figure 2.
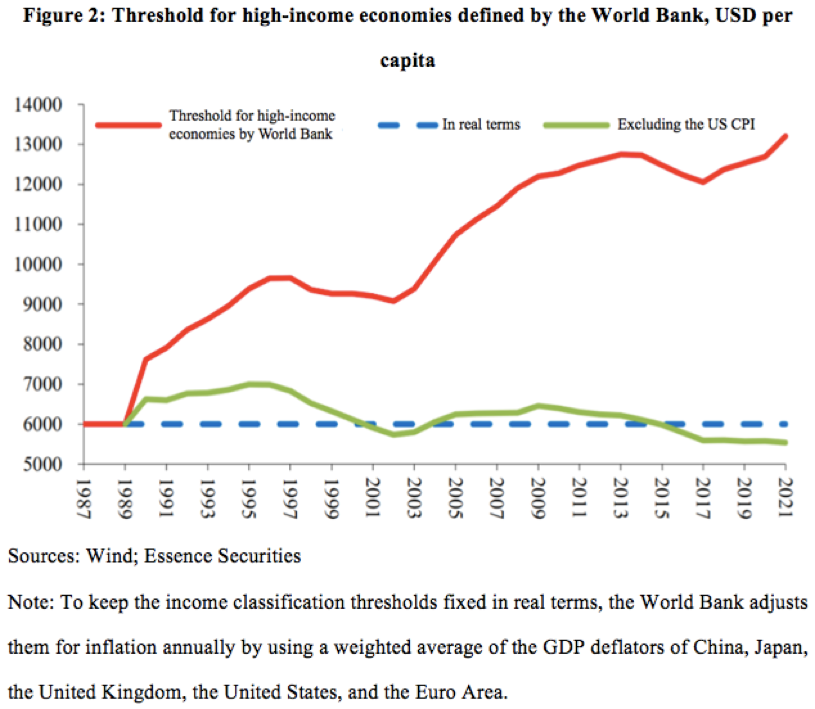
Therefore, when the standard is fixed, as long as a country can maintain long-term economic growth, it will cross the threshold for high-income economies sooner or later in theory. But in reality, the recent data show the opposite.
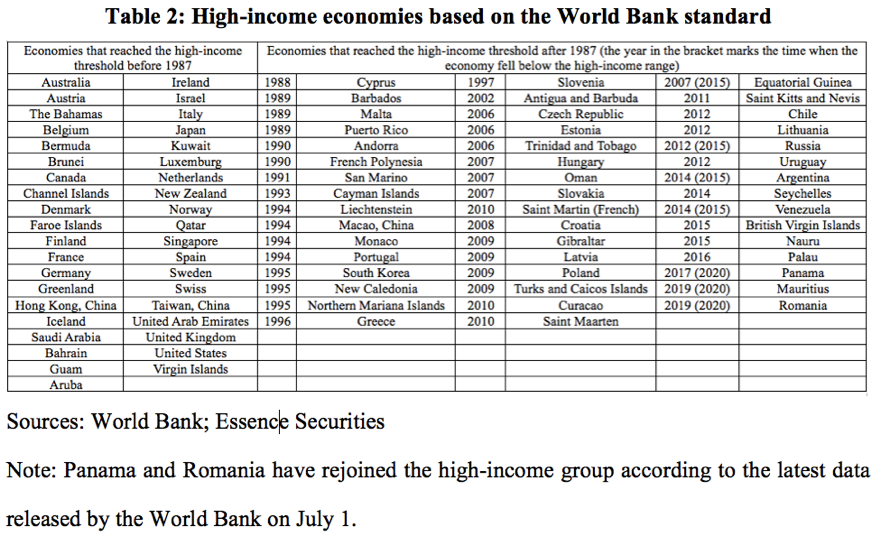
Based on the latest data released by the World Bank on July 1st, 2022, among 217 economies worldwide, only 81 of them had been identified as high-income by 2021, as shown in Table 2. This indicates that even if the thresholds are fixed, the majority of economies so far haven’t moved up to the high-income category.
Numerically, though some 37% of economies have been in the high-income group, 27 of them (12.4%) have less than 1 million population. The population of the high-income group accounts for 15.7% of the world’s total and the combined GDP represents 63.1% of the world’s total. This means around 6/7 of the world population still live at or below the standard of middle-income countries.
Therefore, demographically, although the threshold for high-income economies set by the World Bank is not too high and remains unchanged in real terms, most of the world population still lives below the level.
2. The desired economic growth for China to become a moderately developed country by 2035
Given that China’s per capita GDP has been very close to the high-income threshold, the Chinese government and market participants set a more forward-looking goal of making China a moderately developed country by 2035.
What exactly is the development level of a moderately developed country?
So far, there isn’t a unified international standard and definition. As Table 3 shows, though some international organizations have given partial definitions, different organizations have different focuses based on their organizational features.
For example, when taking into account “hard indicators” like GDP, OECD also emphasizes values and the alignment of policies and regulations with international standards; the IMF, on the other hand, focuses more on export diversification and balance of payments; the UN values indicators like life expectancy and years of schooling.

In this context, we attempt to define "moderately developed" by comparing the GDP per capita of the members of international organizations and the economies they identify as developed, using the median or 33rd percentile of GDP per capita of different groups.
Table 4 demonstrates the specific levels of “moderately developed” based on standards of different international organizations.

Under the classification, if moderately developed countries are considered to match the median level, the GDP per capita should be around USD 40,000 per capita, or at least should not be far below USD 32,000 per capita. If we do not take into account the effects of future inflation and exchange rate, based on China's GDP per capita of USD 12,500 in 2021, it is not entirely impossible to reach the level of USD 32,000-40,000 in 2035, but it would be quite difficult.
But if we follow the World Bank’s approach by dividing developed economies into three groups (high, medium, and low) based on per capita GDP and use the medium group (the 33rd percentile) as the lower limit for moderately developed economies, the threshold would be around USD 23,000-32,000 per capita.
Considering sample differences in different groups and China’s own goal of doubling its per capita income, the criteria for "reaching the level of moderately developed countries" as we understand is GDP per capita of US 25,000 (in real terms) by 2035.
As Table 5 shows, based on the starting point of USD 12,500 per capita in 2021, the average annual compound real GDP growth rate required to reach the threshold of USD 25,000 per capita over the next 14 years is about 5%.
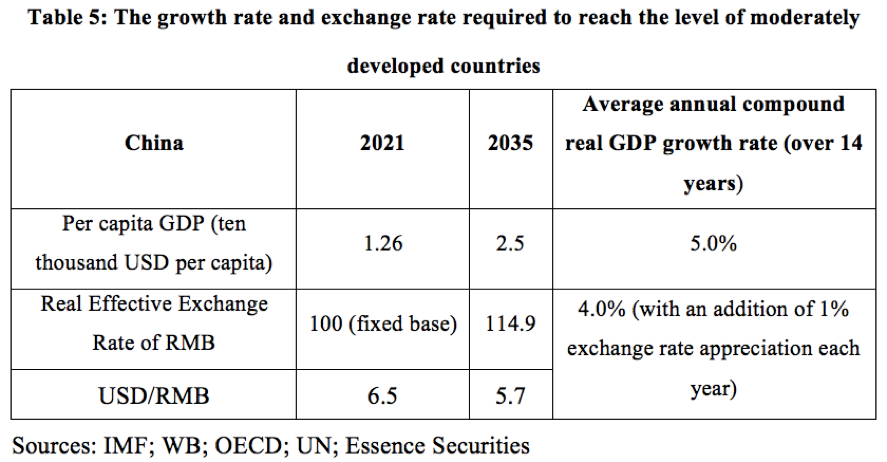
Some scholars and market participants think that it is possible to achieve a 5% long-term growth rate, but it would take a lot of efforts. However, as per capita GDP is denominated in dollar, the calculation should also factor in the impact of exchange rate.
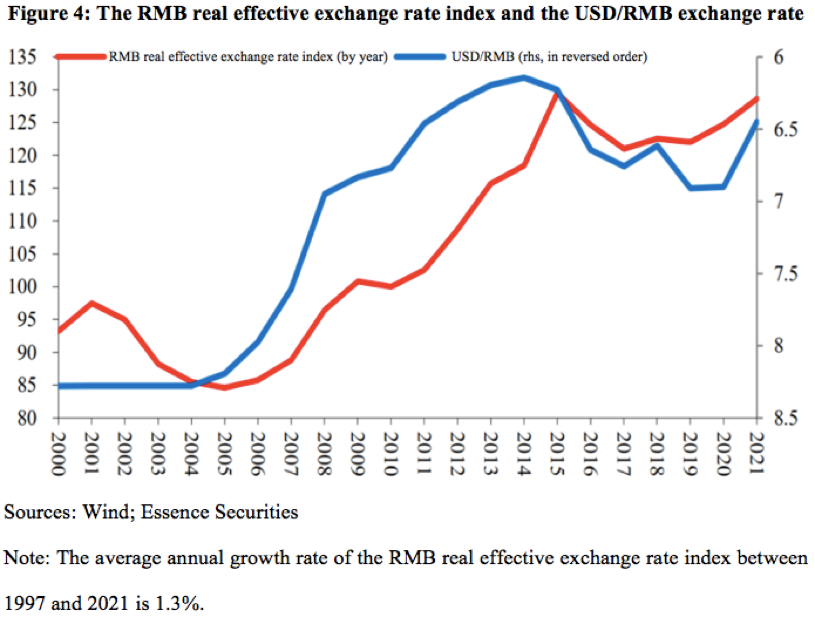
As shown in Figure 4, after adjustment for inflation, the RMB real effective exchange rate index has maintained an average annual growth rate of over 1.3% in the past 20 years, which reflects the influence of many factors such as the continued rise in China's international competitiveness and labor productivity.
If we take into account the effect of flexibility and stable wage growth in China’s labor market on future growth, RMB might continue to strengthen.
Under this condition, if by 2035, China’s compound real GDP growth rate denominated in RMB can remain at 4%, with an addition of a 1% or slightly over 1% exchange rate appreciation, China can reach the threshold of moderately developed countries at USD 25,000 per capita and thus realize its goal.
3. Understanding prospects of China’s long-term economic growth by looking at the economic transformation of East Asian economies
Based on the above discussion on the criteria for moderately developed countries, the next step is to examine the long-term trends of China's economic growth.
Three years ago, we proposed a research approach, that is, to compare China's economic growth with the growth of other East Asian economies in history. This approach is based on the assumption that the process of economic growth and development is essentially an iterative one.
Especially for those catching-up economies, their economic growth will repeat the growth path experienced by economies that have already enjoyed sustained high economic and per capita income growth.
The main reason why China is placed among East Asian economies is that it has very similar cultural backgrounds and historical traditions to Japan, South Korea, and its Taiwan province.
For example, the people in these regions are very frugal, and they have the highest savings rate in the world; they are diligent, and value secular happiness; they attach great importance to education, and can rapidly accumulate human capital; they tend to respect authority and obey orders on the whole.
All of the above characteristics are conducive to economic development, because of which, these economies maintained an impressive long-term growth rate in the process of modernization.
Looking at indicators such as per capita GDP and the ratio of the secondary industry to the tertiary industry, as shown in Table 6, one can find that economic development of China in 2010 was at the same level as that of Japan around 1968, South Korea around 1991 or its Taiwan province around 1987.
Given this, China's GDP growth shows a similar trend as the above-mentioned economies. For example, China's economic slowdown in the past decade was not strange to them either.

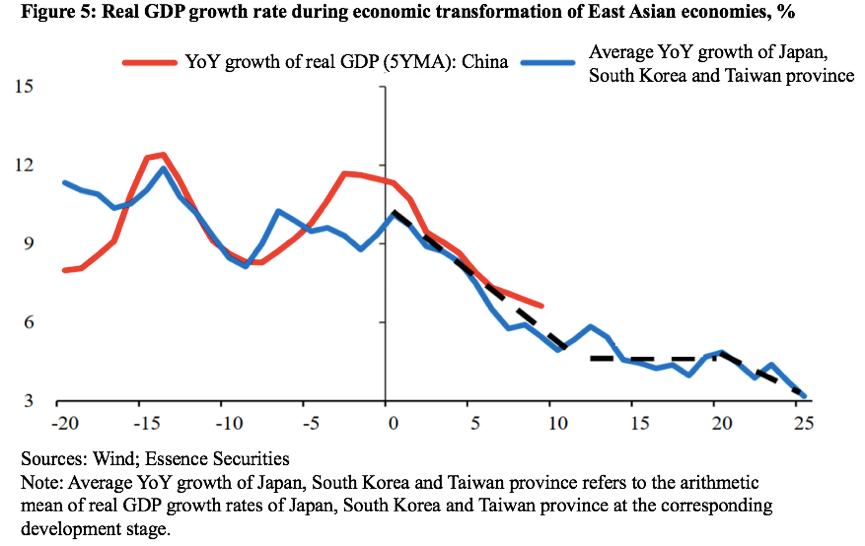
Based on the comparison, as shown in Figure 5, China's long-term economic growth will gradually fall back to the 4-5% range in 2025-2030, and may decelerate further thereafter.
As mentioned above, if China can maintain such a growth rate, it is entirely possible for the country to grow into a moderately developed country by 2035 with factors such as exchange rate appreciation being taken into consideration.
4. Response to critical opinions
Critical opinions on our forecast point out two facts which we believe are rather important and are manifested in the recent years.
First, the international environment facing China’s long-term growth is largely different from that of East Asian economies at the corresponding historical period.
As mentioned above, as of 2020, population of the high-income economies account for no more than 16% of the world’s total, and the proportion will at least double by the time China reaches the threshold of high-income countries.
From this perspective, an important difference between China and other East Asian economies is that as a super-large economy, China will have a profound impact on the international geopolitical landscape.
Although Japan encountered fierce trade frictions with the United States because of its rise in the 1980s, its influence on the international order is not of a same order of magnitude compared with China.
The rise of China will have an impact on the existing geopolitical and international order, and consequently change the international environment faced by the country's long-term economic growth. Since this change has not been given enough weight in the comparison made above, this criticism is undoubtedly justified.
The second criticism is that China is different from the aforementioned East Asian economies in the political system. In the process of catching up with more advanced economies, it is not yet clear whether the impact of this difference on economic growth will affect the comparison.
More research will be done to examine whether, and to what extent, the above-mentioned factors are going to change China’s long-term economic growth.
5. Supportive factors for continued long-term growth for a high-income economy
Based on the comparison above and the discussion of defining moderately developed countries, below is an analysis on the economies that have crossed the high-income threshold since 1987.
First, an important fact that needs to be underlined is that for economies that crossed the high income threshold after 1987, not all of them are able to sustain high growth thereafter. Despite previous economic achievements, some of them are not able to sustain long-term growth or grow into moderately developed countries.
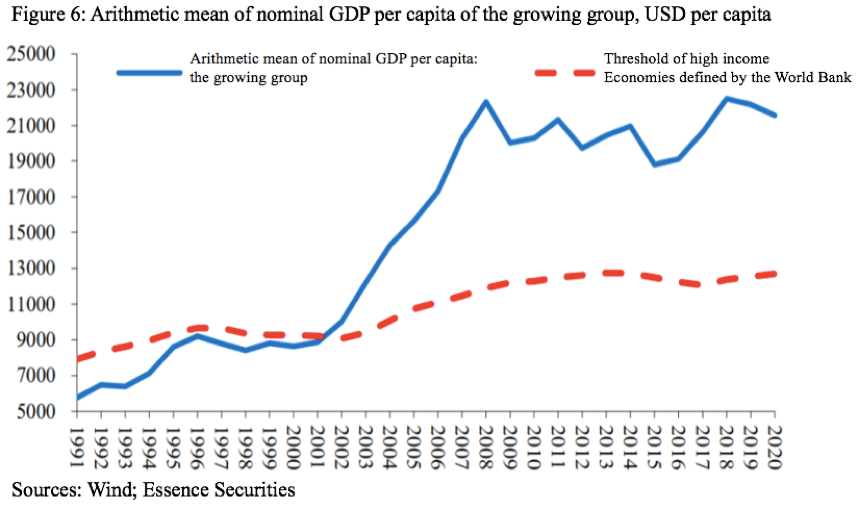
Next, we look into the long-term growth of large economies that have crossed the high income threshold since 1987 and have a population of more than 5 million. The economies are sorted into two groups according to their long-term growth rate. One group is the economies that have maintained a high growth rate after crossing the high income threshold (defined as growing group), and the other group is economies whose growth have slowed down after crossing the high income threshold (defined as stagnant group).
In terms of the nominal per capita GDP, as shown in Figure 6, the growing group can maintain a stable growth of per capita GDP over a long period after crossing the high income threshold, but the population of these economies in the sample only accounts for about 1/3, while the share of their GDP slightly surpasses 50%.
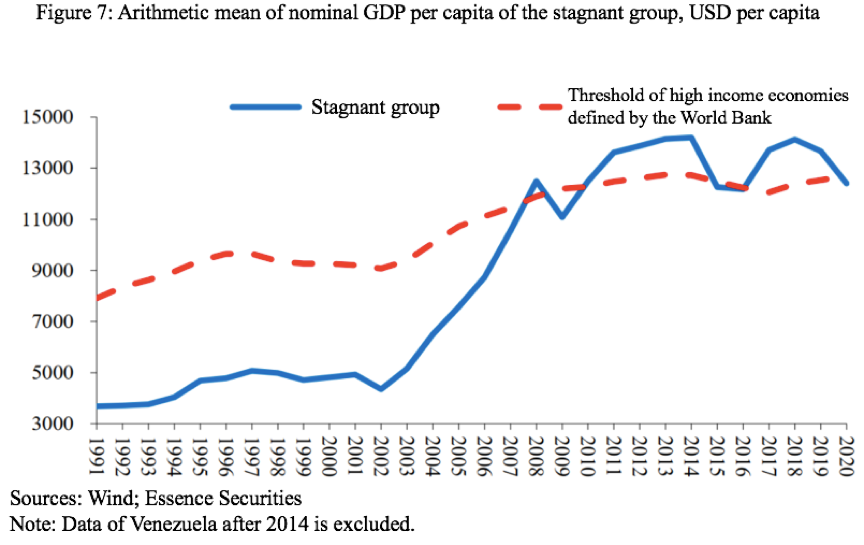
As shown in Figure 7, per capita GDP of the stagnant group has basically remained around the high income threshold defined by the World Bank, and the overall growth tends to stagnate. Population of the stagnant group accounts for about 2/3 of the sample, while the share of their GDP is slightly under 50%.
In the past, there were discussions on the middle-income trap in the Chinese academic circle. Many countries stopped growing after reaching the middle-income level, and found it difficult to cross the high-income threshold. At that time, people were concerned whether China would fall into a middle-income trap. Now the data show this won’t happen and China will soon cross the high income threshold.
However, a look into the economies that have crossed the high-income threshold since 1987 has shown that only 1/3 of them, both in terms of the number of economies and the proportion of their population, can maintain long-term growth and become moderately developed countries.
What has caused this phenomenon?
This is a complicated and open-ended question. Exploring the answers to it would be a process of envisaging the challenges that China will encounter in its endeavor to become a moderately developed country by 2035 and identifying areas that need further improvements.
To answer the question, we try to provide some quantitative observations and comparisons for reference from dimensions including institution, culture and social value.
Our research assumes that every economy that has passed the high-income threshold has done so through tremendous efforts; and if it is to maintain a relatively high growth, factors like institution, culture and value will make a bigger difference.
Our methodology is to assess the long-term growth potential of economies that passed the high-income threshold after 1987 across over 20 detailed indicators that can be roughly put into five categories.
As shown in Table 7, these five categories are: 1) the relationship of a given economy with western countries, especially the United Kingdom and the United States; 2) the level of populist activity, or to what extent has such activity been contained; 3) the level of the rule of law versus the global level; 4) level of importance attached to R&D and education; 5) level of opening to the outside world.
We have further decomposed these five categories into over 20 detailed indicators which we score using a quantitative approach. The basis for scoring is the same as used in past literatures: for example, we use the weight of R&D expenditures in GDP and the proportion of scientific researchers and patent holders in total population among other gauges to measure the level of importance attached to R&D and education, and consider factors such as foreign direct investment (FDI), capital control and tariffs when measuring the level of opening.


The quantitative descriptions above depict the institutional environment and social values of these economies after they pass the high-income threshold. We do this because we wonder if these two factors can enable sustained economic growth.
For example, many middle-income economies including those which have just passed the high-income threshold, especially those in South America and Middle/Eastern Europe are subject to strong populist sentiments because of historical, cultural or religious reasons. That is manifested as the antagonism and distrust between elites and ordinary people, which leads to the adoption of massive transfer payments or redistribution as a tactic for elites to win people over. Such social values are not favorable for achieving sustained growth on a relatively high basis.
The importance of some of the institutional factors speak for themselves, such as the degree of emphasis placed on R&D and education. China, for example, implements the long-term strategy of “invigoration through science and education”, and has stepped up R&D inputs.
Level of opening up and participation in global competition, among others, all reflect an economy’s institutional environment and social values and play a part shaping its growth.
Based on the above discussion, as Table 8 displays, we have ranked major economies which passed the high-income threshold after 1987 with a population of over 5 million based on their long-term economic growth rate, divided them into two groups which are the high-growth (growing) group and the low-growth (stagnant) group, and scored them.

We would like to stress two points about the final score.
First, samples that have managed to maintain relatively high growth after passing the high-income threshold have an average score of 80, while those that have failed to do so averaged less than 70. How is such difference manifested statistically?
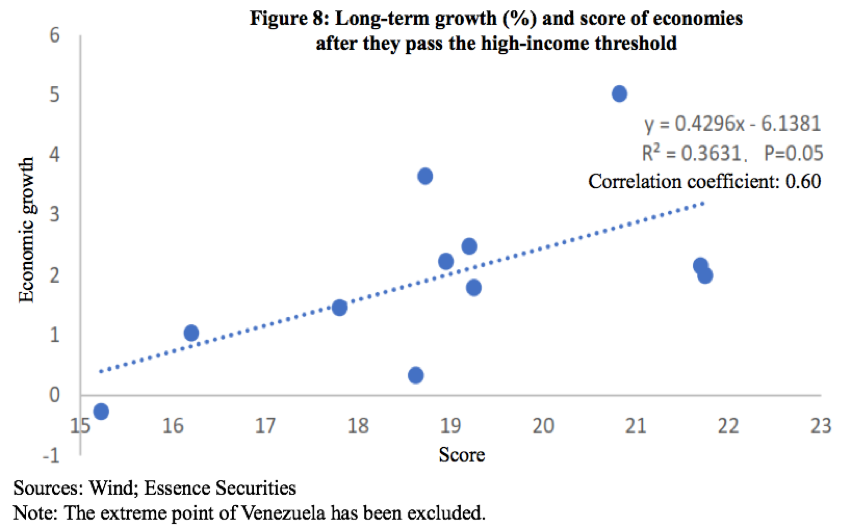
As shown in Table 9, the difference is very significant. Scores of the growing group in terms of social value and institution have been systematically higher than the stagnant group.
Thus, based on a priori knowledge, quantitative assessment of social value and institution of an economy shows consistency with the long-term economic growth results we have seen, and the difference between groups have been statistically significant.
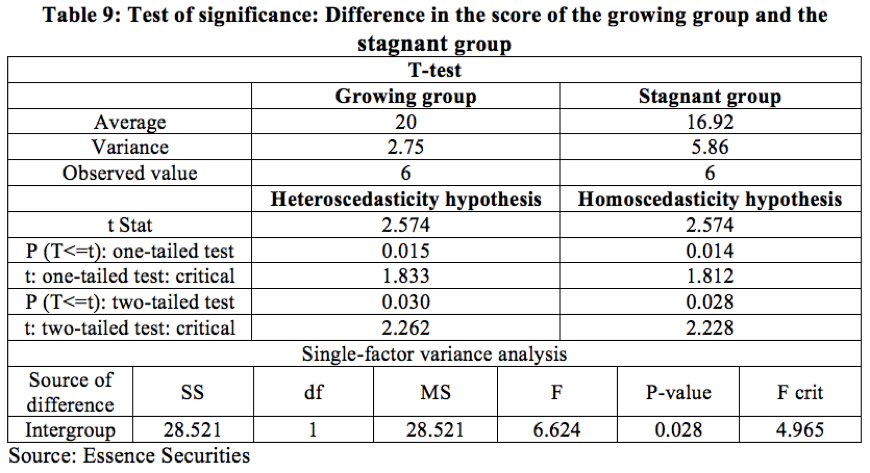
Second, if we aggregate the samples into a scatter diagram as shown in Figure 8 where the horizontal axis marks the scores of countries and the vertical axis marks their long-term economic growth, we can see that statistical indicators such as the correlation coefficient and the goodness of fit are acceptable and verified in terms of the level of significance. Hence, these scores are to a certain extent indicative of long-term economic growth.
Of particular note, the statistical results suggest that for every unit of difference in the score, the long-term economic growth would diverge by 0.4 percentage points. Therefore, institutional environment and social value among other such factors do have implications that cannot be ignored for long-term economic growth.
In addition, considering the consistency between economic growth and the exchange rate of the currency of a given economy over the long run, if an economy has high growth over the long term, its currency would usually be strong, but if it records sustained low growth, it could result in problems with the exchange rate of its currency as well.
In fact, the stagnant group in this study has both had low economic growth and problems, although to various extents, with the exchange rate of their currencies against the USD.
Therefore, adjustments in the exchange rate as a result of changes in long-term economic growth could amplify the impacts of growth on USD-denominated per capita income of an economy.

6. Test of the reliability of the scoring system with samples of economies that passed the high-income threshold before 1987
To further test the reliability of the scoring system used above, we have randomly selected samples of high-income economies that passed the threshold before 1987 (“first-mover” group, the UK and the US excluded) and used the same method to score them.
To avoid disruption from the addition of new samples on the scores of the original samples, we select one new sample at a time. We then compare it with the 12 original samples and score it. Considering the comparability of stages of economic development, we score new samples with statistics during the 1970s and the 1990s where accessible.
(1) Relationship with western countries
First, we measure the level of reliance on foreign trade with western countries with the share of imports/exports from/to the US and EU in total imports/exports of the sample economy. For example, this share of Netherlands and Germany is around 66%, ranking No. 6-7 among the first 12 samples, and so we score them 0.7 out of 1.
Second, we measure the closeness of ties by looking at whether a sample is a member of the OECD or the EU. Members are scored 1.5 and non-members are scored 0.75; observer countries are scored 1.35 (such as Singapore and Chinese Taiwan), and key partners are scored 1.2 (such as Brazil and China).
Third, we gauge military ties with western countries with the share of arms imported from western countries (Russia, Israel, Turkey and Japan excluded) in total arms import of an economy, which is commonly used in international relations literature to measure the level of military interaction or intimacy between two countries. We derive statistics from the Stockholm International Peace Research Institute. Results show that first-mover economies have imported almost all of their arms from major western countries especially the US, Germany, the UK and France.
Fourth, we measure the level of cultural closeness of samples with western countries by looking at the equally weighted average of the share of Christians in total population and the share of Protestants in total population. We look separately at Protestants because that would avoid overestimating cultural closeness because of excessively high proportion of Catholics and Orthodox Christians to better balance the relationship with the US and the UK.
In addition, we have referred to some of the indicators measuring public attitude toward the US used by the Pew Research Center when assessing the relationship between samples and western countries, and the rankings thusly derived have been similar to rankings based on indicators said above.
(2) Populism (reverse scoring)
While the correlation between populism and long-term economic growth has been complicated, it’s generally believed to be a negative one. So, we give lower scores to samples with higher level of populism.
First, we measure the absolute level of populism with the share of votes of populist political parties in parliamentary/congressional elections, excluding undue influence. Data is from TIMBRO.
Second, we measure the increase in the populism of the sample by the change in the share of votes of populist parties. For example, when a populist party becomes a ruling party, the score will decline. When the level of populism has remained high, as in South America, the increase in populism is actually weaker than that of some Eastern Europe like Poland, so the score of South America in this item is not too low.
Third, we measure the populist tendency of the sample government by the proportion of welfare expenditure in fiscal expenditure. Welfare expenditure is mainly for social security and unemployment relief. Similar to the logic behind other indicators such as fiscal expenditure/GDP and government debt/GDP, it is based on the assumptions that populist governments tend to hold greater control over the economic resources of the whole society.
(3) Rule of law
First, the World Justice Project (WJP) Rule of Law Index, which is commonly used in international literature, is used to quantify the level of the rule of law of the sample. The Index is composed of 9 factors, incorporating both substantive and procedural elements: Constraints on Government Powers, Absence of Corruption, Open Government, Fundamental Rights, Order and Security, Regulatory Enforcement, Civil Justice, Criminal Justice, and Informal Justice.
Second, we use the Rule of Law indicator of the World Bank Worldwide Governance Indicators (WGI) to measure the perceptions of the extent to which agents have confidence in and adhere to social rules, particularly the quality of contract enforcement, property rights, police and courts, crime and violence. It highlights the score weight of contract spirit and property rights protection, which makes a slight distinction with the WJP Rule of Law Index.
Third, we adopt the Gallup’s Law and Order Index released by the survey agency Gallup, which focuses on measuring public order and residents' sense of security.
(4) R&D and education
First, we measure how much importance the sample attaches to R&D investment by R&D expenditure/GDP, which is the most commonly used indicator in the literature.
Second, education expenditure/fiscal expenditure is used to measure how much importance the sample government attaches to education.
Third, we assess the human resource training of the sample by the proportion of companies that provide training in the World Bank's Doing Business Report. We assign a score of the 66th percentile to the sample when the data is missing.
Fourth, we measure the sci-tech talent reserve of the sample by the number of scientific researchers per million people.
Fifth, we measure technological innovation through the number of patent grants per million people, which is different from the number of patent applications.
(5) Economic openness
First, we measure the sample's participation in global trade by the ratio of total import and export volume to GDP, an indicator commonly used in the literature.
Second, we measure the sample’s utilization of foreign direct investment (FDI) and overseas direct investment (ODI) by the ratio of FDI/ODI flow to fixed asset investment and total FDI/ODI to GDP. The samples are ranked and scored according to the two indicators and then added together.
Third, we use the Ka_open index commonly used in the literature to measure the openness of the sample’s de jure capital account. Based on Chinn-Ito, the index is a quantitative adjustment to IMF’s Annual Report on Exchange Arrangements and Exchange, which is usually used as a binary dummy variable in the literature, and we use its absolute mean value before transformation in scoring and ranking.
Fourth, we use the weighted average applicable tax rate for all products published by the World Bank to measure the tariff level of the sample. Generally, the lower the tariff level, the more opening the domestic commodity market of the sample, and the higher the score.
In addition, we also refer to the rank of Business Enabling Environment (BEE) by the World Bank but did not include it in the score because its release was suspended in 2021.
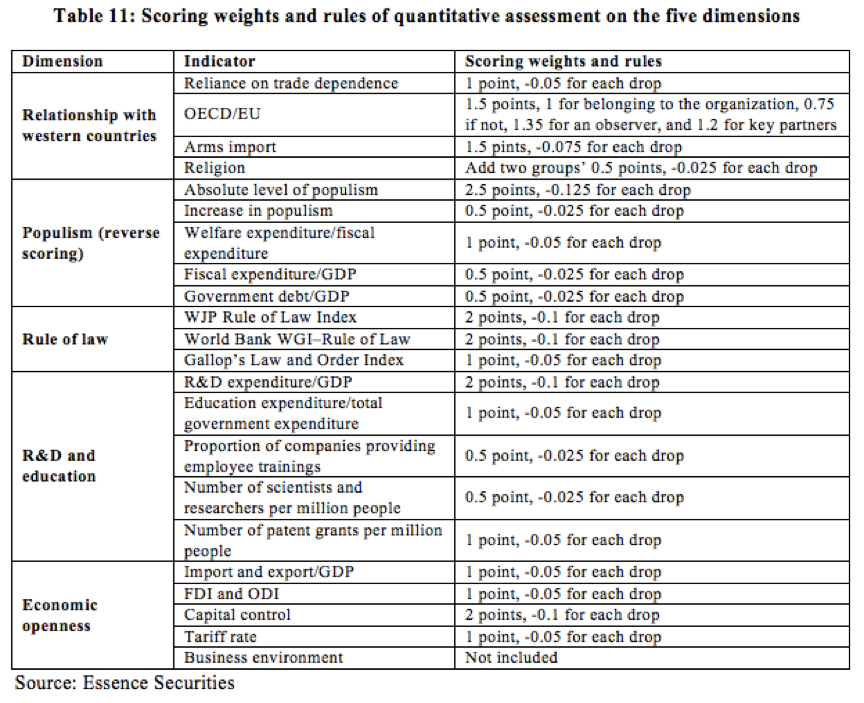
As shown in Table 11, the above five dimensions are assigned the same weight, each with a full score of 5, but the weights of the indicators are different for each dimension. The weight of the score of some indicators with GDP as the denominator is reduced to avoid the excessive influence of the size of the economy; and that of some widely applied indicators compiled by international organizations is increased to enhance the reliability of the scoring. In the deduction range of the ranking interval, 1/20 of the full score of each item is deducted for each drop in ranking (that is, under the 1-point system, 0.05 points will be deducted for each drop), so that the score gap is not too large.
To avoid the randomness associated with the use of annual indicators or scores, we widely apply the average time span of about 15 years as the ranking basis and make a chronological distinction between different groups to avoid overestimation of some indicators that increase over time. That is, we compare the 1970s-1990s performance of the first-mover group and the after-2000 performance of the growing group.
Under this condition, as shown in Table 12, the average score of the random samples of the first-mover group (with the US and UK excluded) is 21.1 out of a full score of 25. Even when the upper limit of the score is constrained, it is still 1.1 points higher than that of the growing group. In terms of the performance of indicators, as shown in Table 13, the first-mover group is significantly ahead of the growing group in terms of “rule of law” and “R&D and education”, but its scores are close to the growing group in terms of “relationship with western countries”, “economic openness”, and “populism”. As shown in Table 14, the one-tailed test showed that the difference in group scores was statistically significant, indicating that the overall score of the first-mover group was systemically higher than that of the growing group, which may explain the good economic growth performance of the first-mover group.


7. Comparison of scores of East Asian economies
Considering the similarities in the development and transformation process of China and other East Asian economies, we conduct the same quantitative evaluation and comparison among Japan, South Korea, and Chinese Taiwan.
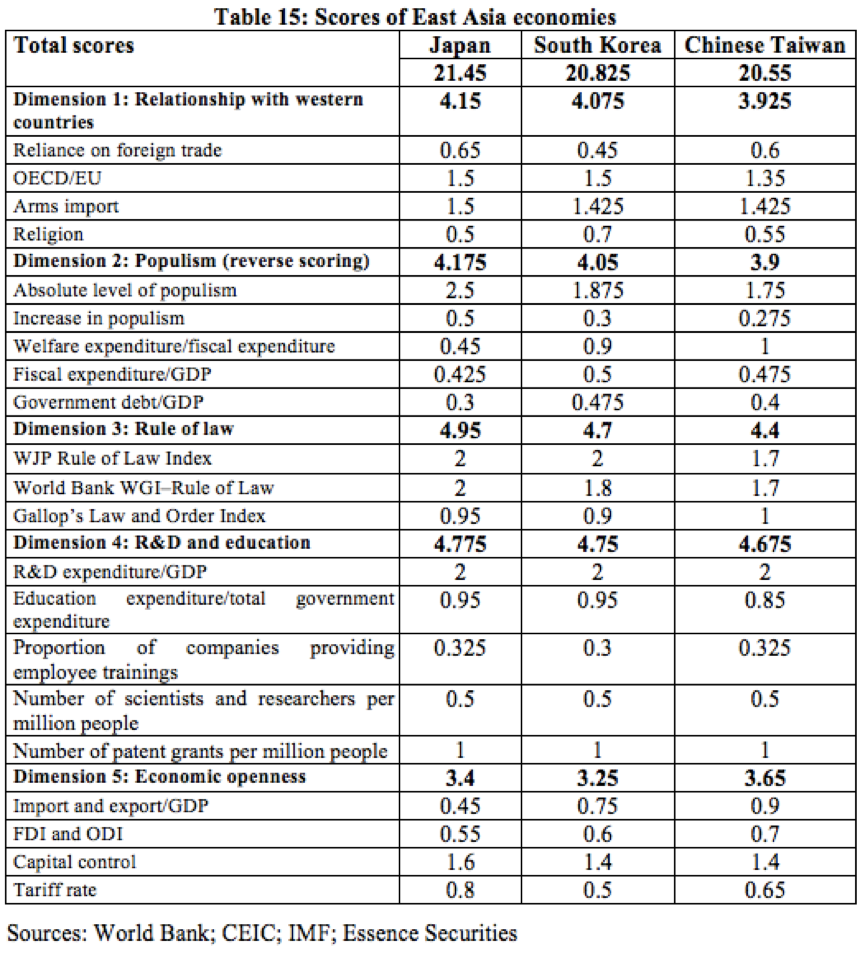
As shown in Table 15, the East Asian group generally underperforms the first-mover group but outperforms the growing group.
Japan (21.45) exceeds the average score of the first-mover group (21.1). South Korea (20.8) and Chinese Taiwan (20.6) are also quite close to this average.
Further scoring and comparison of the first-move group, Japan and South Korea, and Chinese Taiwan shows that it seems feasible to evaluate the potential of the economy to maintain long-term growth in the high-income stage from the perspectives of institutional environment and social value orientation.
Applying the same standard, we find that China's scores in some items are outstanding, while there are gaps in some other items.
8. More efforts are needed for China to become a moderately developed country in 2035
One major inspiration from the aforementioned research, should there be any, is that from present to 2035, China will have to maintain a high level of economic growth to reach the threshold of moderately developed countries. In that case, the country will have a lot of work to do in terms of institution and social value.
In popular terms, the Chinese economy is shifting from high-speed growth to high-quality growth, which requires a high level of institutional support.
In the long run, it is highly possible for China to achieve high economic growth after crossing the high-income threshold, as other East Asian economies have shown.
However, from historical experience, it is not guaranteed, nor does it mean that it will be achieved without doing any work now. Only 1/3 of the economies that have passed the high-income threshold after 1987, have so far been able to maintain growth and even cross the threshold of moderately developed countries.
Therefore, only by prioritizing economic development, enhancing the rule of law, deepening economic openness, and improving institutional arrangements, can China achieve prolonged economic growth and reach the level of moderately developed countries in 2035.
The long-term prosperity of the stock market depends on the ability of the economy to keep producing great companies. We drew the same conclusion in our last year's strategy meeting on the history of the Chinese market over the past decade. In the long run, only listed companies that can achieve continuous growth can achieve higher returns.
A-share listed companies used to consist of low-growth industries and state-owned enterprises, but now most of them are medium- and high-growth industries and private enterprises. Newly listed companies that can achieve long-term growth are also taking up an increasing share in the market.
Therefore, from now to the far future, a macro environment that can maintain high economic growth, in the long run, is crucial for the continuous emergence of long-term growing listed companies, which in turn is the cornerstone of the prosperity of the stock market. Under such logic, the market's concerns about the certainty and visibility of long-term economic growth need to be taken seriously.
This article was based on the author’s speech at the mid-term strategy conference of Essence Securities on June 28, 2022. It is translated by CF40 and has not been reviewed by the author himself. The views expressed herein are the author’s own and do not represent those of CF40 or other organizations.