
Abstract: This article examines China’s economic structural transformation in the past decade based on the observations of Chinese industrial enterprises and listed companies. Industrial data show that the transformation of China’s manufacturing sector is mainly concentrated in fields that have achieved leapfrogging, such as those related to mobile Internet and new energy vehicles. Data on the listed companies suggest that the structural transformation of the Chinese economy is mainly geared towards high-end manufacturing and consumer services.
Since 2010, China has entered a prolonged economic slowdown, which put the country under continuous pressure to shift from a growth model driven by export and investment to one that is driven more by domestic demand and consumption, and to move its manufacturing up the value chain.
We seek to provide a data-based evaluation of China’s economic transformation over the past decade or so and summarize the characteristics from two aspects. To this aim, we use two data samples. First, we look at China's industrial (mainly manufacturing) data to examine how Chinese industrial enterprises transform to high-end manufacturing. Second, based on data of all Chinese listed companies, we observe the changes in economic activities at the manufacturing and service levels.
I. STRUCTURAL TRANSFORMATION OF THE CHINESE ECONOMY: OBSERVATIONS ON THE INDUSTRIAL SECTOR
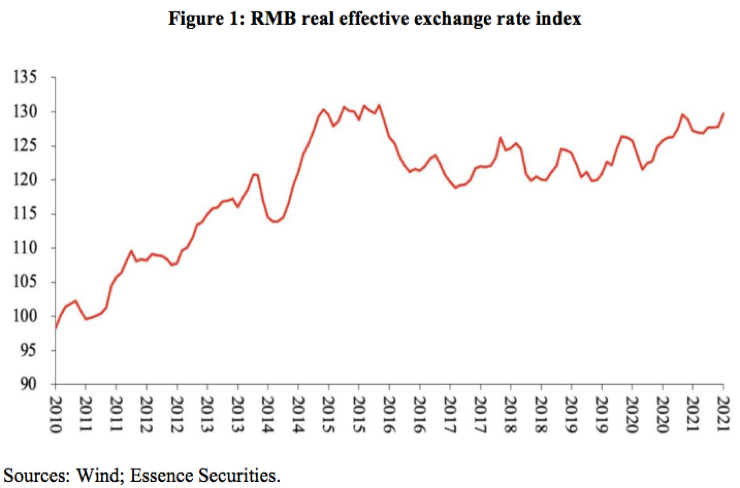
First, let’s look at the Features of China’s economic structural transformation through industrial data. Despite some fluctuations in the RMB exchange rate from 2010 to 2021 (Figure 1), the Chinese currency had remained strong against a basket of currencies, with its real effective exchange rate index rising from 100 to over 130, exhibiting a clear appreciation trend.
China’s global share of goods export and that of industrial export shipment value (Figure 2) in 2021 are much higher than the levels in 2010, despite some fluctuations in the years between. Its global share of the industrial export shipment value in 2010 was less than 9% but skyrocketed to over 12% in 2021.
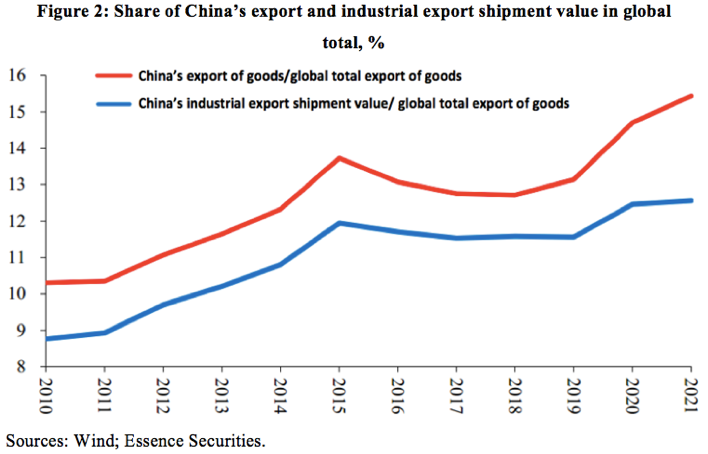
Combining the above two data sets, I think it is fair to say that in the decade between 2010 and 2020, China's manufacturing and export have become increasingly competitive globally. On the one hand, the increasing competitiveness of these two sectors has been supporting the long-term appreciation of the RMB; on the other hand, China has maintained the expansion of its export share in the global market despite the appreciation of its currency.
From the perspective of industry structure, how was such progress achieved? A breakdown of the export shipment value by subsectors may offer some insights. Our basic assumption is that if a subsector contributes to a rising proportion of the total export shipment value, its global competitiveness is improving, and vice versa. Using export shipment value as a proxy indicator for global competitiveness is not without flaws, but through further processing of data, we believe that these flaws do not affect the general direction of the conclusions.
Considering data comparability, we observe the data of three years: 2012, 2015, and 2019. As Table 1 shows, China's export competitiveness in many subsectors declined, such as textiles, garments, railway, shipping, aerospace, and other transportation equipment manufacturing, ferrous metal smelting and calendaring (mainly steel), as well as furniture manufacturing, but the export competitiveness in other fields has been significantly improved, such as machinery and equipment, automobile manufacturing, electrical machinery, and equipment manufacturing.

To summarize the changes in China's export structure in the past decade, the improvement of China's export competitiveness is concentrated in one single sector—computer, communication, and other electronic equipment manufacturing. Its export share has increased by nearly 6 percentage points, far exceeding the sum of the increases in the share of other sectors.
Will other indicators demonstrate the same improvement in China's export competitiveness?
We divide the sectors into three groups (Figure 3)—the high-growth group, the medium-growth group, and the low-growth group—based on how fast their export competitiveness has improved. The high-growth group (red line) did not show a rapid growth until after 2014. The growth pattern of capital expenditure (Figure 4) is similar. After 2015, or in the last five years of the 10-year interval, the proportion of capital expenditure of the high-growth group in total industrial capital expenditure has also experienced a rapid expansion. The figure exceeded 50% in 2020, once reaching a high of 55%, while the other two groups had seen declines.

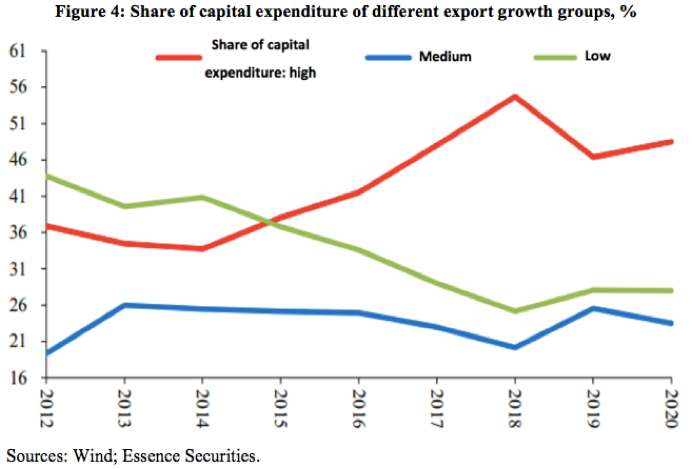
In addition, observations on profitability and many other indicators all point to a conclusion: The subsectors that experienced a rapid increase in their export competitiveness performed better in industrial value added and capital expenditure. In other words, China's manufacturing sector is undergoing transformation and upgrading towards the high-growth subsectors depicted by the top line in Figure 3, among which, the most concentrated areas of competitiveness improvement and upgrading have occurred in computer, communication, and other electronic equipment manufacturing.
From a micro lens, automobile manufacturing is also a large subsector in absolute terms, but why hasn’t it gained as much export competitiveness as the computer, communication, and other electronic equipment manufacturing?
A speculative explanation is: subsectors with significant increases in export competitiveness are typically those where technological breakthroughs put everyone on the same starting line and gave China a chance to leapfrog its more advanced counterparts. The catching-up and increase in competitiveness of Chinese firms in these subsectors is highly visible, but in subsectors that already have a mature business model, like automobile manufacturing before 2020, such gains are inconspicuous.
The most important technological change in the world in the decade between 2010 and 2020 is the mobile Internet, which on the hardware side corresponds to the emergence and wide use of smartphones, so accordingly, China's increasing competitiveness based on smartphones and accessories manufacturing stands out in the computer, communications, and electronic equipment manufacturing. The statistics shown are up to 2020, and it should be added that based on quarterly data, over the last two years, perhaps as early as 2020, but most likely sometime in 2021, with the advancements in new energy vehicle technologies, China has once again leapfrogged to the front of the race in the electric or new energy vehicle manufacturing sector. At present, the market penetration of new energy vehicles in China is around a quarter, probably the highest in the world. New energy vehicles have been able to compete with fossil fuel vehicles even without government subsidies, not to mention that their advantage over fossil fuel vehicles is expanding further as production ramps up and cost goes down—a change that is also being reflected in the stock market. If the upgrade and leapfrogging of China's manufacturing sector from 2010-2020 occurred mainly in the electronic equipment manufacturing sector, with smartphones at its core, an important sector from 2020-2023 is likely to be the new energy vehicle manufacturing. At the same time, there is no doubt that China is likely to be gaining advantages in many more areas such as photovoltaics, as can be seen through the data.
II. CHINA'S ECONOMIC STRUCTURAL TRANSFORMATION: OBSERVATIONS ON LISTED COMPANIES
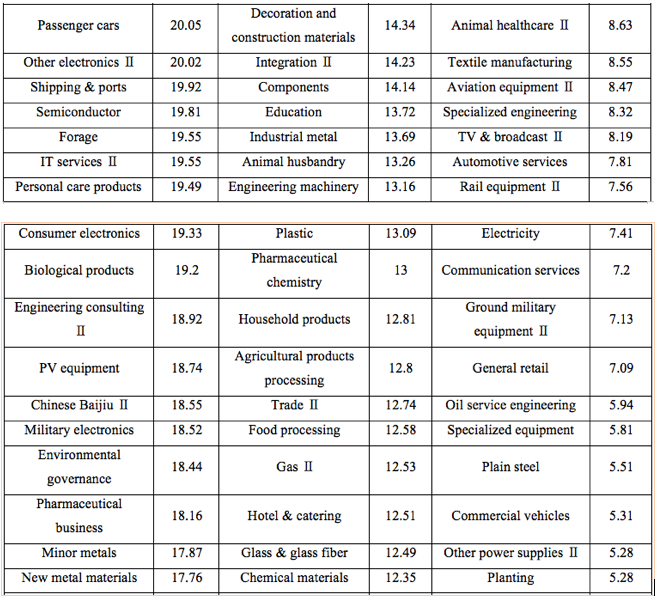
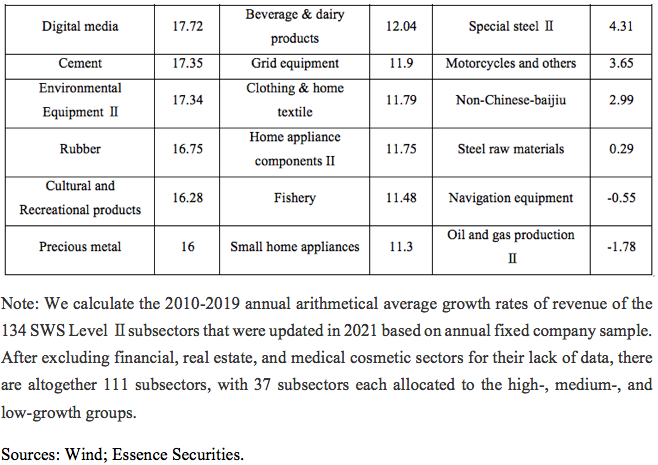
Next, let’s move on to the listed companies. Basically, listed companies are sorted into over 100 different subsectors (Table 2) and divided into high-, medium- and low growth groups based on their output growth. We believe that the high-growth group represents the areas and direction of economic structural transformation, while the low-growth group tells us which subsectors are declining. Let's first see whether this classification can be verified by other data, and then make a technical comment on the classification.
Table 2: Arithmetical average growth rate of revenue of SWS Level II subsectors over 2010-2019

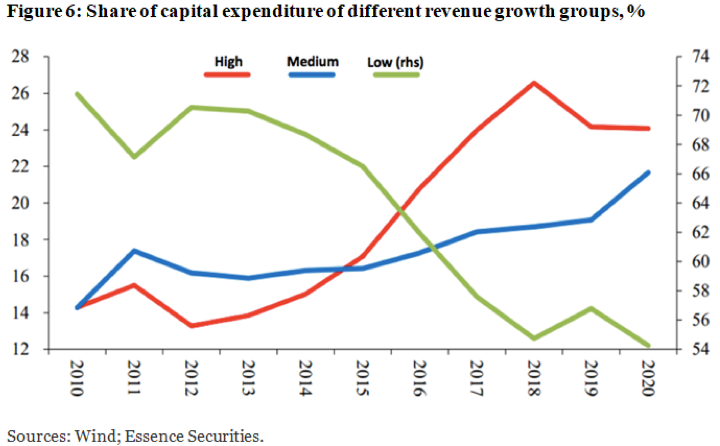
First, the value added growth of subsectors in the high-growth group is undoubtedly higher than that of other subsectors (Figure 5), and the change in the share of capital expenditure (Figure 6) also shows the same pattern. The year of 2015 marked a watershed, after which the share of capital expenditure in high-growth subsectors increased significantly, and similar trends have been observed from other aspects as well, such as stock prices.

Observations on the subsectors enable us to understand how the structural transformation of China's economy is taking place. From the perspective of industry classification, it can be seen from listed companies that structural transformation in the past ten years is mainly geared towards high-end manufacturing and consumer services (Table 3). High-end manufacturing includes many subsectors, while subsectors in traditional manufacturing have reduced compared with the past. Consumer services have a large number of subsectors, and their capacity has been expanded. In addition, some subsectors that fall into traditional manufacturing are closely related to new energy vehicles, and can be included in high-end manufacturing, such as battery and energy metals.
Table 3: Industry groups under the three revenue growth groups
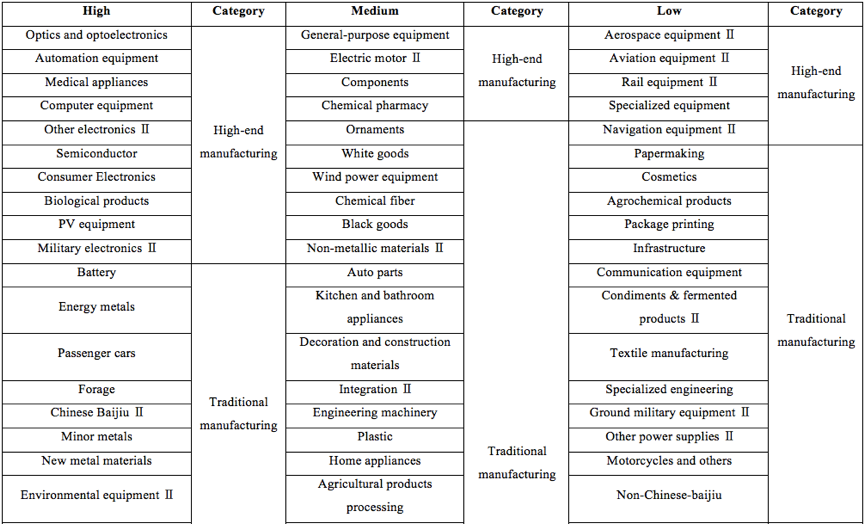
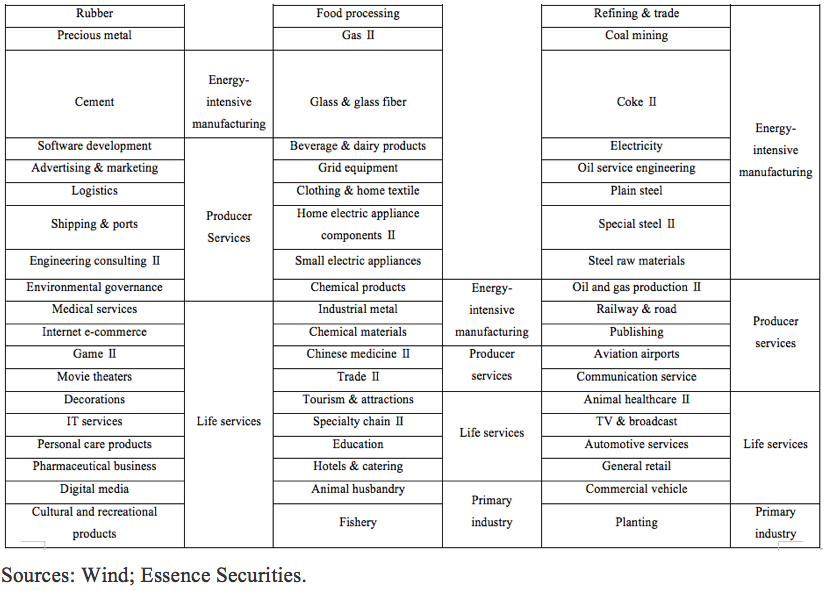
Based on the classification of the industries listed above, we can come to the same conclusion: the transformation of the manufacturing sector is mainly concentrated in the fields that have achieved leapfrogging. Some of them are related to the rise of mobile Internet, for example, optical optoelectronics, computer equipment and semiconductors. Others are related to the booming of new energy vehicles, such as energy metals and passenger car batteries.
Changes in the service sector are driven by two major factors: increasing demand brought by people’s rising income and new supply opportunities brought by technological progress. This can be felt in entertainment, game, film, television and theater, interior design, personal care and digital media, among other industries.
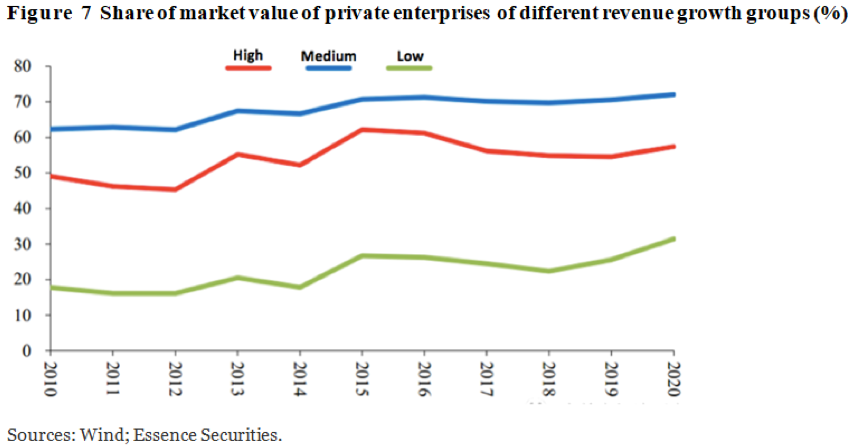
In addition, China's economic transformation has another prominent feature: it can be seen from the data of listed companies that transformation is mainly led by private enterprises (Figure 7). Private enterprises account for about 50%-60% of the market value in high-growth industries, 60%-70% in medium-growth industries, and only 20% in the industries that are declining. In other words, among listed companies, state-owned enterprises are relatively concentrated in a few declining industries, while industries that are growing rapidly are generally dominated by private enterprises. It is reasonable to conclude that to ensure the success of economic transformation, China must provide a favorable environment for private enterprises.
This article was presented by the author at Panel Discussion II “Economic Transformation and Financial Stability”, which is a part of the 13th CF40-NRI Finance Roundtable themed “A World of Drastic Changes: Global Governance and the Economies of China and Japan”, co-hosted by CF40 and Nomura Research Institute on June 18, 2022.The speech given only represents the author's opinion and does not represent the position of CF40 and the author's institution. It is translated by CF40 and has not been reviewed by the author.