Abstract: In this paper, the author examines recent changes in the expenditure structure and balance sheets of China’s household sector and points out that decreased long-term expectations and rising uncertainty with future income have caused the changes.
China’s household sector has faced an increasingly complex economic environment since the third quarter of 2021. First, profound adjustment in the real estate sector has weakened the macroeconomic prospects. Second, the service sector has come under pressure from regulatory tightening. Third, major metropolitan areas have been stricken by the resurgence of covid since early 2022.
Amid the complex economic environment, the relatively stable behavior pattern established by the household sector over the past decade or so is changing. This paper examines the change from three aspects, namely expenditure, liabilities and assets of households, and refute some popular explanations for the change.
I. EXPENDITURE: WHILE THE OVERALL CONSUMPTION REMAINS SLUGGISH, THE PROPORTION OF CONSUMPTION OF AUTOMOBILES HAS DROPPED SHARPLY
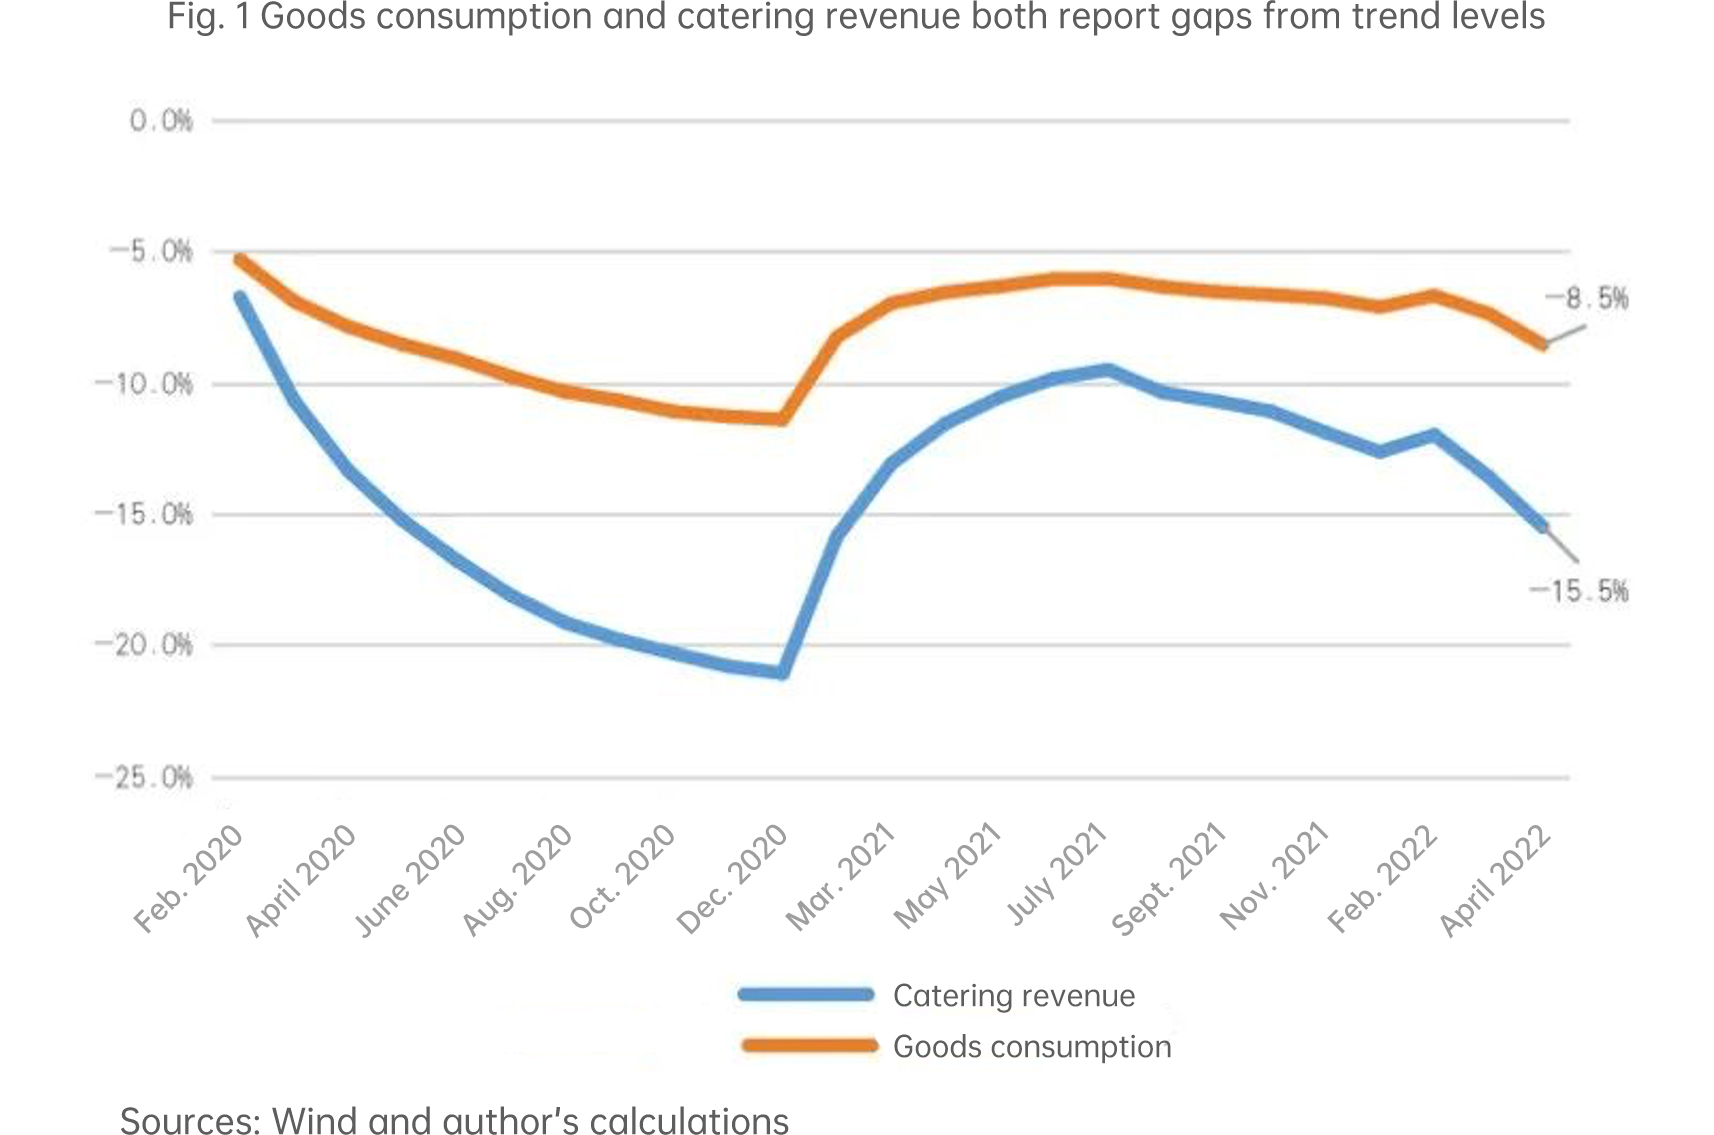
A look at household expenditures shows that consumption has remained sluggish. Both goods consumption and service consumption (represented by catering revenue) have reported expanded gaps from trend levels.
As shown in Figure 1, goods consumption records a gap of -8.5% from the trend level in April 2022, while catering revenue -15.5%.

What is more noteworthy is the obvious change in the consumption structure. The key change is that the proportion of the sales of automobiles, the typical durable goods, in consumption has declined sharply.
As shown in Figure 2, the share of automobiles sales in goods consumption dropped significantly in April, 2.5 percentage points lower than the average for the same period during 2018-2021. The existing popular explanatory frameworks are not able to sufficiently explain this structural change.

First, it is difficult to attribute this structural effect to the decline in income. Even taking into account the differences in income elasticity of different types of goods, it is clear that the decline in income in April is no greater than in that 2020, but 2020 did not see similar changes. More importantly, the sales of household appliances and communication equipment, which are also durable goods, have not undergone such changes, that is, the proportion of overall durable goods consumption after excluding automobiles has remained basically stable, even slightly higher than the level of the same period in 2020.
Secondly, pandemic control measures have affected consumption, but not sufficiently to have caused the degree of decline as has been seen. A basic fact is that the areas affected by this round of pandemic control are smaller than those in March 2020. Though a similar situation occurred in March 2020, at that time the decline of the proportion was by about 1 percentage point. This time the shock was notably larger.
Finally, the reduction in automobile production caused by disruptions of logistics and supply chains may explain the part of decline. However, the supply of automobile chips has seen bottlenecks since June 2021, and it has not completely recovered yet. This impact started to be felt since August 2021, and can explain the decline of about 0.5 points.
In addition, in the comparison we apply the average value from 2018 to 2021, covering periods both before and after the outbreak of the pandemic. In theory, the data have absorbed all kinds of supply and demand shocks that occurred. Therefore, beyond the above mentioned causes, we need to examine longer-term factors in order to understand the change in expenditure structure.
II. HOUSEHOLD LIABILITIES: THE HOUSEHOLD SECTOR IS REDUCING THE SCALE AND DURATION OF LIABILITIES
Credit data for April shows that the household sector began to see net debt repayments, a phenomenon that has sparked widespread discussions in the market.
In fact, we can clearly see that the scale of new loans to the household sector has fallen rapidly since the third quarter of 2021, and the decline accelerated in the first quarter of 2022. Structurally, long-term consumer loans declined significantly faster than short-term ones. In other words, the household sector is reducing the duration as well as the scale of debt.

Regarding these changes, the first explanation that can be ruled out is the contraction of credit supply. If a supply-side factor is the cause, after the tightening of mortgage loans in April 2017, decline in long-term consumer loans has been made up by a surge in short-term consumer loans. From the demand side, if the household sector is simply to reduce the scale of debt, it is obviously easier to reduce short-term debt than long-term debt, because the latter requires balance sheet changes and the former can be easily achieved by adjusting the cash flow statement.
Compared with short-term debt, long-term debt bears longer-term pressure of debt service. As shown in Figure 4, the debt service pressure of the household sector has been increasing since 2017 as the growth of debt service expenditure has always been faster than that of wage income. According the author’s estimate, debt service expenditure accounted for more than 15% of wage income in the first quarter of 2022. Therefore, only by shortening the debt duration can the households alleviate the debt service pressure they may face in the future. In this sense, lowering the benchmark interest rate to drive the interest rate curve downward will produce the same effect, i.e. reducing the debt service pressure on the households. This will help stabilize the scale and structure of liabilities of the household sector.

III. Assets: Ratio of highly liquid safe-haven assets to rigid expenditures have increased significantly, and risk appetite fallen sharply
On the asset side, we can see two typical changes.
First, the ratio of highly liquid assets to rigid spending witnessed a systematic increase compared with pre-pandemic levels. Here, highly liquid assets refer to demand deposits and money market funds held by the household sector, while rigid spending includes consumption and debt service. The ratio of the two represents the highly liquid assets the households intend to hold for the purpose of paying for rigid spending in the event of declining cash flows. A higher ratio indicates a more unstable expectation of future income held by the household sector and its need for more highly liquid assets to deal with this uncertainty.
As shown in Figure 5, from 2009 to 2019, the ratio of liquid assets to rigid expenditures basically remained stable. The ratio was basically unchanged from 2009 to 2015. In 2016, due to the rapid increase in leverage, highly liquid assets held by the household sector took a brief dip, but in the following two years, the households quickly increased their holding of such assets and moderately reduced rigid expenditures by cutting down consumption. By the fourth quarter of 2019, the ratio had returned to the 2009 level again.

After 2020, this ratio first rose suddenly, and then declined, a phenomenon which can be attributed to the violent fluctuations in consumption growth. However, since the fourth quarter of 2021, this ratio stopped declining, but has remained at a level of about 10%-15% higher than that in 2009-2019. Looking back at the past two quarters, we can conclude that the sudden increase in this ratio is neither due to an unexpected rise in income, because there is no large-scale subsidy, nor because of a sharp reduction in consumption, because consumption has been sluggish.
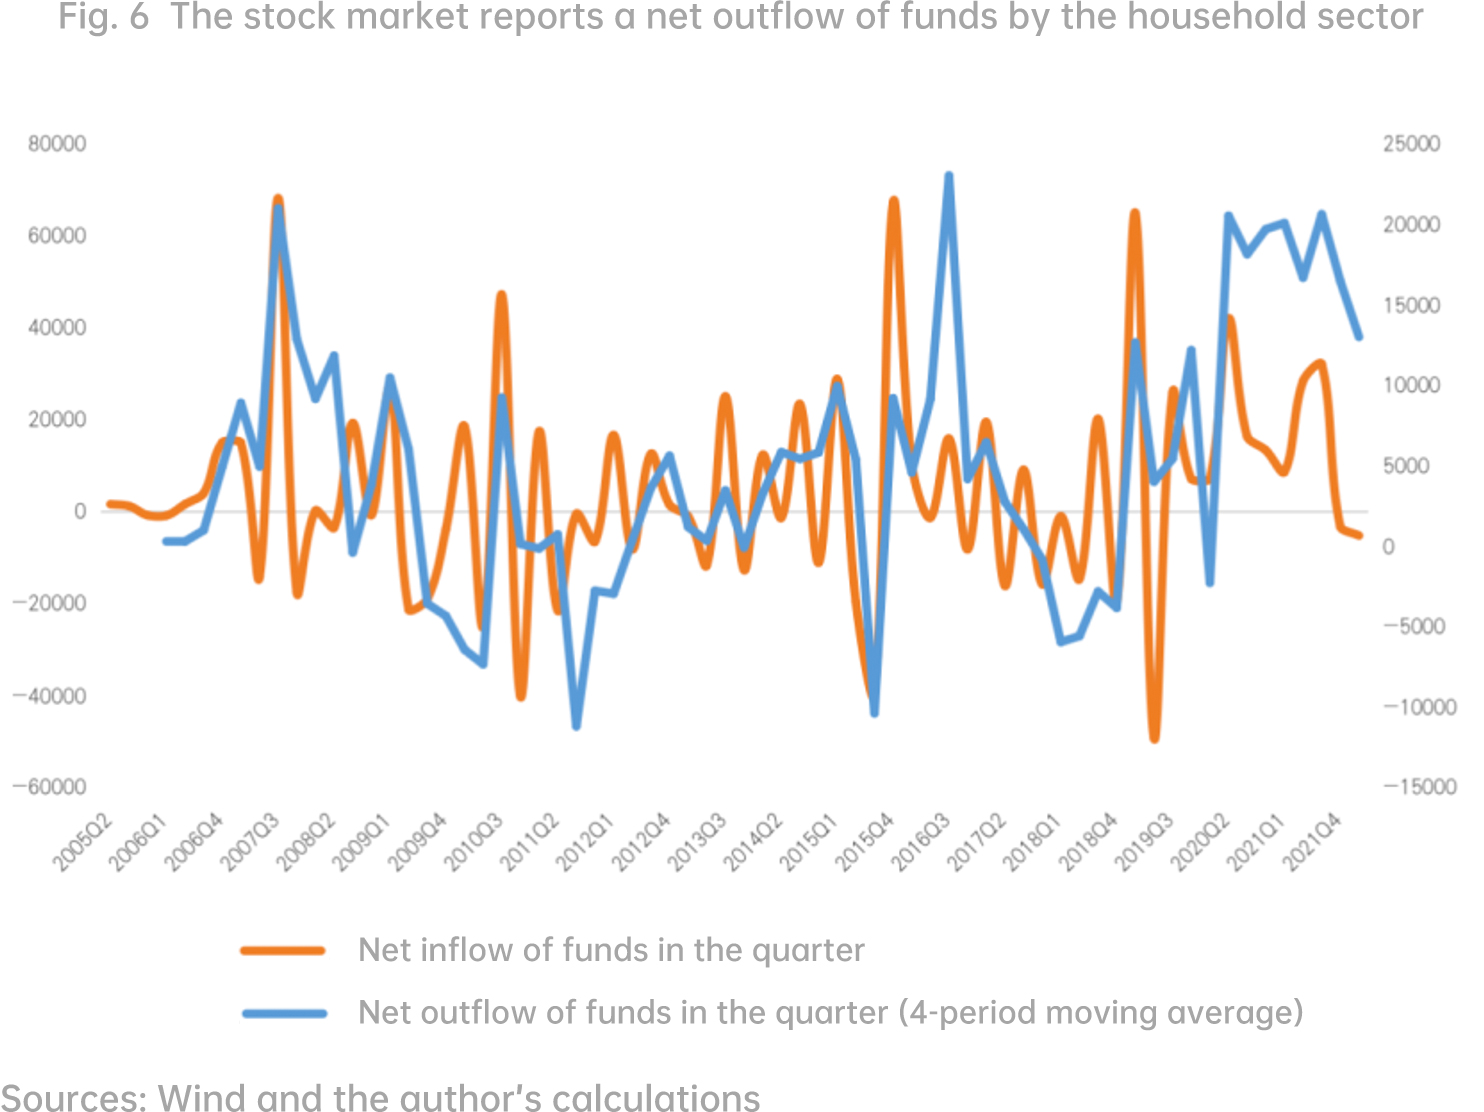
Second, in the fourth quarter of 2021 and the first quarter of 2022, the household sector reduced investment in the stock market. As shown in Figure 6, after excluding the valuation effect, the cumulative net outflow led by the household sector from the stock market was about 850 billion yuan. Historically, there were two times when the stock market reported continuous net outflows made by the household sector, respectively from the fourth quarter of 2009 to the second quarter of 2012, and from the first quarter of 2017 to the second quarter of 2018. At least until March 2022, the A-shares market had shown a widely fluctuating performance, so we can hardly attribute the net outflow for two consecutive quarters to private investors’ buying strategies. Given this and the increase in households' holdings of highly liquid safe-haven assets, it is reasonable to believe that the outflow of funds from the stock market in these two quarters mainly comes from a change in investors’ risk appetite, rather than the strategy of buying the winner and selling the loser.

IV. A POSSIBLE EXPLANATION: LONG-TERM INCOME EXPECTATIONS OF THE HOUSEHOLD SECTOR ARE FALLING
To sum up, since the second half of 2021, the household sector has shown some structural changes in expenditure, liabilities side and assets, and it is difficult to explain the changes with conventional factors. Here, I wish to come up with a more systematic explanation:
The pandemic shock combined with changes in regulatory policy for the service sector since the second half of 2021 has resulted in a systematic change in households' expectation of long-term cash flow.
Specifically, while long-term income expectation of the household sector is declining, expectation of future income uncertainty is increasing. Under the combined effect of the two, the household sector has to re-examine and adjust its cash outflow arrangement and balance sheet structure.
The adjustments are as follows:
(1) Since the household sector has lowered its expectation of future cash inflows, in order to balance the intertemporal cash inflows and outflows, the household sector has become more cautious about spending that can provide long-term utility. Compared with other non-durable goods, automobiles, as a typical durable good, provide utility that will be realized over many periods in the future, which requires intertemporal decisions by the consumers. As a result, the sales of automobiles have suffered the biggest shock.
(2) The household sector should minimize future rigid expenditures, among which debt service is the top priority. Households need to reduce the scale as well as the duration of debts, in order to ease debt service pressure over the long-term.
(3) Due to the higher uncertainty with future income, it is necessary for the household sector to hold more highly liquid funds to prepare for unexpected events, and at the same time, build up asset resilience to hedge against future uncertainties. More predictable cash flows are preferred over capital appreciation.
Since the beginning of this year, the resurgence of pandemic around the country has caused periodical shocks to China’s economy. At present, the pandemic has basically subsided nationwide, the number of daily new cases has dropped significantly, and service sectors that involve contact and thus are most seriously affected are gradually recovering. It can be expected that in the coming quarter, China's economic fundamentals will show a relatively obvious quarter-on-quarter improvement, somewhat similar to the situation in the second quarter of 2020, but the strength of the recovery may be weaker this time.
More importantly, the above-mentioned structural changes will inhibit the recovery of aggregate demand in the longer term. Therefore, improving long-term expectations of the household sector as soon as possible is crucial to future recovery. To improve long-term expectations, a precondition is rolling out policies that exceed expectations in terms of strength and scope.