
Abstract: The share of real estate in the Chinese economy has entered a prolonged downturn, with house sales probably reaching an all-time peak. Over the past decade, traditional manufacturing has also been on the wane. At the same time, new services and high-end manufacturing are prospering, characterized by China’s fast catch-up with its global counterparts in areas with rapid technological upgrades; however, in mature manufacturing sectors, China has failed to meet the expectation to climb up the global value chain. From a capital market perspective, the emerging sectors have generally produced positive investment returns, while those decaying brought losses.
I. CHINA’S REAL ESTATE SECTOR IS FACING A TURNING POINT
1. Demand for real estate is peaking
Over the past two decades, the real estate market in China has maintained rapid growth, emerging as one of the most important pillars sustaining the country’s economic growth. Theoretically, the booming demand for housing can be decomposed into three parts.
First, the demand for homes from new urban residents; second, the demand for improved housing from existing urban residents; and third, the demand for house replacement from residents whose homes are no longer livable.
In view of the recent development in the Chinese real estate market, the question we should focus on now is: To what extent has the second type of demand been satisfied? And where will the real estate market go after its previous boom becomes history?
Taking a top-down perspective, we would like to share some of our observations and judgements based on macroeconomic data and calculations. Considering China’s special conditions, we first propose three working assumptions.
Assumption 1: Demand for house replacement is unlikely to surge. The market-oriented reform of the real estate market in China started in 1998, and the market began to balloon in 2000. Compared to 2000 and the following years, much fewer houses were built in 1998 and before, and the wear-and-tear of these homes was a matter of course. Considering their service life, houses that mushroomed after 2000 will not become too old to live in before 2050.
Assumption 2: Under extreme conditions, house penetration among existing urban residents has peaked, which means that all urban residents with the ability and willingness to buy a home have done so.
Assumption 3: House penetration among new urban residents is stable.
Given these assumptions, growth in the demand for houses equals the increase in new urban residents in extreme cases, and the actual growth in the demand for houses will gradually approach this extreme level.
We introduce two indicators to depict the increase in new urban residents:
The first indicator is the number of permanent urban residents. Its annual fluctuations can be interpreted as the net increase in urban population.
The second indicator is the increase in urban employment. Clear and accessible with a long sequence, this set of data mainly indicates the growth in urban job openings.
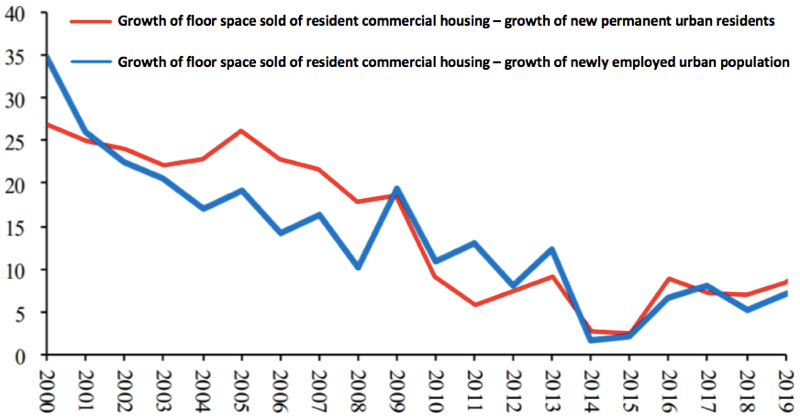
Theoretically, if we calculate the growth rate of the sold floor space of resident commercial housing and subtract the growth rate of the two indicators from it respectively, the difference thusly produced should gradually decrease and approach 0.
The actual result from the calculation, as shown in Figure 1 and 2, is close to the theoretical prediction.
Figure 1: Difference between the growth rates of floor space sold and new permanent urban residents / newly employed urban population (%, 5YMA)
Sources: Wind; Essence Securities.
Figure 2: Difference between the growth rates of floor space sold and new permanent urban residents / newly employed urban population (%, HP filter)

Sources: Wind; Essence Securities.
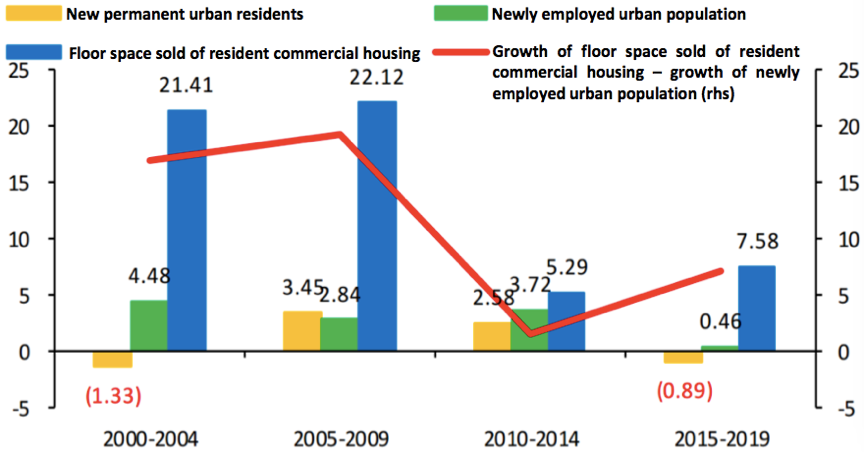
Based on the analysis, we take a closer look at the data by calculating on a 5-year basis the average growth rate of floor space sold of resident commercial housing and the growth rate of new permanent urban residents, working out their difference, and observe its trend.
Figure 3: Growth rates of new permanent urban residents, employed population and floor space sold (%, 5-year average)
Sources: Wind; Essence Securities.
Note: The average growth rate of new urban permanent residents during 2000-04 is dragged mainly by the negative record of -9.72% in 2004. This number excluded, it would average 0.77%.
As exhibited in Figure 3, during 2010-14, the difference dipped to below 2%, before bouncing back up in 2015-19.
An important reason behind may be that during 2016-18, in order to destock the real estate sector, China launched the shanty town renovation programs. This policy, while retiring old houses, boosted the demand for commercial housing.
The relaxation of monetary conditions in 2019 and the ultra-loose monetary and credit policies during the pandemic may have stimulated the short-term demand for real estate as well.
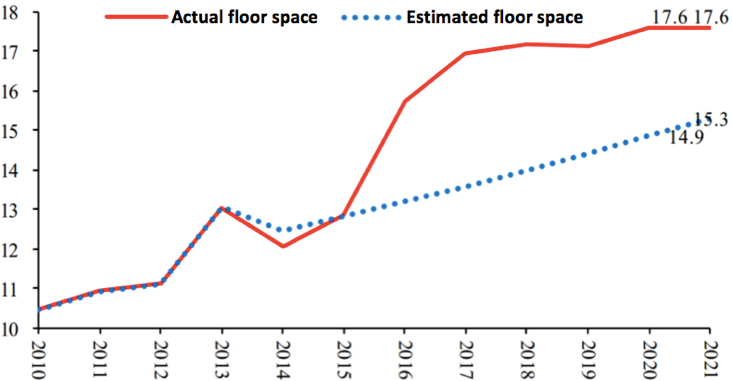
If these explanations make sense, the deviation of the house sales data in 2015-2020 from the historical trend could be deemed as one-off, unless China continues to press ahead with the renovation of shanty towns and provide massive monetary compensation.
In the long run, the floor space sold of commercial housing will gradually circle back to the trend level or even below that to adjust for the previous overgrowth.
Figure 4: Actual and estimated floor space sold of commercial housing (100 million m2)
Sources: Wind; Essence Securities.
Considering that newly employed urban population may have stopped to grow and the above-mentioned deviation from historical trend, we predict that the floor space of commercial housing of 1.76 billion square meters sold in 2020 and 2021 may prove to be the ceiling, at least in the coming years and possibly over the long run.
Is there any other evidence in support of this prediction?
We have examined the historical trajectory of the real estate markets in other East Asian economies over long-term economic growth.
Two years ago, we put forward the idea to compare China and other East Asian economies in terms of historical economic growth. This is based on the assumption that economic growth and development is a process of repetition. Particularly, less advanced economies relive the growth process that high-growth and high-income economies have experienced.
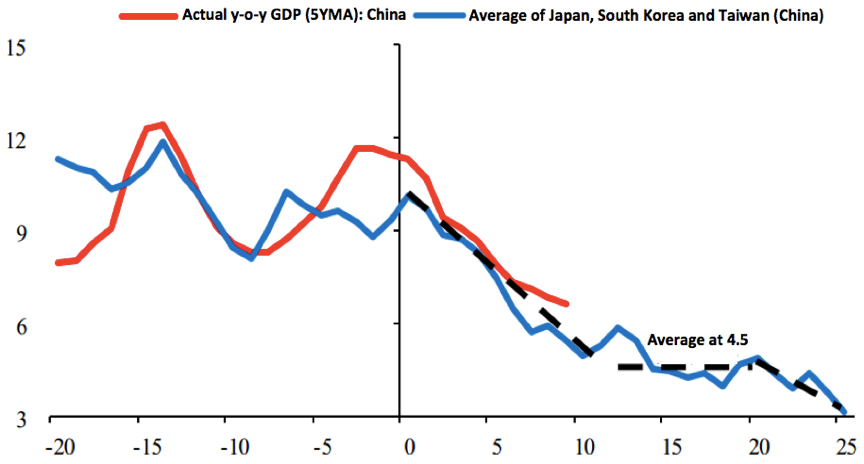
Along this line of logic, after looking at indicators such as per capita GDP and the proportion of the secondary industry relative to the tertiary industry, we find that the Chinese economy in 2010 largely matched the Japanese economy in 1968, South Korea in 1991 and Taiwan (China) in 1987. By this gauge, we have compared China’s GDP growth with that of other East Asian economies, and found similar patterns.
Table 1: China’s economic development relative to Japan, South Korea and Taiwan (China) in history

Source: Essence Securities.
Figure 5: Actual GDP growth of East Asian economies amid transformation (%)
Sources: Wind; Essence Securities.
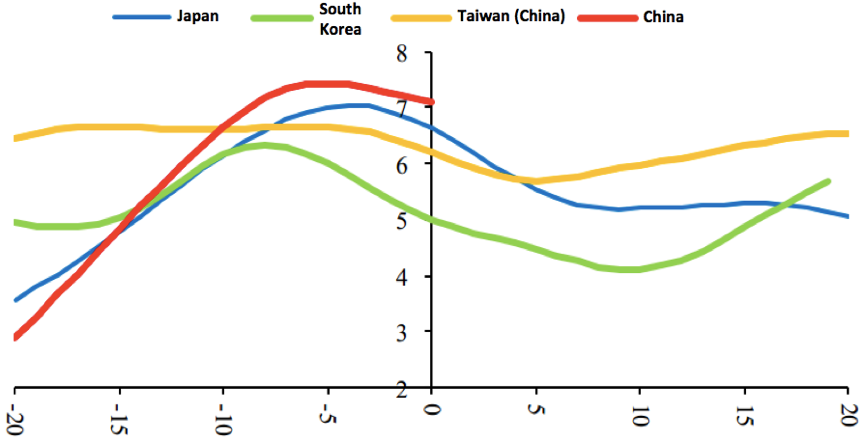
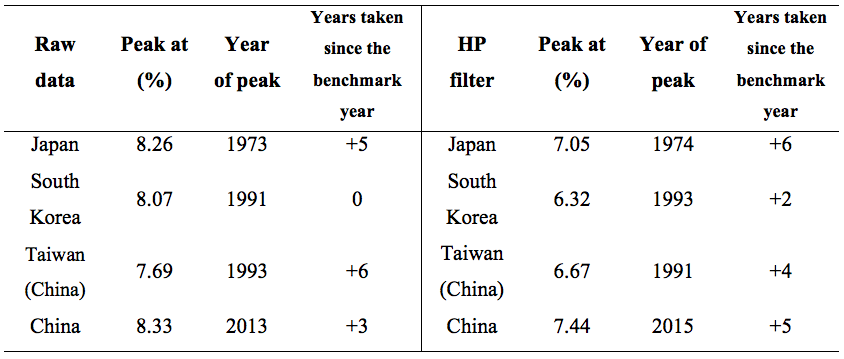
With the same method, we compare the share of resident housing investment in GDP of East Asian economies and see when they peaked. As shown in Table 2, on average, this proportion in other East Asian economies peaked in around the fourth year after the transformation started. China saw this peak at a similar stage, 5 years after the benchmark year, in 2015.
Figure 6: East Asian economies: investment in resident housing /GDP (%, HP filter)
Sources: Wind; Essence Securities.
Note: To increase the time span of the data, all benchmark years have been delayed by 10 years: 1978 for Japan, 2001 for South Korea, 1997 for Taiwan (China) and 2020 for China.
Table 2: East Asian economies: peak of investment in resident housing / GDP (%)
Sources: Wind; Essence Securities.
Benchmark year: 1968 for Japan, 1991 for South Korea, 1987 for Taiwan (China), 2010 for China
With regard to the long-term outlook of China’s real estate market, all of the statistics, whether of China’s own or by international comparison, lead to the following conclusion: investment in resident housing as a share of GDP in China peaked back in around 2015; given its continuous downfall and the secular slowdown of China’s GDP growth, it is estimated that growth of investment in houses and home sales will remain low for a long time to come.
2. Real estate developers face the need for business model transformation
In the recent two years, the Chinese government has stepped up efforts to promote the deleveraging of real estate developers, which have had significant impacts on their financing abilities. The heightened liquidity pressure on the Chinese real estate sector in the second half of 2021 was also partly attributed to this move.
Again, in a top-down view, let’s look back at the business model transformations that real estate developers have experienced in the past years.
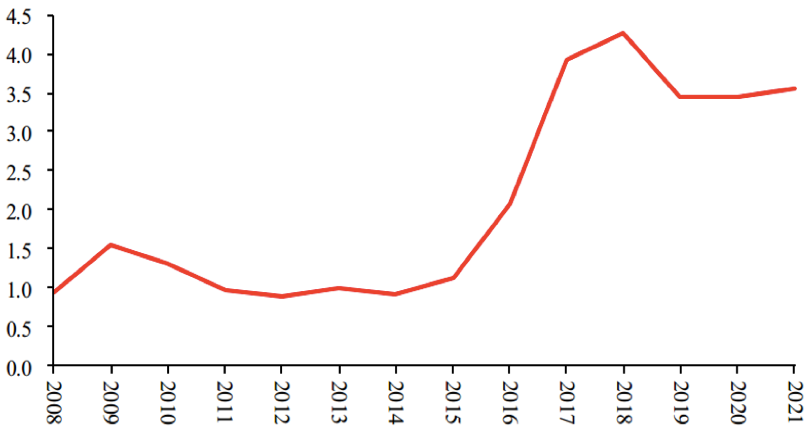
As Figure 7 suggests, data on the turnover of resident commercial housing in stock (as measured by the accumulated floor space of houses started but unsold) indicates that 2015 was an important turning point. Before 2015, the turnover was generally low; but after that, it increased substantially.
Figure 7: Estimated turnover of resident commercial housing in stock (%)
Sources: Wind; Essence Securities.
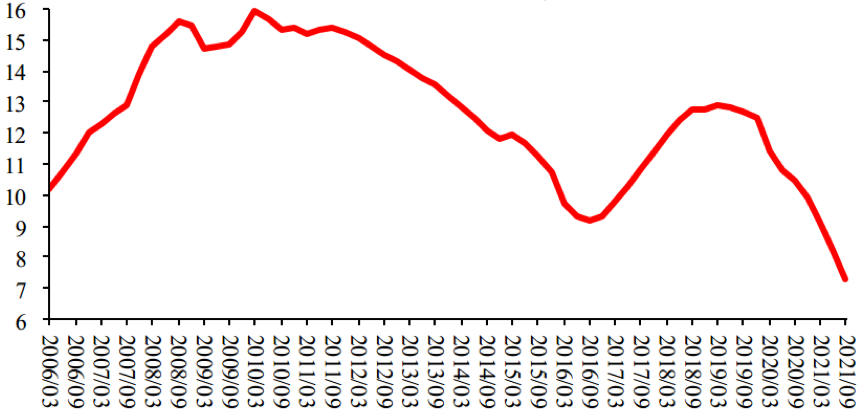
2015 also marked a turning point for the real estate sector in terms of net profit margin on sales, as illustrated in Figure 8. The net profit margin once averaged at a relatively high level, until 2015 when it began to sink.
Figure 8: Net profit margin on sales of the real estate sector (4Q, TTM, %)
Sources: Wind; Essence Securities.
Note: The industry classification by SWS Research serves as the statistical basis here.
This indicates that before 2015, the most prevailing business model in the real estate sector was “stockpiling”. With house prices expected to be on a continuous upward ride, the longer houses were kept in stock, the higher the gains from the price difference. This, together with the high leverage ratio, served as the pillar sustaining the ROE of real estate developers in China.
But this model was replaced by one featuring high turnover after 2015. What has caused this transformation?
It was partly due to the fact that the vulnerability related to stockpiling became more pronounced with intensified and increasingly fragmented regulations of the real estate market. To better predict and manage their sales, real estate developers turned to accelerated house sales and increased turnover, in order to contain potential risks with their cash flows.
In recent years, as China presses ahead with its deleveraging efforts, such high turnover model may have also approached the finish line, especially after the outbreak of the liquidity crisis which swept across the entire real estate sector in October, 2021.
At equilibrium, a sector has to maintain its general ROE at a reasonable level, or businesses will enter or exit from it. The reduction in turnover and leverage ratio of real estate developers will have to be balanced by a rise in the net profit margin on sales which is only possible with higher house price, lower land price and compressed cost. An essential condition for that is market clearing from the supply side, which would inevitably improve the industrial environment for competition and direct market shares toward leading businesses in steady operation.
II. STRUCTURAL TRANSFORMATION OF THE CHINESE ECONOMY: OBSERVATIONS THROUGH THE LENS OF INDUSTRIAL SECTOR AND LISTED COMPANIES
Next, we will try and assess what China has achieved with economic structural transformation over the past decade and how that is reflected in the capital market.
1. Structural transformation of the Chinese economy: Observations through the industrial lens
To start with, let’s observe how the international competitiveness of the industrial sector in China has evolved by looking at the exchange rate of the Renminbi (RMB) and the country’s export.
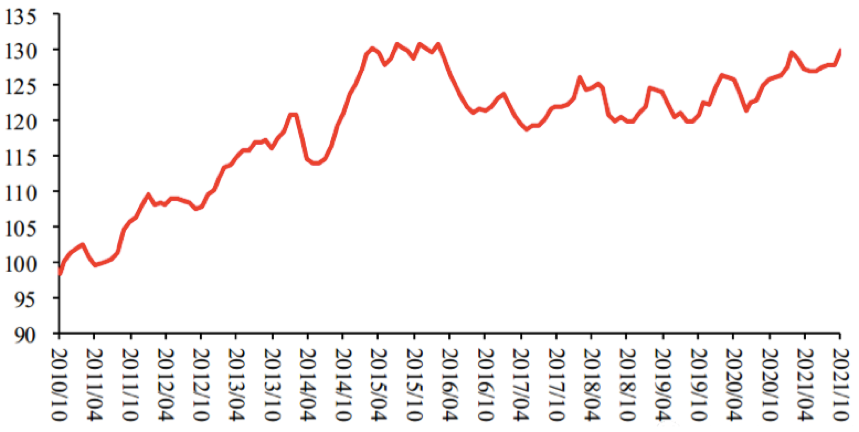
First, as shown in Figure 9, after excluding the interference from inflation and fluctuations in the value of the US dollar, the real effective exchange rate of RMB has surged over the past decade, with an accumulated appreciation by almost 30%, or over 2% in terms of the annual average. That was faster than the long-term historical trend rate since 1997.
Figure 9: RMB real effective exchange rate index
Sources: Wind; Essence Securities.
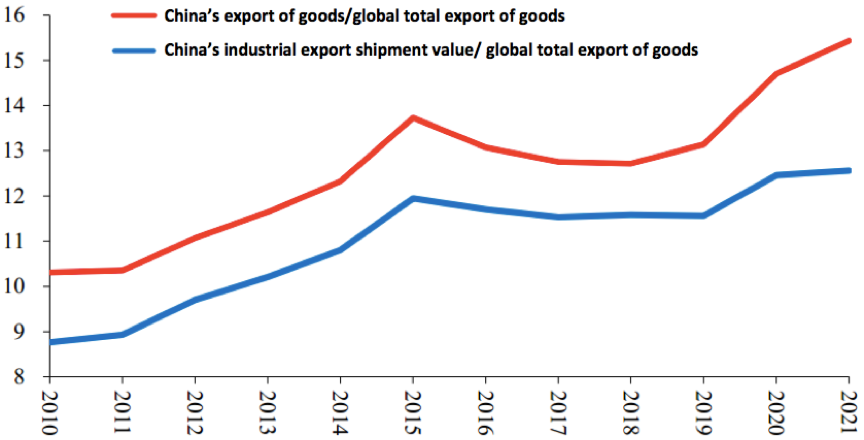
Second, as Figure 10 shows, over the past decade, the share of China’s export in global total has increased. There was a brief downfall during 2015-2018 which was probably due to the exchange rate overvaluation, but from 2019 onwards, the share began to rally again.
Figure 10: Share of China’s export and industrial export shipment value in global total (%)
Sources: Wind; Essence Securities.
Note: Data for 2021 are for January to September only; the export shipment value of industrial enterprises above designated scale for years after 2010 is calculated based on the 2010 absolute value and the subsequent y-o-y growth rate.
This means that in general competitiveness of China’s export continued to improve during this period of time.
Looking at this through the industrial lens, we can see that some of the sectors were becoming more competitive, and some growing less competitive. However, the former outweighed the latter, and so China’s export competitiveness as a whole was elevated.
Thus, we can delineate the structural changes and the sources of improvement in competitiveness by working out the changes in the competitiveness of various sectors and ranking them.
A simple way to do this is to measure the change in the share of a sector’s export in total export as a gauge of how its competitiveness has evolved. But a problem with it is, if a sector’s share in global trade is significantly increasing, it would be harder to precisely interpret the fluctuations of the indicator.
However, if we categorize the fluctuations in the level of competitiveness of all sectors into “high”, “medium” and “l(fā)ow”, with each category encompassing an array of sectors, it would make up for the above-mentioned flaw.
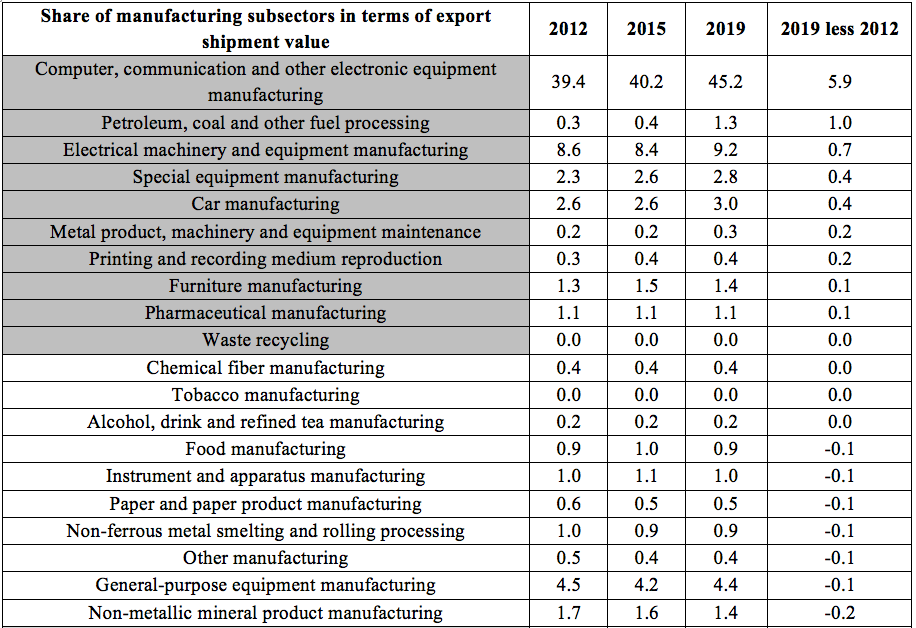
The results of this analysis are demonstrated in Table 3. The upper part lists the sectors with rising competitiveness, while the lower part contains those becoming less and less competitive (at least relatively speaking).
We divide the sectors into three groups: the high-growth group, the medium-growth group, and the low-growth group, and then take a closer look at them from the perspectives of value added and capital expenditure.
Table 3: Share of manufacturing subsectors in terms of export shipment value (%)

Sources: Wind; Essence Securities.
(1) From the perspective of value added
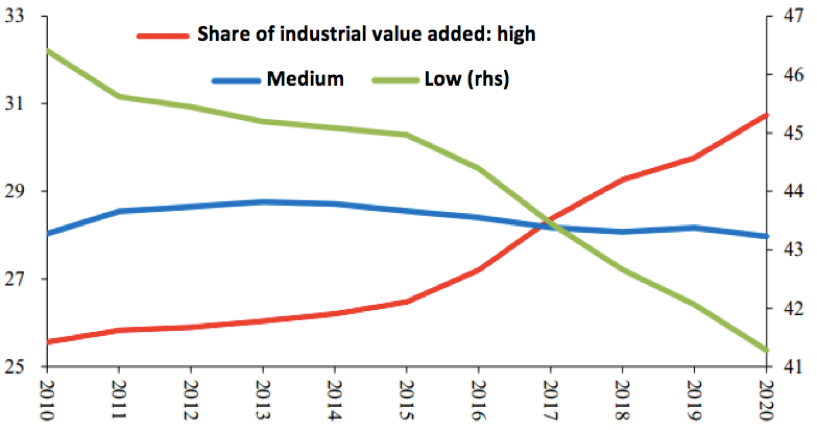
As shown in Figure 11 and 12, 2015 is a watershed year in terms of industrial value added in different groups. Prior to 2015, the growth rates of these sectors were comparable; however, after 2015, the high-growth group grew significantly faster than the medium- and low-growth groups, resulting in a greater share of high-growth sectors in terms of industrial value added after 2015.
Figure 11: Industrial growth rates of groups divided by export shipment value, %

Sources: Wind; Essence Securities.
Note: According to the increase in the share of export shipment value, the manufacturing sectors are divided into three groups. The high-growth group includes the first third (10) of the sectors with the highest growth rates.
Specifically, the share of the low-growth group fell from 46% to 41% after 2015, while the share of the high-growth group rose from 26% to 31%, and the gap between the two fell by 10 percentage points.
But at the current absolute level, the low-growth group is still almost 10 percentage points higher than the high-growth group, which suggests that although China's industrial structure has undergone a rapid transformation in the last decade, and especially in the last five years, it is still dominated by traditional sectors.
Figure 12: Share of industrial value added of groups divided by export shipment value, %
Sources: Wind; Essence Securities.
(2) From the perspective of capital expenditure
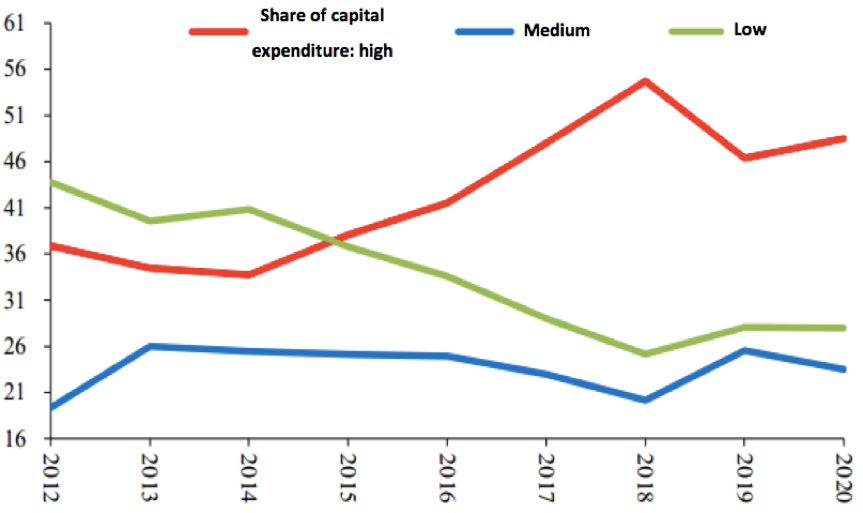
As shown in Figure 13 and 14, the ratios of capital expenditure to revenue were broadly similar until 2015, but since then the high-growth group has had much higher ratios and therefor a bigger share of capital expenditure (at around 50%, compared to less than 30% for the low-growth group).
The speed of industrial transformation looks certainly faster from the perspective of capital expenditure.
Figure 13: Ratio of capital expenditure to revenue of groups divided by export shipment value, %

Sources: Wind; Essence Securities.
Note: Given the absence of cash flow statement in the data released by China’s National Bureau of Statistics, capital expenditure is proxied by the sum of “annual change in non-current assets (calculated as current year value minus previous year value)” and “depreciation”.
Figure 14: Share of capital expenditure of groups divided by export shipment value, %
Sources: Wind; Essence Securities.
A decade ago, it was widely assumed that the Chinese economy would shift towards sophisticated manufacturing, such as automotive, engineering machinery, CNC machines, and precision instruments. However, what has occurred in other economies has not occurred in China, at least for the time being.
About 70% of China's industrial upgrading has taken place in the field of computer, communication, and electronic equipment manufacturing (hereinafter referred to as electronics manufacturing), in terms of the change in the share of export shipment value.
In the complex and large global electronics manufacturing chain, China mostly remains at the lower end – assembly and accessories, while the upper end is concentrated in a few developed countries.
But China is fast climbing up this industrial chain of electronics manufacturing.
It remains uncertain whether China could stably and predictably import core technologies, equipment, and accessories amid the changing international political and economic climate.
It surely requires China to set up a back-up system of its own, but there will be technological challenges as well as commercialization obstacles of its integration into the global division of labor.
Why is electronics manufacturing the focal point of China’s industrial transformation? The reason for this could be that China has been deeply involved in the global production led by multinational corporations, quickly becoming the world's factory and a key component of the global supply chain, and developing a vast system of manufacturing, assembly, and component supply at the middle and lower end of the chain. It is a development path that is markedly different from that of Japan and South Korea.
In addition, marked by the rise of the mobile Internet, the electronics manufacturing sector has undergone rapid technological evolution over the past decade, and the vast supply chain has given Chinese companies a chance to leapfrog. They have seized this opportunity in areas such as smartphones and accessories, new energy, and electric vehicles (discussed in depth in the following sections).
The climb up the value chain is faced with a number of new variables and challenges as the international political and economic landscape changes, which are not insurmountable but require longer time and huge investments, and there are also technical difficulties and uncertainties.
2. Structural transformation of Chinese economy: observations from listed companies
The industrial data applied in the aforementioned observation have three inefficacies:
The transformation includes industrial upgrading and the transition from manufacturing industry to service industry, but industrial data do not contain service data.
Then, by dividing the industries into over 30 sectors, some details of economic transformation are left out.
What’s more, details within the industrial data, such as profits of a firm, its ROE, employment, salary per capita, and cash flow, are not available.
As such, we turn to the data of listed companies.
Of course, there is also a not-so-subtle flaw in such data: in the past decade, the top companies in electronics manufacturing, the fastest upgrading sector in China, have not been listed on A-shares, such as Huawei and Xiaomi. This makes A-share listed companies a sample that does not cover all of China's most competitive companies.
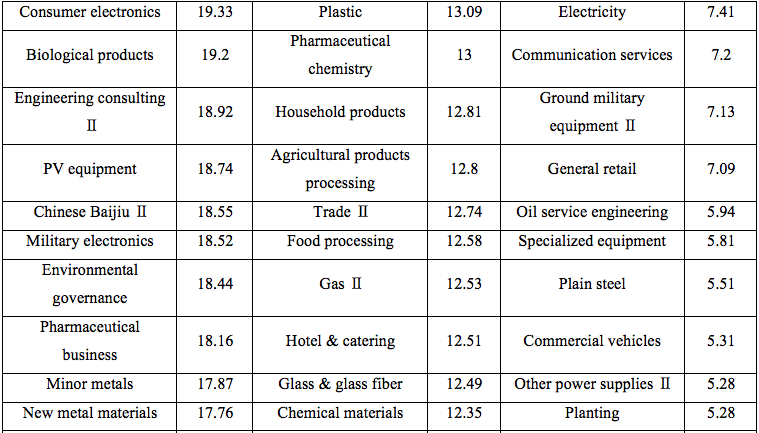
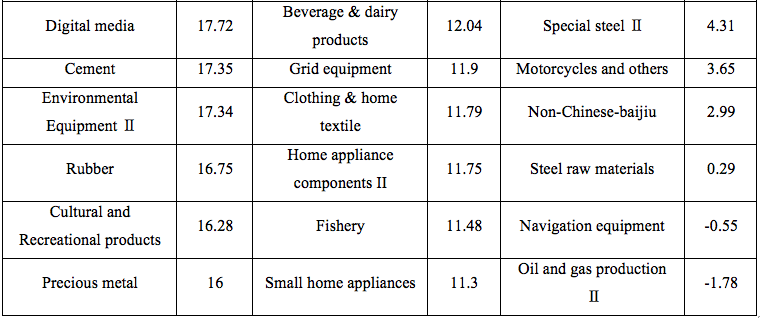
The data of listed companies can also be grouped following the same logic. On the premise of comparability, the growth rates of revenue over the past decade are ranked from highest to lowest, at a granularity of over 110 subsectors at level two as per SWS classification (with the financial and real estate sectors excluded).
As shown in Table 4, from left to right are the high-growth, medium-growth, and low-growth groups.
Table 4: Arithmetical average growth rate of revenue of SWS Level Ⅱ sectors over 2010-2019


Sources: Wind; Essence Securities.
Note: We calculate the 2010-2019 annual arithmetical average growth rates of revenue of the 134 SWS Level Ⅱ sectors that were updated in 2021 based on annual fixed company sample. After excluding financial, real estate, and medical cosmetic sectors for their lack of data, there are altogether 111 sectors, with 37 sectors each allocated to the high-, medium-, and low-growth group.
First, as shown in Figure 15, when a company's revenue is rendered as its value added in accordance with the standard of national economic accounts, it can be seen that different groups exhibit broadly similar trend of the growth rates of value added, as expected; in absolute terms, the high-, medium- and low-growth groups correspond to a high-to-low rate of value added growth respectively.
Figure 15: Growth rate of value added of different revenue growth groups, %

Sources: Wind; Essence Securities.
Note: Financial and real estate sectors are excluded. Referring to the formula of industrial value added and GDP by income approach, a list company’s value added = revenue + salary + depreciation + taxes ? tax refund ? income tax.
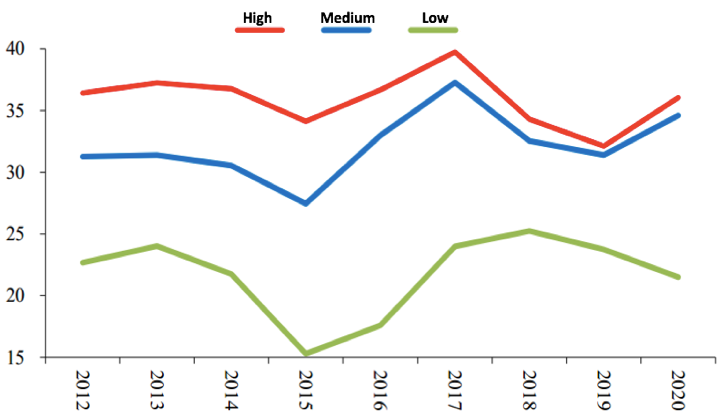
Then turn to Figure 16, you will find that the ratio of profit to value added is the highest in the high-growth group, followed by the medium-growth group, and the low-growth group.
Figure 16: Profit/value added of different revenue growth groups, %
Sources: Wind; Essence Securities.
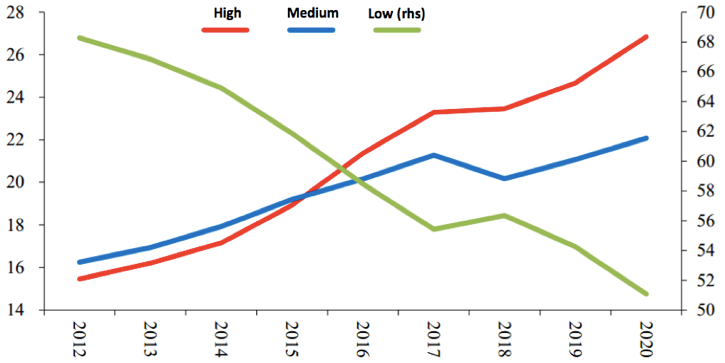
Next, after converting the growth of value added to a percentage share, as shown in Figure 17, we can see the value-added share of the high-growth group showed a rapid increase from 15% to over 26%, while that of the low-growth group decreased from 68% to 51%.
Figure 17: Share of value added of different revenue growth groups, %
Sources: Wind; Essence Securities.
Note: Annual share of value added for 2010 to 2019 are calculated based on 2020 data.
Therefore, the entire economic structure is undergoing a significant transformation, but until now, the low-growth group is taking up less than 50%. Similarly, as shown in Figure 18, the capital expenditure share in the low-growth group is around 54%.
Figure 18: Share of capital expenditure of different revenue growth groups, %

Sources: Wind; Essence Securities.
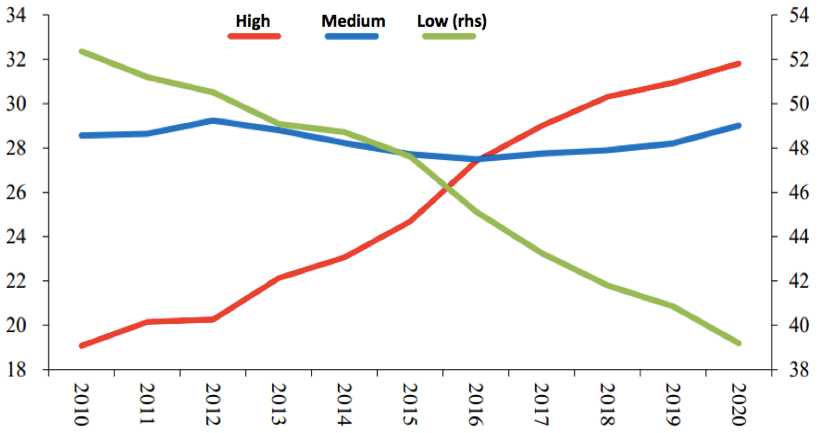
From the perspective of the number of employees, as shown in Figure 19, the share of employees in the high-growth group increased from 19% to 32%, while that of the low-growth group continued to decline from 52% to 39%.
Figure 19: Share of number of employees of different revenue growth groups, %
Sources: Wind; Essence Securities.
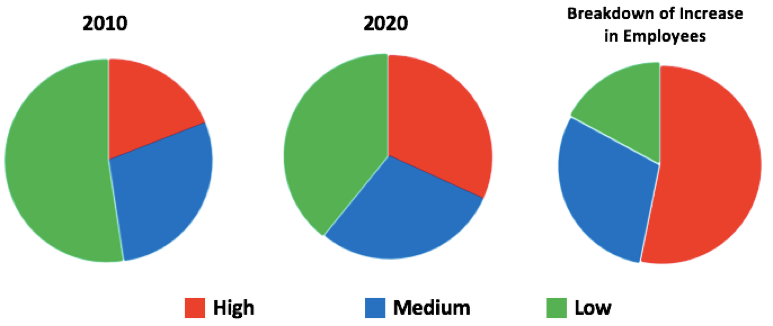
As shown in Figure 20, over half of the increase in employees during the past decade was contributed by firms in the high-growth group. Meanwhile, the share of the employees haired by firms in the low-growth group rapidly shrank.
Figure 20: Share of employees of listed companies and a breakdown of the increase in employees, %
Sources: Wind; Essence Securities.
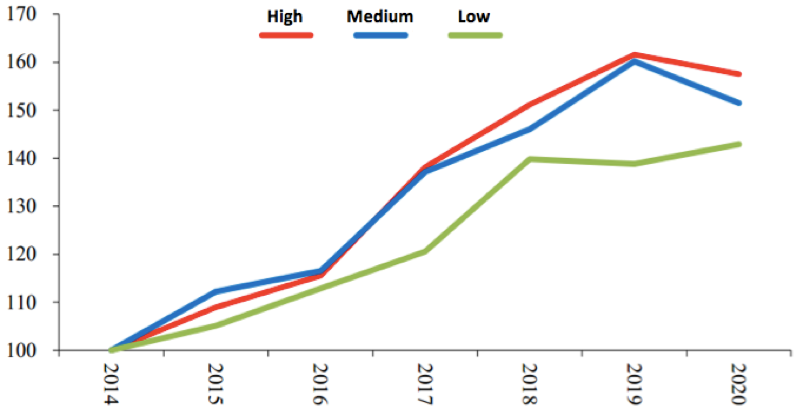
As shown in Figure 21, the salary per capita in the high-growth group has preceded the medium- and low-growth group in recent years.
Figure 21: Change of per capita salary of different revenue growth groups (2014 benchmarked as 100)
Sources: Wind; Essence Securities.
The increase of staff, accompanied by pay rise, suggests the faster rise in the demand of the high-growth group.
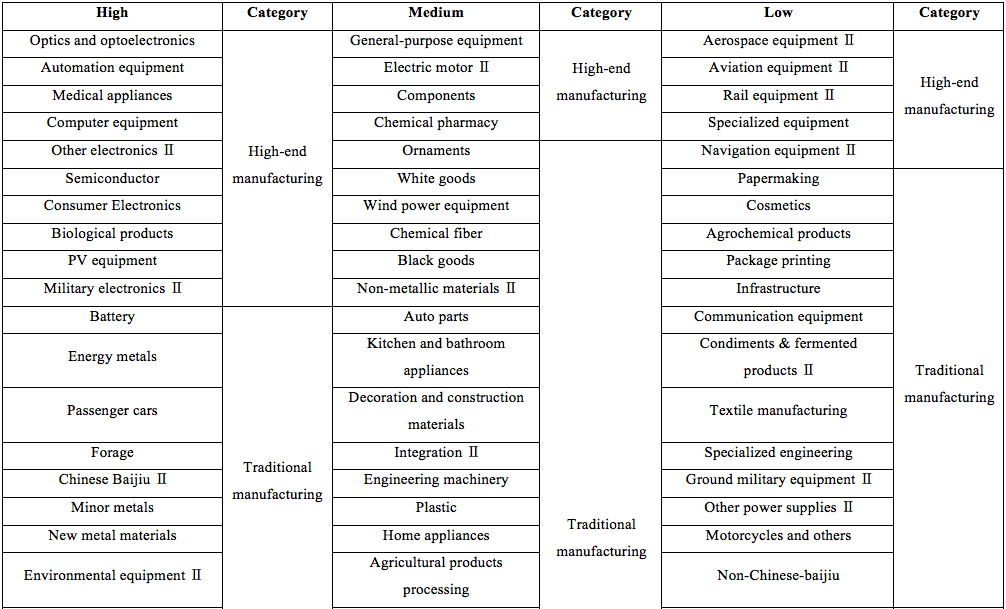
Based on the performance of the grouped data, we classified the sectors and made such comments as follows:
Table 5: Industry groups under the three revenue growth groups

Sources: Wind; Essence Securities.
Note: The high-end manufacturing, energy-intensive manufacturing, producer services, and life services are defined according to the National Bureau of Statistics of China.
First, about half of the companies in the high-growth group, in terms of the value added, are of the service industry (new-type services), and the other half are manufacturing companies. The proportion of the service sector in the medium- and low-growth group is extremely low, and the proportion of the manufacturing industry may be as high as 90%, reflecting that the rapid rise of new service industry is a rather important factor in the process of economic transformation.
By examining the subsectors, we can conclude that factors leading to the above-mentioned phenomenon are changes in demand brought about by rising income and technological progresses. For example, the growth of industries such as medicine, cinemas and theaters, and cultural entertainment are closely related to changes in demand caused by income increases, while the rapid growth of industries such as new media technology and games is related to technological changes and the popularization of mobile Internet, and likely higher income as well.
Second, in terms of sub sectors of manufacturing, most of the high-end manufacturing companies fall into the high-growth group, and only a very small part of them fall into the medium- and low-growth group. This is in line with our expectations.
Despite the diversified subsectors of manufacturing companies in the high-growth group, there are two notable features.
First, many subsectors are closely related to electronics manufacturing, such as semiconductors, consumer electronics, computer equipment, optical optoelectronics, etc.
Second, many are related to the green and low-carbon transformation of the economy, such as batteries, photovoltaics, and energy metals.
These are undoubtedly areas where major technological changes are taking place.
Generally speaking, data of listed companies show similar characteristics, that is, Chinese enterprises in the mature sectors haven’t made much obvious progresses up the value chain, but in industries featuring major technological changes, many have achieved leapfrogging.
3. Capital market during the economic transformation
How are the above-mentioned changes in China's economic transformation reflected in the capital market? What changes will happen in the capital market in the future?
First, let’s look at the ratio of market value of listed companies in the three groups. Here, we excluded the financial and real estate industries to concentrates on the real economy.
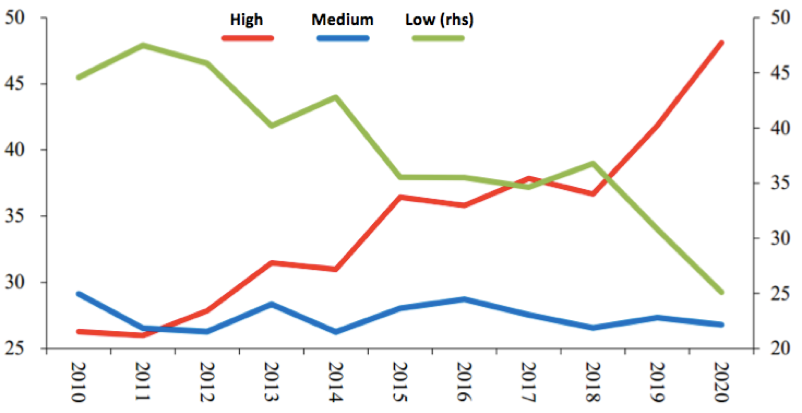
As shown in Figure 22, the market value of the high-growth group accounted for about 26% in 2010 and close to 50% in 2020; while the market value of the low-growth group dropped from close to 45% in 2010 to 25% in 2020. The market value of the medium-growth group had been stable at 25%-30%.
Clearly, the market value of A-shares has become primarily dominated by the new economy, and the proportion of the old economy is now quite small. From this perspective, we can say that economic transformation has generally completed.
Figure 22: Share of market value of different revenue growth groups
Sources: Wind; Essence Securities.
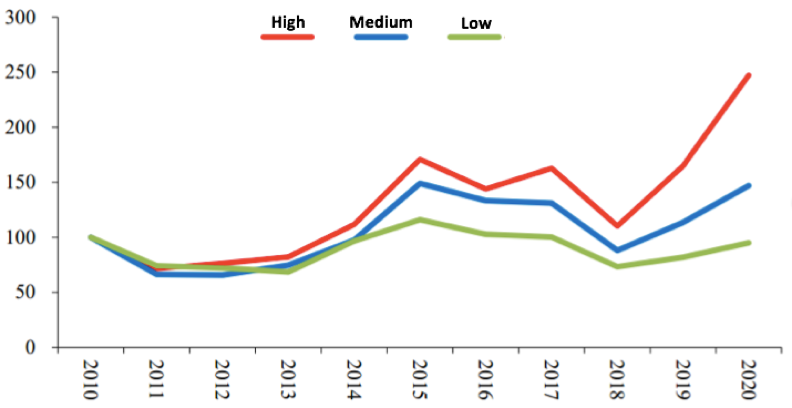
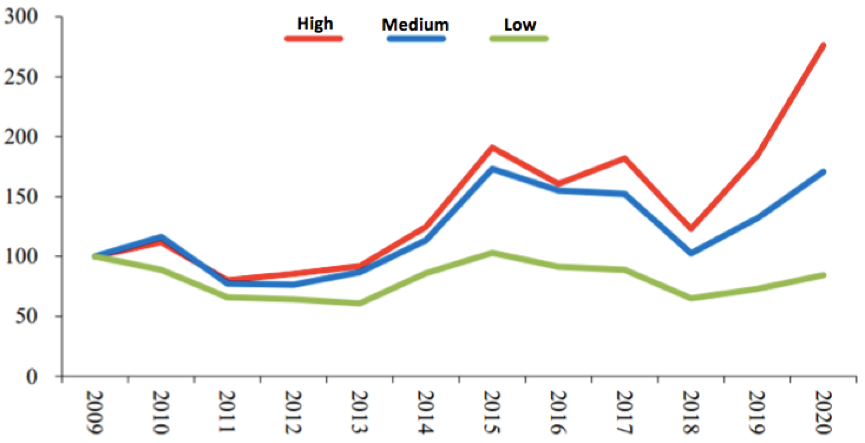
Next, let’s look at the stock price. We take the stock price at the beginning of 2010 as 100, and calculate the long-term stock price changes of the three groups of high, medium and low revenue growth in the past ten years (this is a net price index without considering the situation of dividends).
As shown in Figures 23 and 24, the stock price index of the high-growth group had risen from 100 in early 2010 to nearly 250 in 2020, while that of the low-growth group had dropped from 100 to 95 in 2020. If we look at the compound annual growth rate, the average annual stock price increase of the high-growth group is close to 10%, that of the medium-growth group is close to 4%, while the low-growth group suffers negative growth.
In summary, the transformation of China's economy in the past 10 years has a relatively stable projection in the stock market. Companies in the high-growth group saw rapid development and thus enjoyed high returns in the stock market, which allowed them to raise funds more easily. In contrast, the low-growth group experienced value destruction.
Figure 23: Changes of stock prices of different revenue growth groups (stock price in 2010 as 100)
Sources: Wind; Essence Securities.
Note: Taking the stock price at the end of 2010 as 100 and setting market value at the beginning of each year as the weight, the industry index is weighted into a group index; the annual geometric average increases of the high-, medium- and low-growth groups are 9.5%, 3.9%, and -0.5% respectively.
Figure 24: Changes of stock prices of different revenue growth groups (stock price in 2009 as 100)
Sources: Wind; Essence Securities.
Note: Taking the stock price at the end of 2009 as 100, and setting market value at the beginning of each year as the weight, the industry index is weighted into a group index; the annual geometric average increases of the high-, medium- and low- growth groups are 9.7%, 5%, and -1.5% respectively.
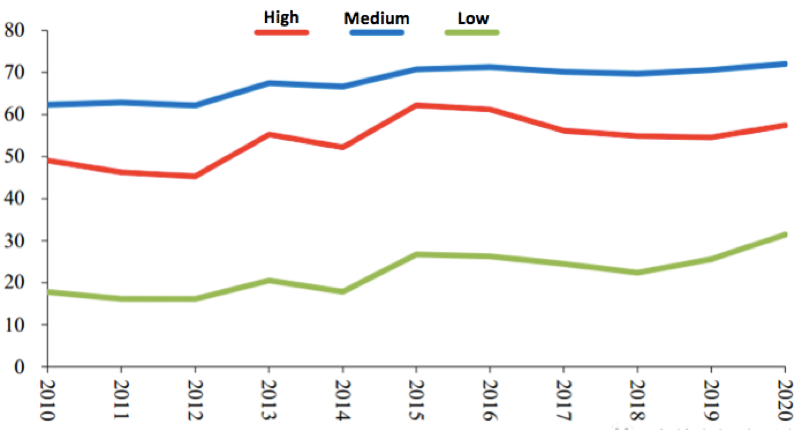
A further important observation is that in the low growth group, as shown in Figure 25, the market value of state-owned enterprises accounted for nearly 70%, while in the high- and medium-growth groups, the proportion of private enterprises exceeded 55%.
In other words, state-owned enterprises can play an important role in economic transformation, but data shows that private enterprises have weighed more during the transformation.
Figure 25: Share of market value of private enterprises of different revenue growth groups (%)
Sources: Wind; Essence Securities.
The returns provided to investors by the A-shares market over the past decade were unsatisfactory. From the perspective of economic transformation and industry grouping, there are two important explanations:
First, the proportion of the low-growth companies in the listed companies was very high in 2010, which was even more evident in the Shanghai Composite Index. Although companies of the high-growth group performed well in the past 10 years, they accounted for a very low proportion of the entire market in 2010, and their impact on the index can only be seen in the recent period.
Second, the vast majority of low-growth companies were state-owned enterprises, and most of them were listed through restructuring. At the time of restructuring and listing, such companies may have passed the stage of high-speed growth, which led to weak stock market performance post listing.
In 2021, the market value of the traditional economy and state-owned enterprises has dropped to a relatively low proportion, and most of the market value is concentrated in medium- and high-growth industries, and dominated by private enterprises.
As infrastructure and real estate decline, the diminishing marginal return on capital continues to exert an impact, the falling trend of the average interest rate in the next 10 years is almost certain. The majority of companies listed on the A-shares have changed from state-owned enterprises to private enterprises and are mainly of medium and high-growth industries. With the adoption of the registration-based IPO system, if the A-shares market can continue to include emerging industries in the future, the next ten years will see higher returns than the past ten years.