Abstract: Over the past five years, the real estate sector and government behavior in the broad sense have played a dominant role driving credit expansion in China. During 2015-2019, the latter contributed to over 50% of credit expansion, while the two combined explained around 80% of total credit expansion in the country. Loosening of monetary policy is a necessary but not sufficient condition for credit expansion. Credit expansion is always preceded by monetary policy adjustments, but as it unfolds, it is usually accompanied by continuous interest rate hikes. Monetary policy adjustments and changes in the interest rate curve may offer a clue as to pace of credit expansion going forward.
The speed of credit expansion is arguably the most important factor shaping macroeconomic performance in the short run.
China saw fast credit expansion for four consecutive quarters after COVID-19 broke out. In 2020, the country’s total social financing (TSF) grew by a whopping 35 trillion yuan, hitting a historical high both in absolute terms and as a share of GDP. This wave of credit expansion culminated in the fourth quarter of 2020. Since March 2021, the year-on-year growth rates of M1, M2 and TSF, among other monetary indicators, have been on a continuous downward ride, indicating a slowdown in credit expansion in China.
We believe that whether credit expansion could stabilize and pick up pace again is the main factor shaping China’s macroeconomic performance in 2022.
I. WHAT HAS BEEN DRIVING CREDIT EXPANSION OVER THE PAST FEW YEARS?
To chart the future path of credit expansion, we need to first figure out who have been expanding credit over the past years.
Our analysis is not based on the three-sector (households, the government and businesses) approach, because within each sector there are many different stories. For example, real estate developers and exporters actually live in “parallel worlds”. This leads us to focus on the two major contributors to credit expansion of the day: the real estate sector and the government.
Credit expansion related to the real estate sector includes loans taken on and bonds issued by real estate developers as well as individual housing loans (both formal and informal). Credit expansion of government in the broad sense includes both the issuance of government bonds and the implicit debts raised to fund infrastructure projects.
For the purpose of this article, we take new TSF as the gauge of changes in credit, rather than the generally used year-on-year growth in TSF—for two reasons. First, absolute value is a more visual gauge of credit expansion. In particular, statistically aligned and smoothed indicators for new TSF exhibit clearer fluctuation patterns. Second, over the past two decades, the year-on-year growth of TSF and the absolute increase in TSF have fallen into roughly the same credit cycles, while at the start and end of each cycle the latter has shown greater sensitivity.
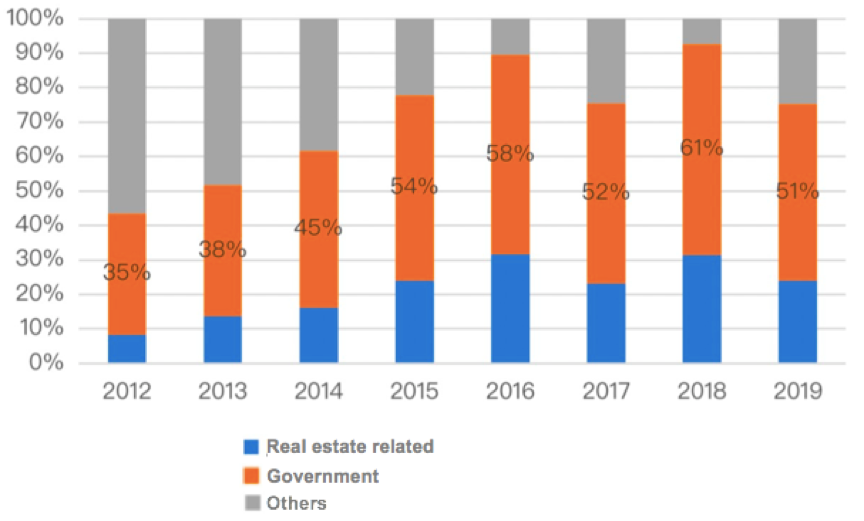
Based on the above logic, we have broken down new TSF each year (see technical details in the endnotes), and found that over the recent five years, the real estate sector and the government have served as the dominant drivers behind credit expansion. As shown in Figure 1, during 2015-2019, government borrowing in the broad sense contributed to over 50% of credit expansion, and together with the real estate sector, the two could explain about 80% of credit expansion. The rest was contributed by individual consumption loans, manufacturing investment loans and short-term loans, among others, but they were too small in magnitude to serve as the main drivers of credit expansion. In other words, we can hardly expect to see material increase of credit unless real estate and infrastructure investment can play a bigger role.
Figure 1: Contribution of various sectors to new TSF

Of particular note, although infrastructure investment slid in 2018, government borrowing was playing a much bigger role explaining credit expansion. This was because, in the same year new TSF dropped much more significantly while the growth of infrastructure investment remained positive despite the slide.
II. BASIC PATTERNS OF CREDIT EXPANSION
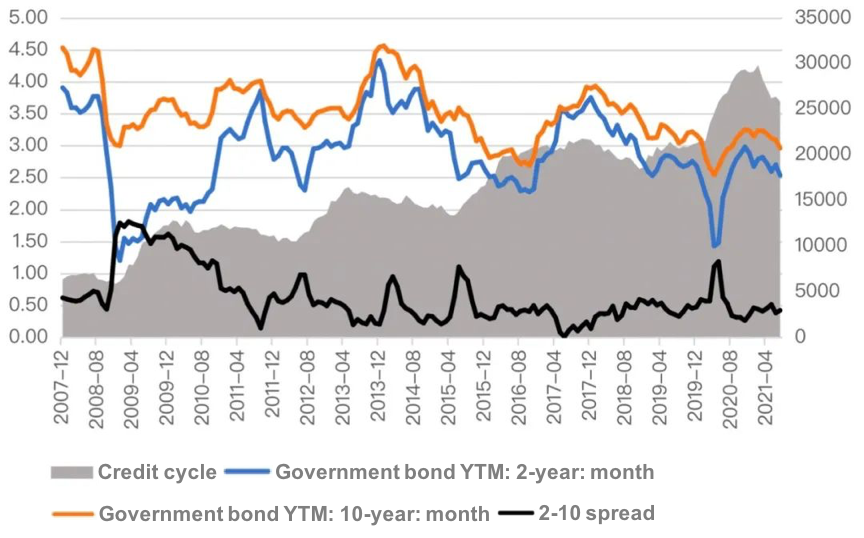
In addition to breaking down credit expansion by borrower sectors, we could explore the basic patterns of credit expansion by examining the past several credit cycles. If we look at fluctuations in credit as measured by new TSF, 12-month smoothed as shown in Figure 2, over the past 15 years, there have been four rounds of credit expansion in China, starting respectively in early 2009, mid 2012, mid 2015 and Q2 2020.
Figure 2: Pattern of credit expansion in China

The four rounds of credit expansion reveal the below patterns:
First, a fast reduction in the interest rate, with the rate curve steepening sharply, always precedes credit expansion. This means the central bank is easing monetary policy which causes a faster decrease in the short-term interest rate.
Second, as credit expansion starts, the interest rate will gradually climb up, and the steepened curve will gradually flatten.
Specifically, monetary easing is a necessary but not sufficient condition for credit expansion. A typical example occured back in early 2014. At that time, similar things happened, that is, the interest rate declined and the curve rapidly steepened, but that has to be put in two important contexts:
One was that the market had just experienced a cash crunch in the second half of 2013. The fall in the interest rate was partly due to monetary policy adjustment, and partly to downward correction from the previous surge.
The other was that real estate regulation was continuously tightening up throughout 2013, which led to a slump in the new construction area in early 2014 and a year-on-year growth of -10% for the whole 2014.
Credit expansion always starts with monetary policy adjustments, but when it sets in, it is usually accompanied by continuous rise in the interest rate. However, this does not indicate a one-way, linear correlation between the interest rate and credit change. The interest rate is the price of money. On one hand, credit expansion means that the demand for money is on the rise and that will push up the interest rate; on the other hand, when the interest rate increases, money becomes more expensive which in turn will inhibit credit expansion. Which factor dominates during a certain period needs further study.
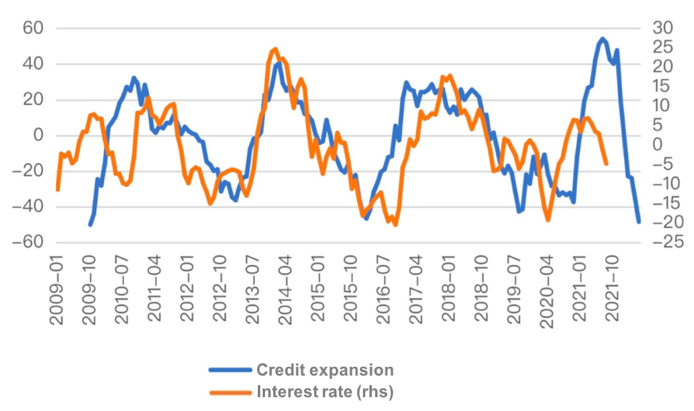
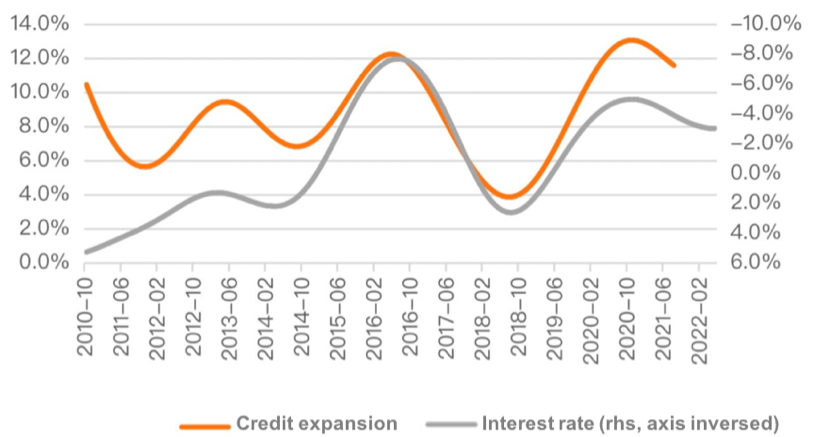
Here, we have used the HP filter to decompose the two indicators, interest rate and new TSF, into the trend component and the cyclical component, and discovered an interesting fact. As shown in Figure 3 and 4, with respect to the cyclical component, increase in TSF steadily leads the interest rate by about three quarters; while with respect to the trend, it is the interest rate that runs steadily ahead, also by about three quarters. This might indicate that the inhibiting effect of interest rate hike on credit expansion is a long-term one. Cyclically speaking, it’s more about credit fluctuations leading interest rate fluctuations.
Figure 3: Cyclical component: credit expansion leads by 9 months

Figure 4: Trend component: interest rate leads by 9 months

To sum up, credit expansion is driven by economic entities, most importantly in the real estate sector and the broadly defined government sector. We should expect to see changes in the monetary policy and the interest rate curve before credit expansion occurs. Without obvious signals of credit expansion, we do not expect any sudden change in the trend of the interest rate.
ENDNOTES:
1. Since 2017, China have incorporated general government debt in the calculation of TSF. Monthly TSF data prior to 2017 were adjusted accordingly.
2. Credit related to the real estate sector includes: (1) annual new credit loans of real estate developers; (2) commercial housing loans, including individual housing loans and real estate development loans; (3) unconventional individual housing loans, mainly long-term operating loans taken on by households to purchase houses. This phenomenon has prevailed since 2017 when real estate regulation tightened and became especially pronounced in 2020. To adjust for it, we proxy the scale of normal loans with the average long-term housing loans taken on by households during 2006-2015, which are then deducted from mid- to long-term operating loans taken on by households during 2016-2019 to arrive at the nonconventional individual housing loans.
3. Borrowing of the government sector in the broad sense include: (1) general and special bonds; (2) infrastructure-related implicit debts calculated indirectly by deducting budgetary fund and private investment from total infrastructure investment.
However, a problem is that China has stopped publishing official figures for the absolute amount of infrastructure investment since 2017, and we could only work backwards based on the year-on-year data. This may not cause an issue when producing new year-on-year growth rates, but it could lead to overestimated infrastructure investment and implicit debt. This is also the case when it comes to total fixed asset investment. The year-on-year growth rates produced based on the scale of fixed asset investment have been significantly lower than official figures since 2017, but this has not happened with data for real estate development investment. The explanation given by the National Bureau of Statistics was that the statistical standards and sample businesses had been adjusted.
Therefore, to avoid overestimation, we need a conversion coefficient to adjust for the interference. Our methodology is that first, we work backward for a “virtual” figure for total fixed asset investment based on the official year-on-year data, and then calculate the conversion coefficient as (actual total fixed asset investment - real estate development investment) / (“virtual” total fixed asset investment - real estate development investment). Result shows that the conversion coefficient for 2017-2020 stood at 0.985, 0.925, 0.721, and 0.636 respectively. This shows the necessity of introducing the conversion coefficient. Meanwhile, thusly adjusted new implicit debt was about the same in 2018 as in 2017, while it dropped remarkably in 2019-2020, and this was in line with the economic reality.
4. The parameter of lambda in HP filtering is set at 14400.
This article was first published in CF40’s WeChat blog on November 10, 2021.