
Abstract: The breadth and depth of the latest wave of supply shocks are beyond expectations. On one hand, resource reallocation has given rise to supply-demand mismatch in the labor market in the short run; on the other hand, supply elasticity has seen decline that may extend beyond the near term, which could push up prices and restrict growth. Going forward, the Chinese economy faces two major obstacles, i.e. rising costs and mounting debt repayment pressure. Against this backdrop, the authors foresee a macroeconomic policy mix of tight credit policy, loose monetary policy and expansionary fiscal policy.
I. Introduction: inflation has gone beyond expectation
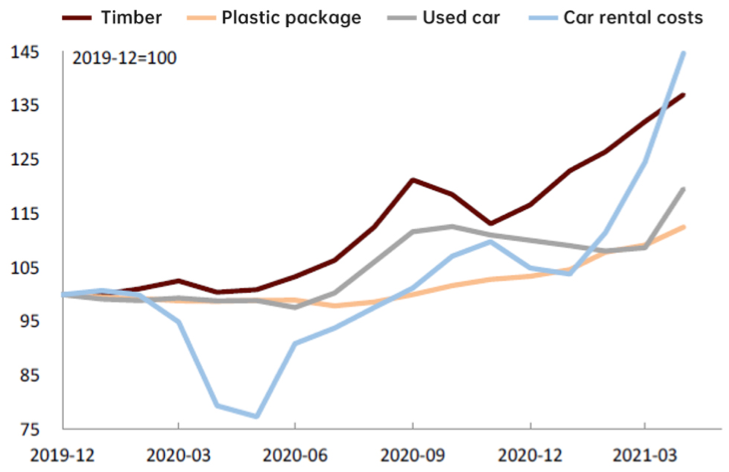
A new phenomenon during the economic recovery is that price increases have surpassed expectation. Following the signs of global price increases in the second half of last year, the pace of inflation seems to accelerate recently. From June 30, 2020 to December 31, 2020, the LME copper price increased by 28.4%, setting a new high since March 2013. However, as of June 4, 2021, the LME copper price witnessed one more round of growth by 27.8% compared to the end of 2020. Sea freight rates have risen since the second quarter of last year. In early June this year, the sea freight rates between China and the US have increased by 36% compared to the end of 2020. China-EU sea freight rates have also gone up after a short period of fall. Chips have shown supply shortage, and the prices have surged. Inflation in the United States has further gone up. As of May 2021, car rental costs in the United States had risen by 44% compared to the level prior to the pandemic, timber prices 33%, and used car prices 20%.
Figure 1: US inflation increased
Sources: Haver; CICC Research Department
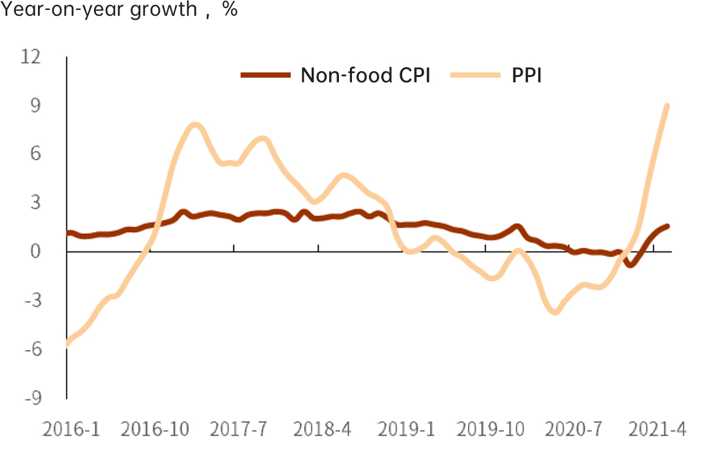
China's PPI rose sharply and non-food CPI also steadily went upward. From January to May of 2021, China’s PPI rose by about 6%, driving the year-on-year increase of PPI in May to 9%, which exceeded the 2017 high. Although the pork price offset the year-on-year CPI increase to some extent, and the price upstream has yet to be fully passed downstream, non-food CPI has gradually risen. Non-food CPI rose by 1.3% from January to May in 2021, driving its year-on-year increase from 0% at the end of 2020 to 1.6% in May 2021.
Figure 2: China’s PPI surged and CPI rose steadily
Sources: Wind; CICC Research Department
Although inflation has edged up, there are also worries over deflation facing the Chinese economy. So, what are the factors that have led to higher-than-expected price increases? How strong is the inflationary pressure in the Chinese economy and how long will it last? How will economic growth evolve? How should the macroeconomic policy respond? What is the future of the capital market?
We believe though the inflation is supported by demand to some extent, the cause of inflation is rooted in the supply shock brought by the pandemic which is reflected in both the labor market and the supply chain. The breadth and depth of supply shocks are beyond expectations. In the case of greater fiscal stimulus (such as in the United States), there is considerable upward pressure on inflation. In economies with less fiscal stimulus (such as China), the supply shocks push up prices on the one hand; and on the other hand, they restrict economic growth along with the debt problem. In short, in the context of supply shortage, the macroeconomy seems to hover somewhere between inflation and deflation.
II. The supply shock is far from over
1. Understanding the supply shock from two perspectives: labor market vs supply chain
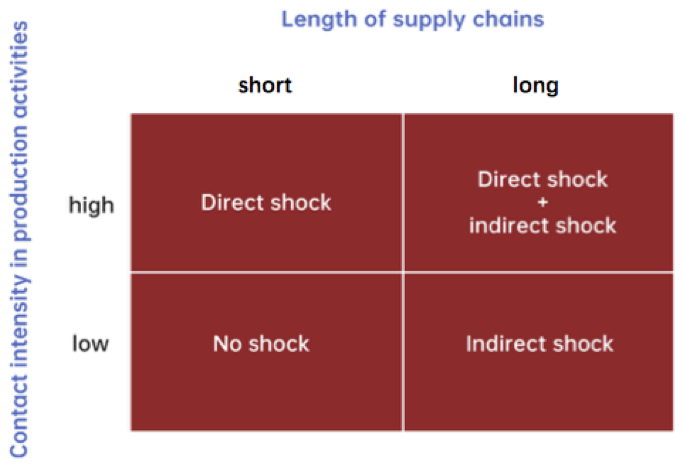
Let’s look at the supply shock brought by the COVID-19 pandemic from two dimensions: one is degree of physical contact involved in production activities, and the other is the length of supply chains. We might as well call the former a direct shock and the latter an indirect shock.
Direct shock may cause a factory shutdown and restrict production activities, which in turn affects the labor market. Indirect shock relates to whether a firm’s normal production and operation are affected by the upstream and downstream businesses on the supply chain.
Generally speaking, the higher the degree of physical contact involved in production, the greater the direct impact of the pandemic on the labor market; the longer the supply chain, the higher the susceptibility of firms to indirect shocks.
Figure 3: Understanding the supply shock from two dimensions
Source: CICC Research Department
Using these two dimensions, we could categorize various sectors of the economy as following: 1) Industries that have suffered both direct and indirect impact, such as textiles, clothing, wood processing and so on. These industries feature close physical contact at the production end and are heavily influenced by overseas production. 2) Industries that are mainly affected by direct shocks, such as mining, construction, transportation, wholesale and retail, and other industries that feature high contact intensity at the production end and have low dependence on overseas supply chains. 3) Industries mainly affected by indirect shocks, such as petroleum processing, chemical industry, metallurgy, electronics, electrical machinery which do not require close contact at the production side, but are highly dependent on overseas productions. 4) Industries that are less impacted by the pandemic, such as agriculture, forestry, animal husbandry and fishery, special and general equipment, the Internet, finance, technology. These industries do not require close contact and their supply chains have not been affected much.
2. Direct impact intensifies labor reallocation
Despite the recent outbreak in Guangdong, the pandemic in China has been generally put under control, so the direct impact on production has faded away. However, its secondary impact should never be ignored, which is on factor reallocation, especially labor reallocation.
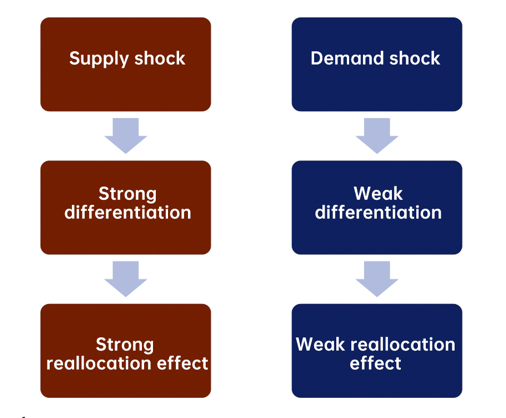
Compared with demand shocks, supply shocks are more likely to bring about factor reallocation. Demand shocks are usually caused by lower income and deterioration of balance sheets, which can weaken demand across the board. Therefore, different industries tend to show similar cyclical features during either a recession or economic recovery. However, supply shocks can vary greatly among different industries. For example, online services are almost immune to the pandemic, but offline service has been badly hurt. Entry into and exit from the market have been very frequent, which intensifies the reallocation of labor and capital among enterprises and industries, that is reallocation effect.
Figure 4: Pandemic shock intensifies factor reallocation
Source: CICC Research Department
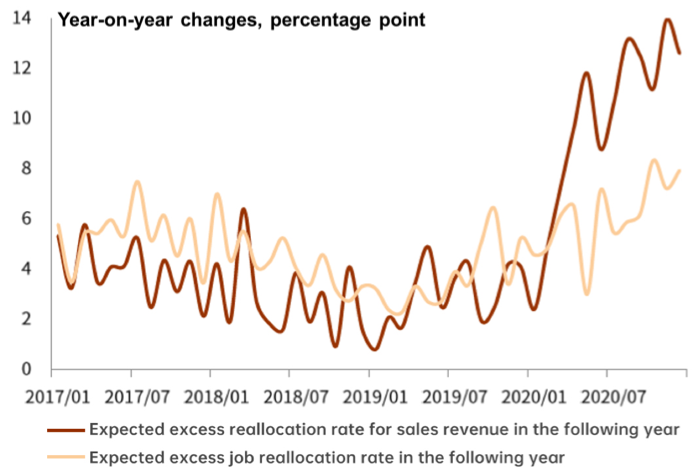
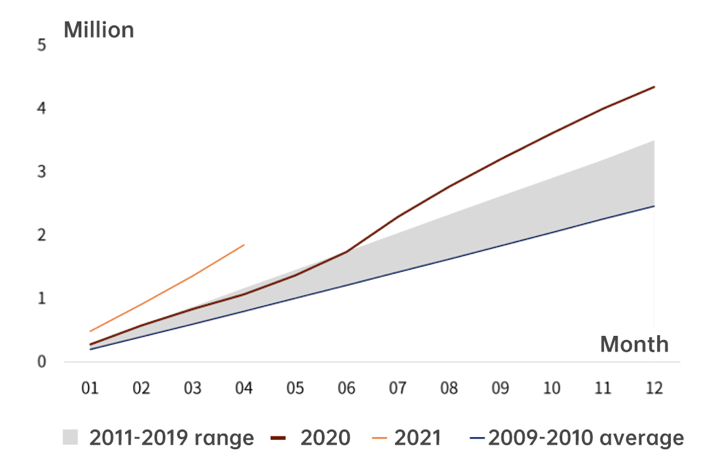
Data from the United States show that the labor reallocation effect brought about by the pandemic is more obvious than that after the 2008 financial crisis. A NBER study on pandemic-induced reallocation effect found that the reallocation rate of labor and sales revenue in the United States was significantly higher than the level before the pandemic, indicating that a large number of workers tried to enter new industries. Starting from the second half of 2020, the pace of business formation in the US began to accelerate, significantly surpassing the level before the pandemic and during the financial crisis. The pace did not slow down entering 2021. From January to April, 1.85 million new companies were set up in the United States, a record high over the same period in the past decade.
Figure 5: Expected employment and sales revenue reallocation rate in the US
Sources: Jose Maria Barrero. Nicholas Bloom. Steven J. Davis. Covid-19 Is Also A Reallocation Shock. May 2020; CICC Research Department
Figure 6: Number of newly established companies in the US hit a record high
Sources: The Business Formation Statistics (BFS); CICC Research Department
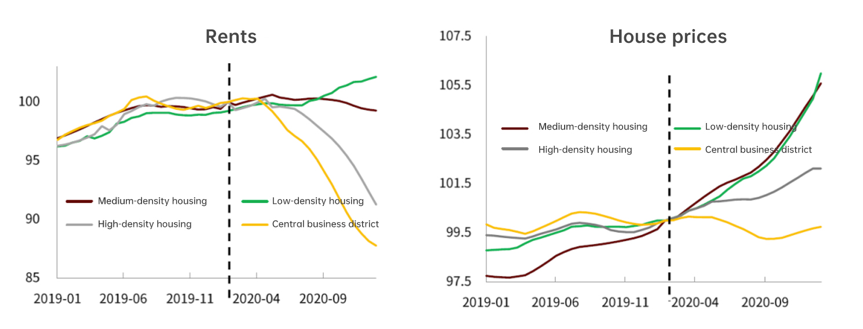
In addition to intra-industry reallocation, the United States has also experienced a regional reallocation of labor, as evidenced by the doughnut effect in its residential market. Performance of house prices and rents in the downtown areas in the United States are not as good as that in the suburbs. The rapid development of the digital economy following the outbreak of the pandemic has made remote office more common, driving high-end labor away from city centers. Rents in central areas of large cities have fallen but in suburbs risen; housing prices in city centers have gone up slowly, while housing prices in the suburbs have surged.
Figure 7: Doughnut effect in the US residential market
Sources: Adams-Prassl, A, T Boneva, M Golin and C Rauh. The large and unequal impact of covid-19 on workers. VoxEU.org; CICC Research Department
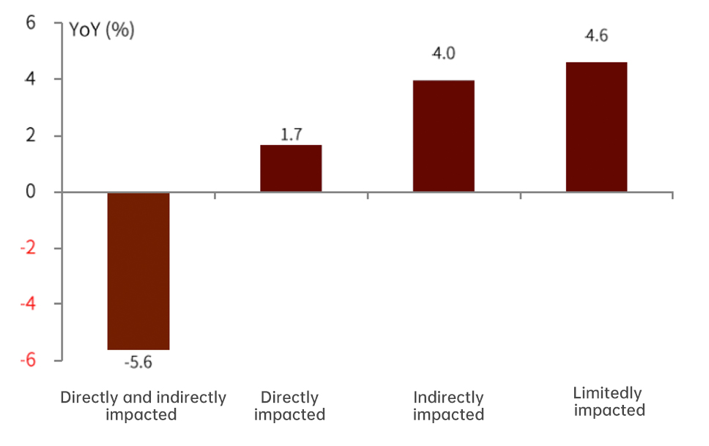
Extensive data indicate that labor reallocation has also been taking place in China. In terms of intra-industry reallocation, we classified Chinese listed companies into the four quadrants of Figure 3, and summarized their employee changes in 2020. The number of employees in industries that suffered both direct and indirect shocks decreased by 5.6% on a year-on-year basis, while the number of employees in industries that suffered less or even benefited from the pandemic increased by 4.6% year on year.
The contraction of the employment radius of rural labor is a manifestation of the regional reallocation of labor. We define the employment radius as the proportion of migrant workers in the total number of rural workers and set the 2019 proportion as 100. Clearly, the employment radius of rural workers narrowed in 2020, and the contraction was most obvious in western China and least obvious in northeastern China.
Figure 8: Changes of staff number of listed companies in 2020
Sources: Wind; CICC Research Department
Figure 9: Employment radius of rural workers contracted in 2020
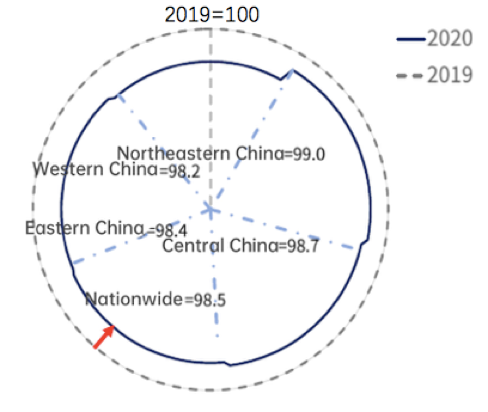
Sources: Wind; CICC Research Department
On the one hand, the contraction of the employment radius reflects rural workers’ worry over working outside one’s hometown. On the other hand, it also reflects the accelerated development of contactless economy, which has created new employment opportunities locally. According to statistics from China Academy of Information and Communications Technology, the added value of China's digital economy in 2020 increased by 9.7% year on year, and its share of GDP rose from 35.8% in 2019 to 39.2%. At the same time, the number of netizens across the country took a leap: the net increase by the end of 2020 was about 110 million people1, equivalent to the total increase of netizens nationwide from 2015 to 2019. The utilization rate of instant messaging, video call, online shopping, and online payment across the country had gone up significantly.
Digital economy in rural areas has developed more vigorously. In 2020, about 75% of the new netizens were from rural areas, and the total increase of rural netizens nationwide from 2015 to 2019 was about 46 million people. The increase in rural netizens in 2020 is 1.8 times of the rural netizens growth in the five years before the pandemic. Corresponding to the substantial increase in rural netizens is the rapid development of e-commerce in rural areas. In 2020, the number of Taobao villages across the country increased by 26% year on year to 5,425, and that of Taobao towns by 57% to 1,756. Taobao villages in national poverty-stricken areas grew from 63 in 2019 to 119 in 2020.2
Figure 10: Number of netizens in rural areas saw a sharp increase in 2020
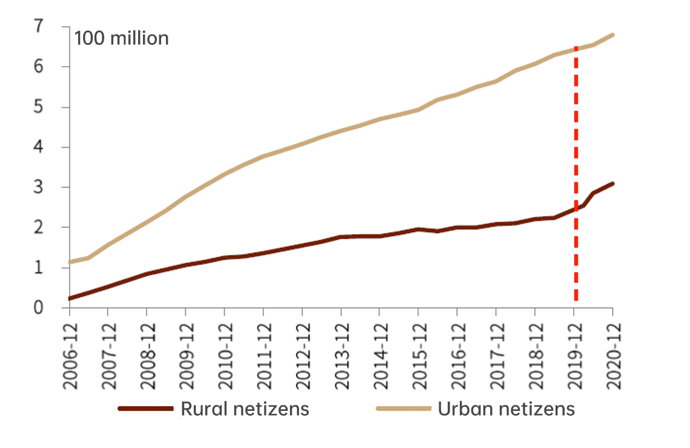
Sources: Wind; CICC Research Department
Figure 11: Number of Taobao villages and Taobao Towns
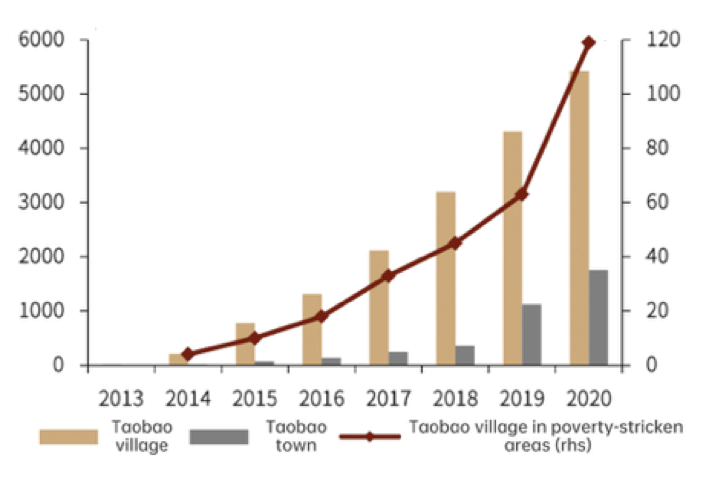
Sources: Alireasearch; CICC Research Department
However, friction is inevitable in the reallocation process, giving rise to supply and demand mismatches in the labor market. China’s labor market (especially the low-tech labor market) has already shown such signs. The ratio of job vacancies to applicants describes the degree of labor demand relative to labor supply, and the unemployment rate describes surplus labor supply. Historically, the two tended to maintain an inverse relationship. When the unemployment rate rises and surplus supply emerges in the labor market, the vacancy-to-applicant ratio usually drops accordingly. However, this relationship has changed with the outbreak of the pandemic. Although the two ratios in the high-end labor market continue to maintain a negative correlation, in the low-end labor market, the relationship between the two has reversed. When the unemployment rate goes up, the vacancy-to-applicant ratio rises as well, reflecting the mismatch between supply and demand in the labor market.
Figure 12: Relationship between vacancy-to-applicant ratio and unemployment rate
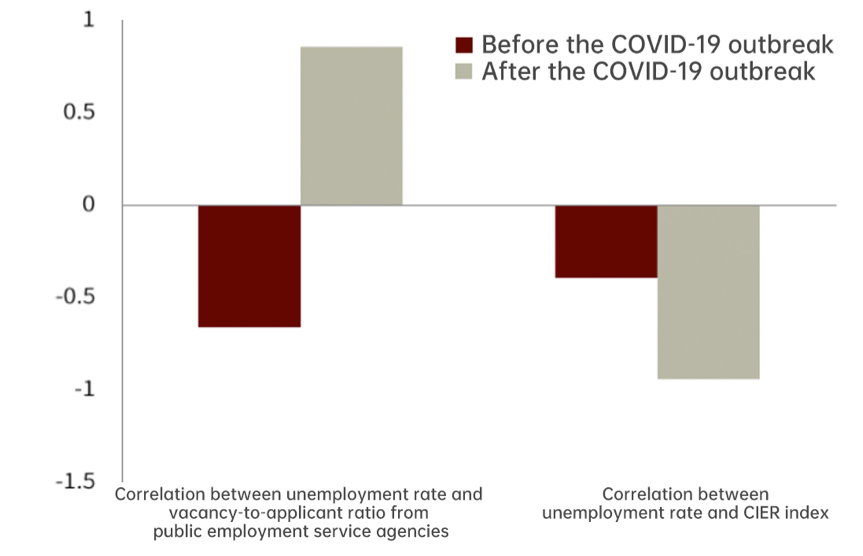
Sources: Wind; Zhaopin; China Institute for Employment Research; Ministry of Human Resources and Social Security of China; CICC Research Department
Note: The CIER index is calculated based on Zhaopin data and therefore reflects more the change in vacancy-to-applicant ratio in mid-to-high end labor market. As of the end of December 2012, the database accumulated 21.3 million active CVs, and the proportion of job seekers with a bachelor's degree or higher is 86.2%. Job seekers applicating through public employment service agencies tend to be at the middle and low end. In the first quarter of 2018, such agencies recorded about 4.669 million job seekers. Occupations with greater demand are sales personnel, manual labor, waiters, kitchen helpers, etc.
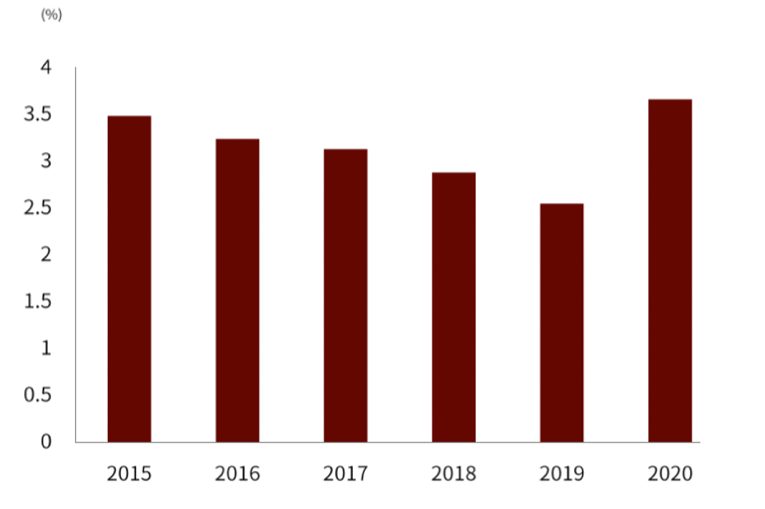
The demand for skill training of rural workers has increased significantly. The proportion of rural workers participating in vocational training dropped from 3.5% in 2015 to 2.5% in 2019, but rose sharply in 2020, reaching 3.7%, a record high in recent years. Compared with direct employment, it may take some time from learning a new skill to embarking on a new position, and the process usually abounds with challenges.
Figure 13: Proportion of rural workers participating in occupational training
Sources: Wind, Ministry of Human Resources and Social Security of China; CICC Research Department
Note: Proportion of rural workers participating in occupational training = times of occupational training / number of rural workers
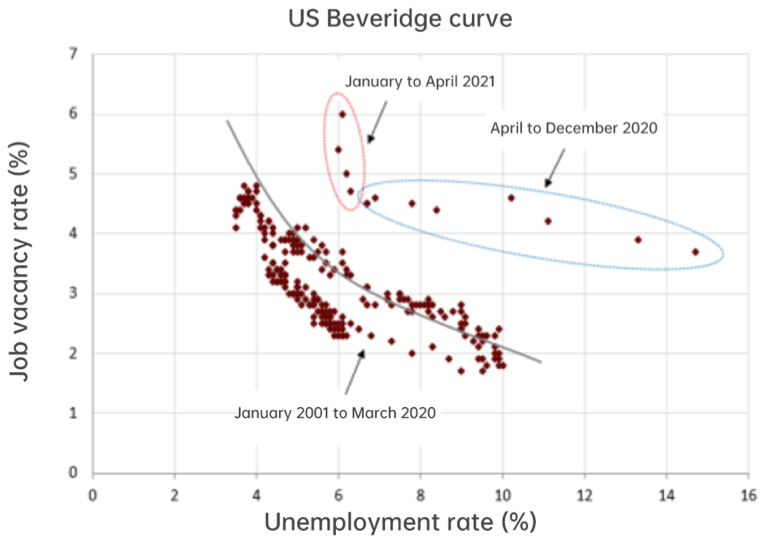
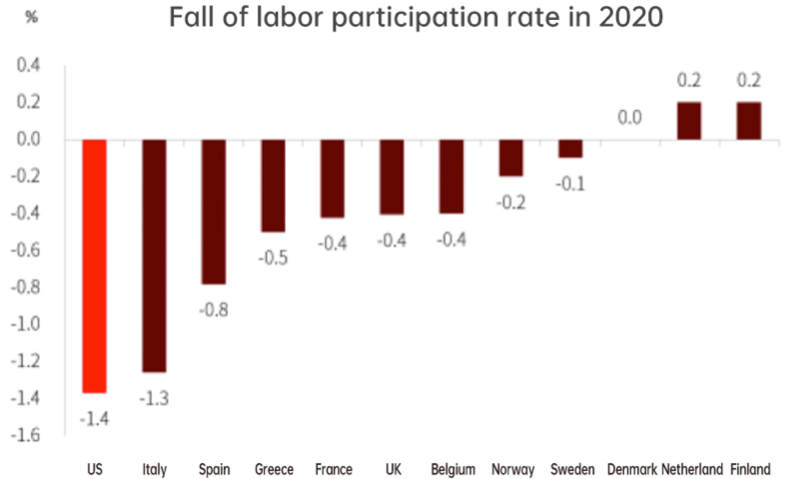
The mismatch between supply and demand in the US labor market is more serious than that in China. The unemployment rate and job vacancy rate both remain high, and the Beveridge curve (the curve that depicts the relationship between the unemployment rate and the job vacancy rate) has moved significantly outward. Enterprises are short of employees while many workers do not have jobs. Of course, the problems in the US labor market are not only the result of the pandemic shock, but also of fiscal stimulus. Since March last year, the US government has issued three rounds of cash checks to low- and middle-income residents, as well as additional weekly unemployment benefits to the unemployed. Some studies have shown that excessive government subsidies can reduce the motivation of the unemployed to seek a job. In the past two months, growth in non-agricultural jobs in the United States has fallen short of expectations, and an increasing number of companies have complained about staff shortage. We have also noticed that compared with other developed countries, the labor force participation rate in the United States fell more sharply in 2020, which may also be a result of higher government subsidies.
Figure 14: Mismatch between supply and demand in US labor market
Sources: Haver; CICC Research Department
Figure 15: Fall of labor participation rate in the US is larger than that in other countries
Sources: Dallas Fed; New York Fed; Richmond Fed; CICC Research Department
3. Supply chain problems persist
Overseas supply chain disruption persists, far exceeding market expectation. For example, in the third quarter of last year, we saw signs of chip shortages. In the past six months, the impact of chip shortages has aggravated. In addition to electronic products such as mobile phones, home appliances and automobile industries has also suffered supply issues due to chip shortages. Moreover, the reduced efficiency of shipping and high freight rates has significantly cut down the profits of small and medium-sized enterprises. Research shows that there has been a rise of delivery postponement of products of lower gross profit.
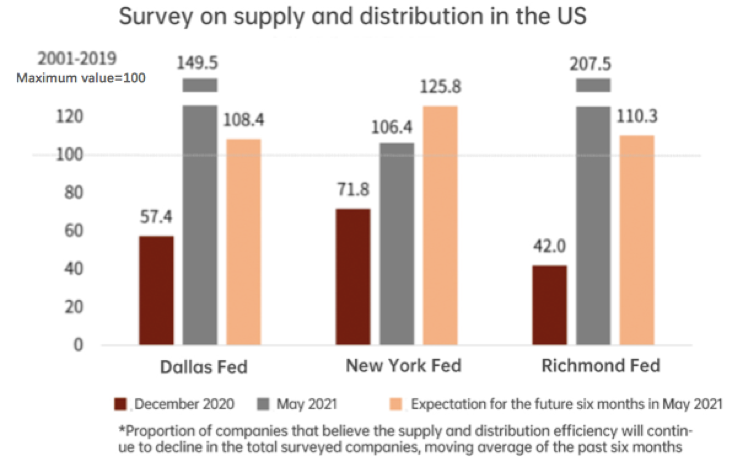
The mismatch of supply and demand in the US labor market has led to the continuous deterioration of its supply and distribution efficiency. According to surveys conducted by regional Fed banks, as of May 2021, the length of the supply and distribution cycle in the United States had far exceeded the maximum before the pandemic, and the proportion of companies expecting the situation to continue to worsen remains at a historical high. “Shortage” is more frequently mentioned in the Fed's Beige Book, especially shortages of labor, raw materials, containers and other transportation equipment.
Figure 16: The supply and distribution efficiency in the US may continue to deteriorate in the second half of the year
Sources: Dallas Fed; New York Fed; Richmond Fed; CICC Research Department
Figure 17: Mentioning of “shortage” in the Beige Book
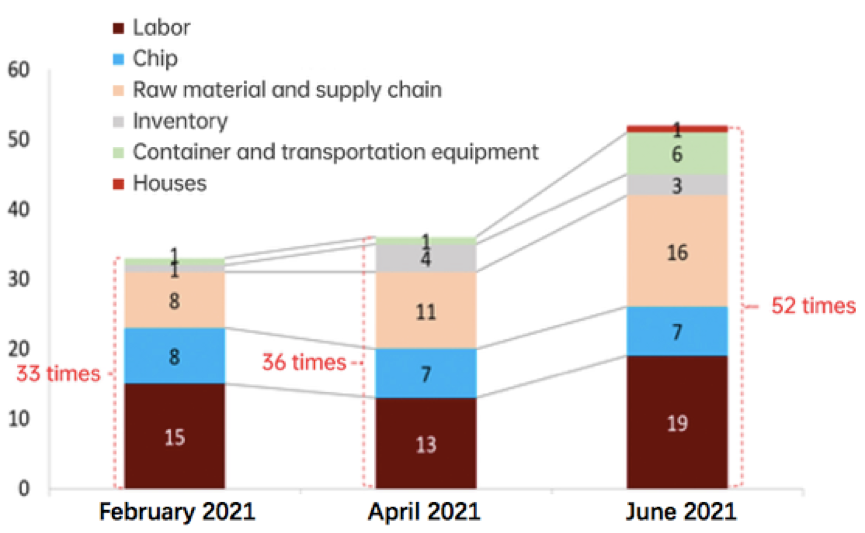
Sources: US Fed; CICC Research Department
The unresolved supply chain strain has plunged the United States into severe undersupply. We’ve observed that the proportion of empty containers has been on an upward ride on outbound vessels departing from ports in Los Angeles and New Jersey—creeping up to 69.7% and 66.2% respectively as of April 2020, both much higher than the pre-pandemic level of 60%. Moreover, the potential impact of the pandemic in developing countries on the supply chain is also noteworthy. Recently the virus surge in developing countries in Southeast Asia, Latin America and South Asia as well as the emergence of more contagious variants have led governments to tighten up control. In Vietnam, the number of confirmed cases has been increasing since late April, and a new variant more infectious by air was discovered, forcing the government to shut down several of its airports. In Malaysia where the new variant has also turned up, the number of daily new cases surpassed 5,000 as of June 7, and the country has implemented a national lockdown since June 1. On June 8, according to the data from the Ministry of Health of Brazil, the number of new cases in the country stood at 52,911, while the daily number in India was as high as 86,498. Obviously, the pandemic has not slackened its pace.
Figure 18: Undersupply in the US?
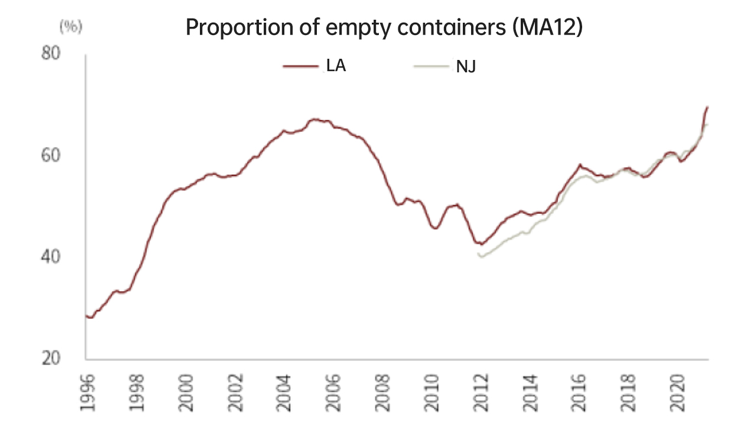
Sources: Wind; CICC Research Department
Figure 19: Number of new cases in some emerging market economies higher than 2020 peak
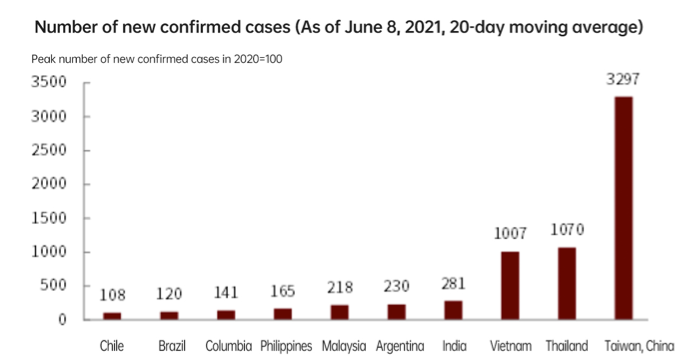
Sources: Wind; CICC Research Department
Industries with longer supply chains and higher dependence on the overseas market are exposed to higher risks. We measure the level of dependency upon overseas supply of different sectors along two dimensions: the length of overseas supply chain, and the value added overseas. The first represents the “quantitative” dependency as measured by the number of upstream production links occurring overseas, and the second reflects the “qualitative” dependency. As a result, industries nearer to the top right corner in Figure 20 are more vulnerable to the negative shocks of overseas supply chain disruptions. High-tech companies continue to suffer from risks of chip undersupply, including computer makers, electronics and optical manufacturers and car producers. Some of the sectors still face undersupply of overseas raw materials, such as coke and refined petroleum, base metal, chemicals and chemical raw materials, power and gas supply, rubber and plastic goods, and textile, garment and leather.
Figure 20: Measuring dependency upon overseas supply chains along two dimensions: length of overseas supply chain and value added overseas
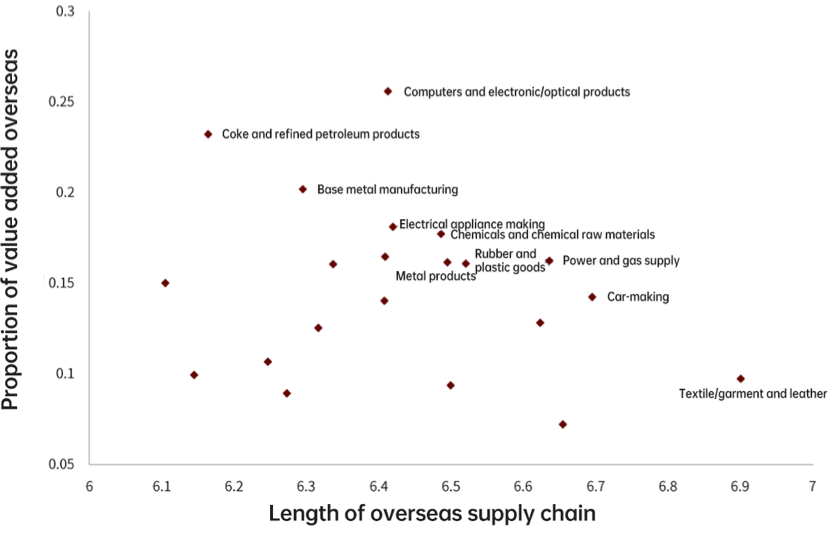
Sources: UIBE GVC Indicators (2014 data); CICC Research Department
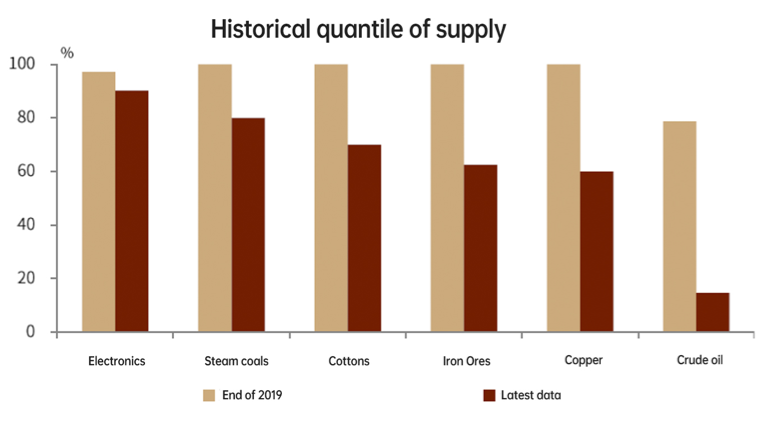
In the above analysis, we’ve combed through the situations of overseas production of several sectors that are highly dependent upon the overseas supply chain. The figure shows that the overseas supply is all strained in these sectors, with the level of production much lower than historical average, indicating the huge uncertainties facing the supply chain. For example, COVID-19 resurgence in Taiwan and Malaysia have sharply eroded global semiconductor testing and packaging capacities, exacerbating global chip undersupply. To be specific, King Yuan Electronics, Greatek Electronics and other semiconductor testing and packaging service providers in Taiwan have reported infections among their employees, with King Yuan suspending production for 48 hours; Malaysia decided to implement a national lockdown during June 1 - 14, suspending all economic activities except for a few critical ones defined by the country’s National Security Council.
Figure 21: Overseas supply remains strained3
Sources: Wind; CICC Research Department
China cannot rest easy even if it has a relatively well-established industrial system and a domestic supply chain that can still hold. In May 2021, the delivery time under the official manufacturing PMI was higher than the level which can be explained by seasonal fluctuations. For some of the key raw materials like chips, the negative impact of overseas undersupply and inelastic domestic supply has extended to many other sectors given the complementarity of goods, as evidenced by the slump in production and sales of automobiles in China in May. Meanwhile, growing frictions in the labor market made it difficult for businesses to fill the vacancies and put a constraint on production expansion. Production limits imposed out of environmental considerations have also exacerbated the undersupply of raw materials and price surge, increasing the cost of mid- and downstream businesses or even suppressing their supply.
III. Decline in supply elasticity is not transitory
We have examined the pandemic’s supply-side shock through its impacts on the labor market and supply chain. COVID-19 has intensified labor reallocation and supply-demand mismatch and its impact on supply chains is not going to diminish anytime soon.
What are the implications to the Chinese economy in the second half of this year and beyond? We can probe into this issue from short-term and long-term perspectives.
We believe that shocks to the labor market and supply chain will both impact supply elasticity, causing it to decline in general despite rise in certain sectors. This is no transitory phenomenon, but a long-term trend.
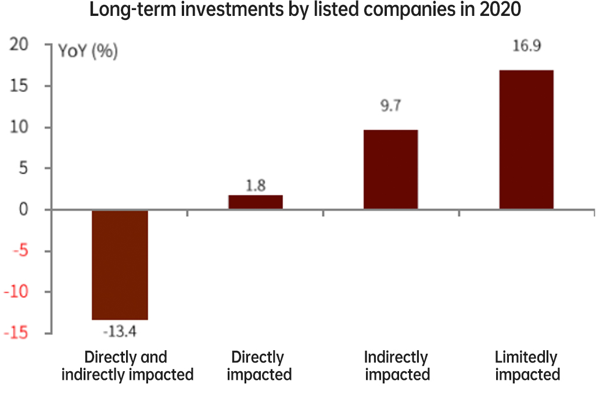
First, in the short-term, in China, the development of software and IT service related to online applications, logistics and retail related to online spending, and art, literature and publishing related to online recreational activities have all picked up pace. A review of the investments in different industries in 2020 shows that long-term investment in sectors which felt both the direct and indirect impacts from the pandemic dropped by 13.4% year on year; long-term investment in those largely immune to such impacts increased by 16.9%; and that in sectors suffering from only direct or indirect impacts stood somewhere in between.
Figure 22: Remarkable divergence in the investment behaviors of businesses amid the pandemic
Sources: Wind; CICC Research Department
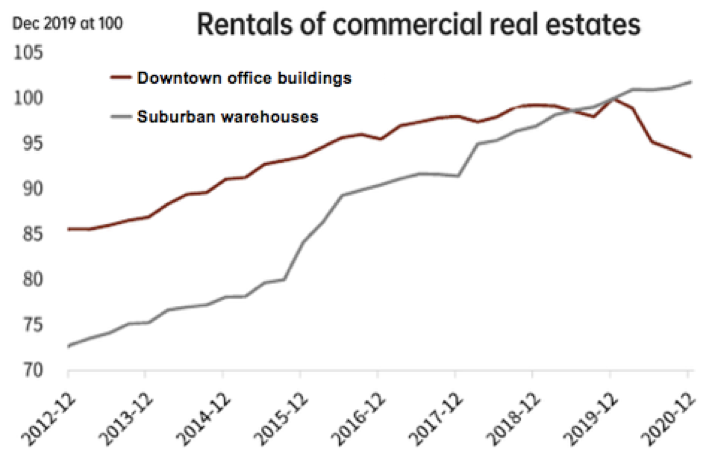
The donut effect observed in the commercial real estate sector also shows similar patterns. Unlike the United States where this effect is mainly seen in the residential housing market, China sees the effect turning up in the commercial real estate market. Amid the pandemic, many businesses moved online and caused factor reallocation. In 2020, rentals for office buildings in downtown areas dived, while those for warehouses in the suburbs soared.
Figure 23: Donut effect in China’s commercial real estate sector
Sources: Wind; CICC Research Department
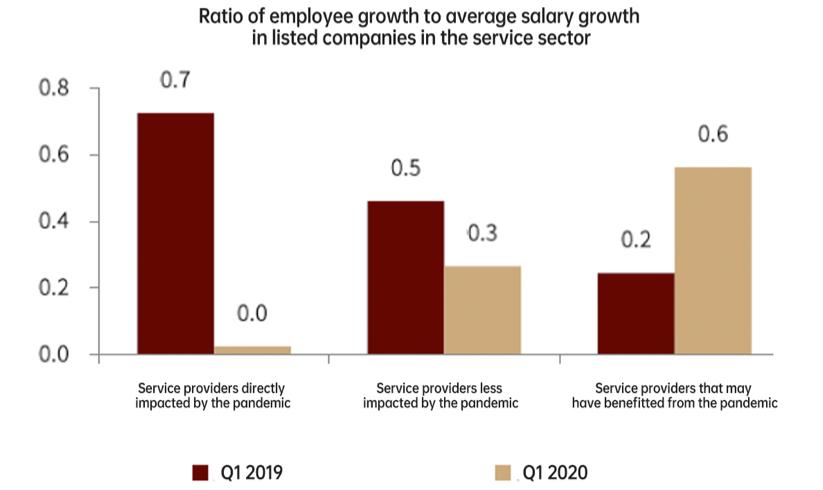
We expect that supply elasticity of the prospering industries mentioned above may rise. For example, in Q1 2021, the ratios of employee growth to average salary growth in these sectors especially the ones relating to digital economy stood at 0.64, much higher than the level in other sectors and the pre-pandemic level.
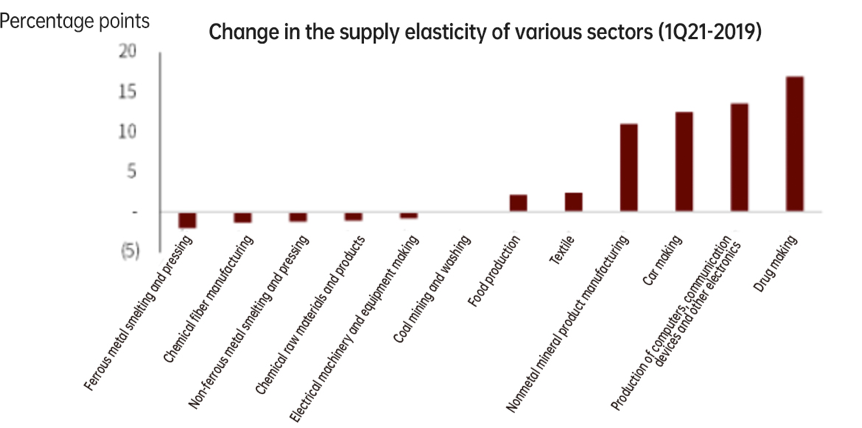
But this cannot reverse the overall decline in supply elasticity given that disruption is always a step ahead of innovation amid such reallocations. Supply elasticity of listed companies in the service sector that bore the brunt of the supply-side shock has already started to fall. The picture in the industrial sector is a bit more complicated: upstream industries such as miners and metal smelters and processors have a much lower supply elasticity than before the pandemic given their high dependence upon overseas raw materials and production restrictions imposed domestically amid the carbon neutrality and environmental protection drives; in contrast, the supply elasticity has increased in mid- and downstream firms as they are subject to fewer constraints, and their production activities are more responsive to price fluctuations.
Figure 24: Service providers who have benefitted from the pandemic show an increase in supply elasticity
Sources: Wind; CICC Research Department
Note: Growth rate for Q1 2021 is two-year composite based on the figure of Q1 2019.
Figure 25: Change in supply elasticity of various sectors
Sources: Wind; CICC Research Department
Note: Supply elasticity is change in capacity utilization / change in price fluctuation in the applicable period (Q1 2021 relative to Q1 2019, in this case).
In the mid- to long-term, as a result of the pandemic, supply chains will shorten, suppliers will be more diversified, firms will switch from emphasizing just-in-time production to just-in-case production (both efficiency and security). Labor will have more bargaining power, which will result in rising operation costs for businesses and lower supply elasticity.
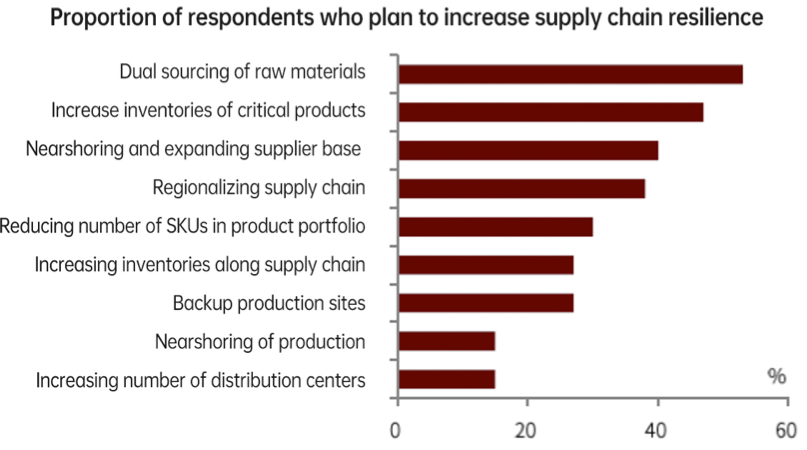
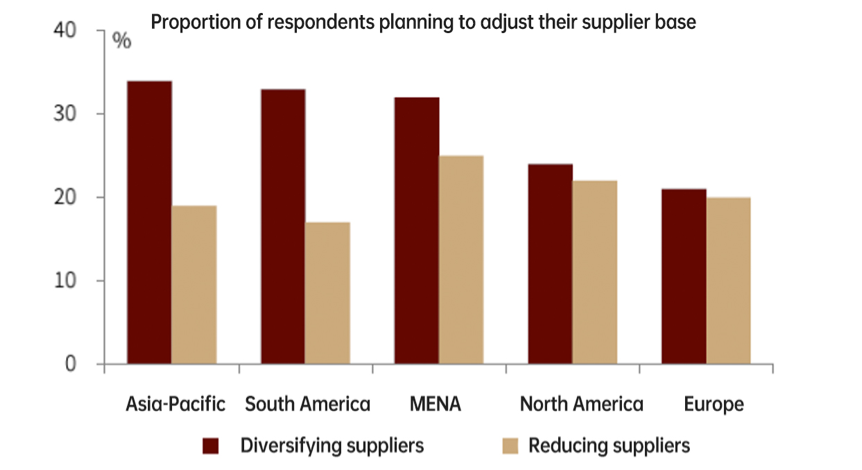
According to a survey by McKinsey, 53% of the respondents plan to implement supplier diversification strategies including turning to dual sourcing, expanding the supplier system and building more distribution centers in the post-pandemic era. Another survey by HSBC showed that the idea of supplier diversification is more popular with businesses in Asia-Pacific and South American countries. Moreover, over 30% of the businesses were considering measures such as nearshoring and regionalization to shorten their supply chains for the sake of security. As for the labor-capital relationship, the labor side seems to be gathering strength in the United States: Democrats are by nature biased toward the labor unions which may improve the negotiation power of labor, and the Biden administration is committed to supporting labor organizations, collective bargaining and labor unions.
Figure 26: Some businesses are planning on post-pandemic supply chain adjustments
Sources: McKinsey Global Institute; CICC Research Department
Note: Displayed is the result of the survey by McKinsey of global supply chain leaders in May 2020, which involves 605 samples.
Figure 27: Over 30% of the respondents in regions like the Asia-Pacific hope to have more diversified suppliers
Sources: HSBC; CICC Research Department
Note: Displayed are statistics from a survey for the period of September 11 - October 7, 2020. It involves over 10,000 businesses from across 39 jurisdictions.
History tells us that major events are usually followed by significant changes in corporate governance—as evidenced by the discussion above. This means the decline in supply elasticity may not be transitory; instead, it may prove to be a long-term trend. The rise of global investors in the 1980s, the economic crisis in Japan in the 1990s, the subprime crisis, the Asian financial crisis, the three waves of economic crises in the United States and Enron’s bankruptcy have all been important driving forces behind the evolution of corporate governance of both traditional and emerging companies. The COVID-19 pandemic has brought back to the spotlight issues such as the balance between firms’ social responsibility and corporate profit and that between shareholder and employee interests. In the post-pandemic era, business practice in multiple areas including green governance, emergency governance, network governance and compliance will all change. To improve emergency governance, prudent and flexible asset allocation would be more preferable, and businesses must strike a balance between efficiency and resilience.
VI. Economic growth feels the impact from both demand and supply
In 2H21, as countries around the world press ahead with vaccination, the pandemic is expected to further subside and the economy to continue the recovery despite resurgences in some of the emerging market economies.
Figure 28: Global vaccination progress
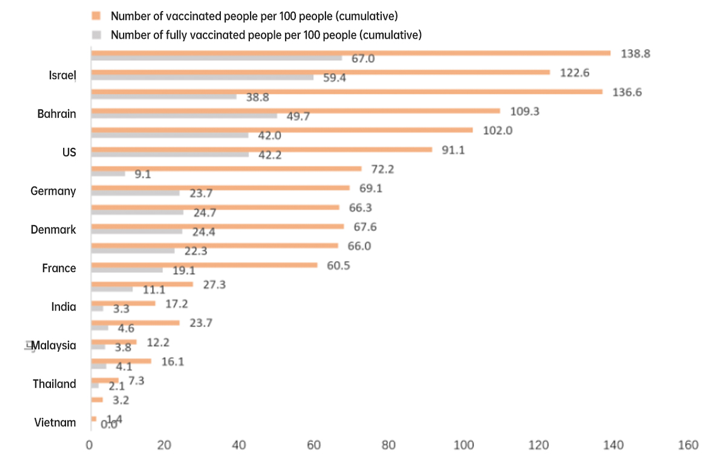
Sources: Our World in Data; Wind; CICC Research Department. Data as of June 10, 2021.
1. Inflation may extend beyond 2H21
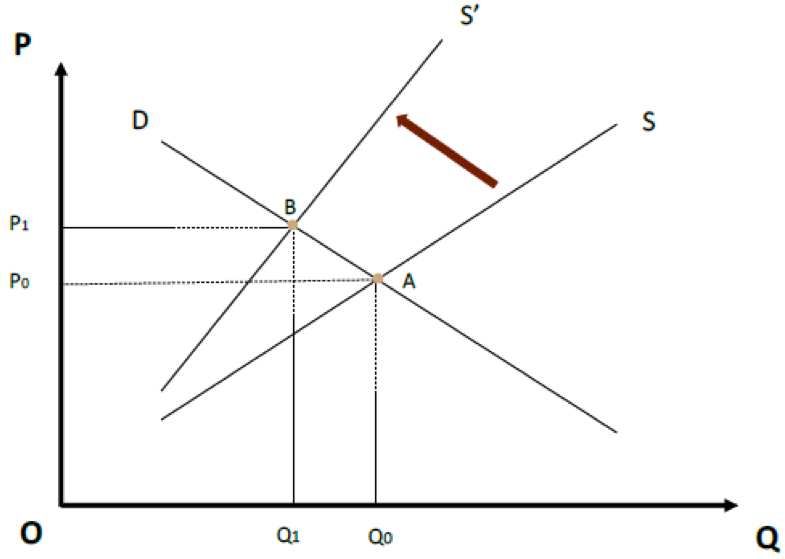
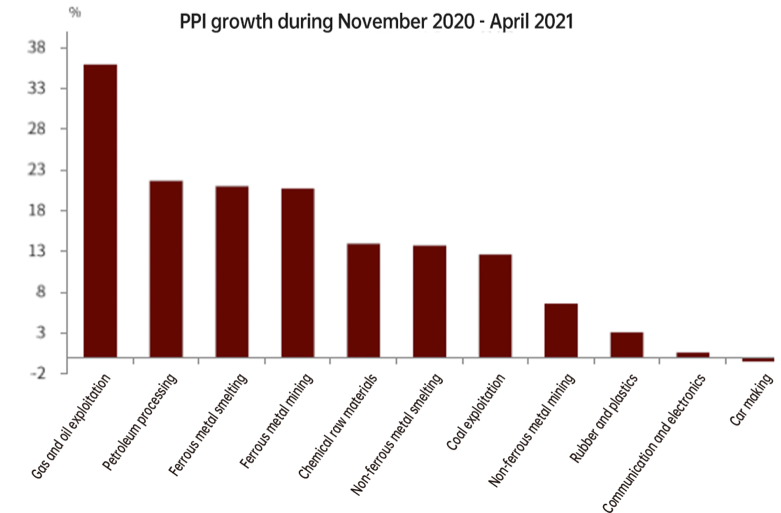
What are the implications of the supply-side shock to the economy, macro policy and the capital market? We think lower supply elasticity implies higher cost and price hike will sustain in the short term. As a result, supply shortage will suppress economic growth. As seen in Figure 29, even if the demand remains unchanged, the supply curve will become steeper, leading to less output and higher prices. With regard to the cost, the PPI will stay at a high level. We have examined the price hikes of 11 industries in China with limited domestic supply that are easily affected by overseas supply chain disruptions (Figure 30). Oil and gas exploitation experienced the sharpest price hike, while the price of cars was still falling year on year. It’s also important to keep an eye on latent price hikes of products that haven’t seen much price increase and the potential transmission to price levels in downstream industries.
Figure 29: Lower supply elasticity: less output and higher prices
Source: CICC Research Department
Figure 30: Some of the undersupplied products remain cheap
Sources: Wind; CICC Research Department
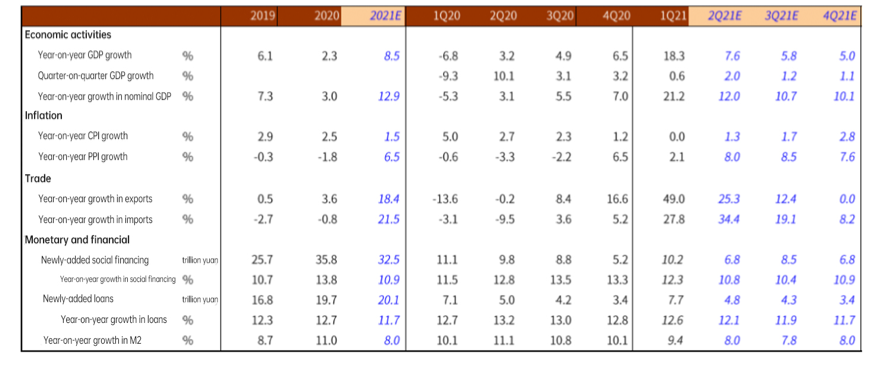
In the base scenario, according to our estimate, if in Q3 and Q4 the price of Brent crude stands at 75 and 72 USD per barrel, the price of copper, 10,000 and 10,000 USD per ton, the price of screw-thread steel, 4,800 and 4,600 yuan/ton, and steam coal, 700 and 750 yuan per ton, based on historical data on the transmission of prices from the commodities to mid- and upstream sectors with restrained supply and from those sectors to PPI, we predict the year-on-year growth of PPI to be 8.0%, 8.5% and 7.6% for Q2-4, respectively, and the annual figure, somewhere around 6.5%. As for the CPI, the year-on-year growth of food CPI for Q3 could be low given the decline of pork price, but non-food CPI will continue to rise partly because of the transmission from the PPI. At the same time, as spending on services picks up, the CPI for tourism and other sectors in the service industry will also grow faster year on year, with the number for Q2-4 projected at 1.3%, 1.7% and 2.8% and the annual figure at 1.5%. However, the rise in CPI will be much lower than the rise in PPI because of insufficient demand as a result of debt burdens to be discussed below.
Now, if we assume a high-risk scenario with stronger transmission from the undersupplied sectors to mid- and downstream sectors, where communication electronics and automobile production sees price hikes resulting from chip shortage similar to the last wave in 2016-2018, the year-on-year PPI growth for Q2-4 is projected to be 8.3%, 9.1% and 8.5% respectively, and the annual number at around 7.0%; year-on-year growth in CPI for Q2-4 could be 1.3%, 2.1% and 3.4%, and annually at 1.7%.
As mentioned above, decline in supply elasticity could be a long-term trend, which means that inflation will also extend beyond the 2H21 horizon. In addition to the pandemic, China’s carbon reduction drive will also add to businesses’ operation costs and push up inflation.
2. Undersupply coupled with debt burdens will hinder long-term growth
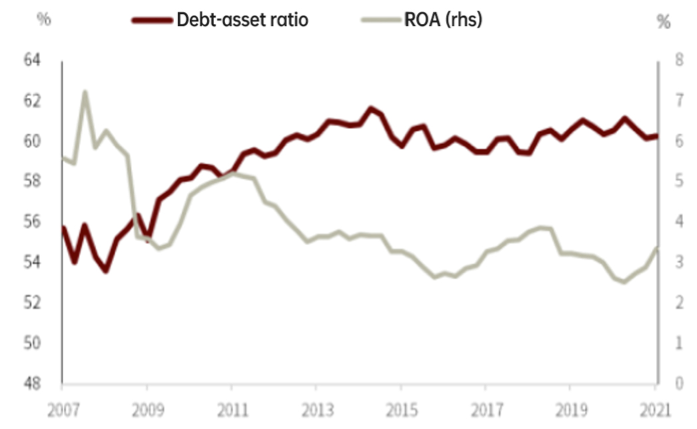
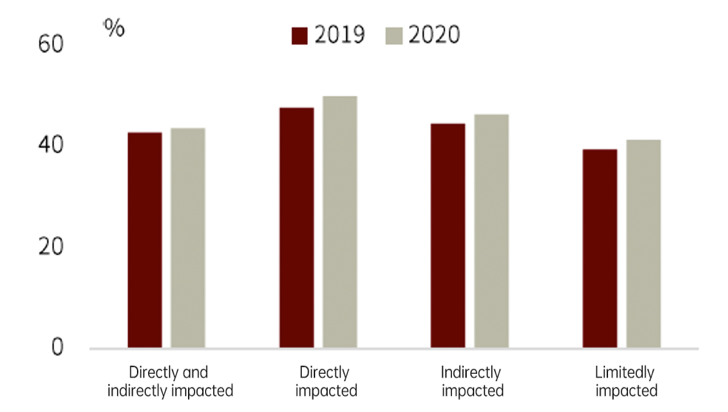
Parallel to the supply-side shocks which have pushed up prices and inhibited growth, debt problems accumulated amid the pandemic will also arrest growth from the demand side. Over the past year, China has been resorting to credit expansion to cope with the negative impact of COVID-19. While having sustained the cash flows of non-governmental sectors and helped avoiding massive defaults in the short term, this has added to the debt pressure and the financial risks in the medium run. In 1H20, the debt/asset ratio of A-shares listed companies swelled and their profitability indicators worsened, but the situation has improved since the second half of last year. Companies listed on the National Equities Exchange and Quotations (NEEQ) recorded heavier debt burdens, indicating worse problems among small- and medium-sized businesses.
Figure 30: Financial performance of companies listed on the A-share market
Sources: Wind; CICC Research Department
Figure 31: Debt burdens of small- and medium-sized businesses listed on NEEQ
Sources: Wind; CICC Research Department
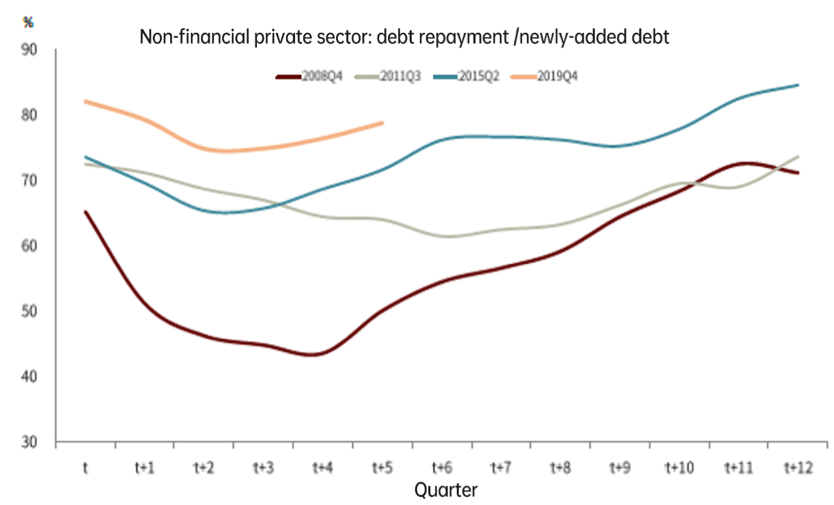
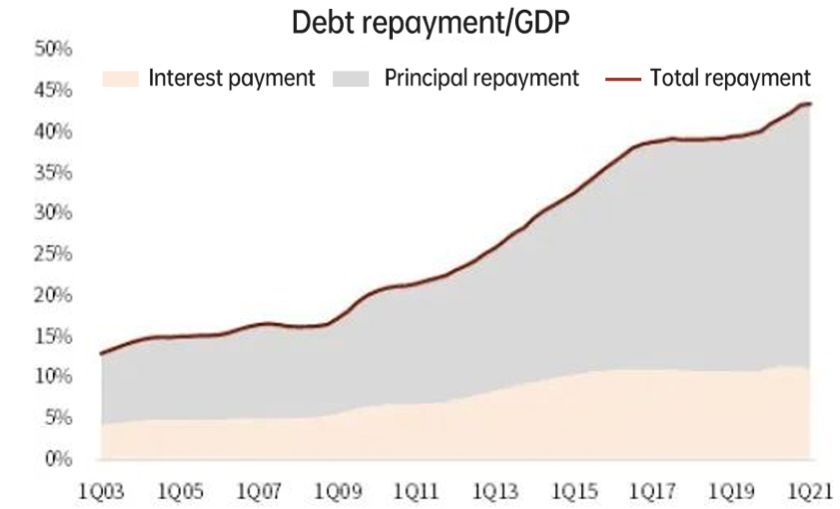
Data show that debt repayment burden of non-financial private sectors and its proportion in GDP are still on the rise. We need to note that higher costs could erode business profitability and make it harder for non-financial sectors to pay back their debt, thus adding to potential credit and financial risk.
Figure 32: Debt service pressure of the private sector still on the rise
Sources: BIS; Wind; CICC Research Department
Figure 33: Debt repayment/GDP
Sources: Wind; CICC Research Department
We expect actual GDP growth in 2H21, whether year-on-year or quarter-on-quarter, to weaken, and our forecasts of the year-on-year GDP growth for Q2-4 are 7.6%, 5.8% and 5.0%, respectively, with the annual projection at around 8.5%; the quarter-on-quarter growths are predicted at 2.0%, 1.2% and 1.1%. To be specific, export will remain high, with a projected annual growth rate of 18.4%, and the figure for Q4 could be about the same as Q4 2020. The downward risk mainly comes from the substitution of goods consumption by service consumption. Divergence in investments in different sectors may continue, with manufacturing investments expected to pick up slightly with an annual year-on-year growth of 7.1%.
Investment in real estate development will remain resilient. Last August, some of the real estate developers started to cut back on unnecessary groundbreaking because of tightened policies on real estate financing; since this February land supply has grown in a much slower pace because of policy reorientation toward concentrated supply of land, which also dragged the progress of real estate construction. Going forward, we expect that China will maintain tight real estate policies, but as some of the land in concentrated supply comes into use, it could support real estate investment to a certain extent. Our estimate is that real estate investment could increase by about 10% in 2021, and the quarterly growth could be front-loaded. Annual broad and narrow growths in infrastructure investment are expected to be 3.5% and 2.7%, respectively; wind power installation may experience downturns, while public utility investment may see a return to steady growth; on the narrow infrastructure side, net local investment may tighten, while the special bonds issued may hardly be used up, and part of the demand is expected to be fulfilled by public-private partnerships (PPP). Considering the high base in 2Q20 and 3Q20, infrastructure investment could experience negative monthly growth at times.
Consumption will recover mildly, but can hardly resume its pre-pandemic level. In Q1 2021, with the virus resurging in some parts of the country and people staying put during the Spring Festival, the two-year average year-on-year growth in total retail sales of consumer goods was 4.1%, much lower than that in Q4 2020. Now that these negative factors are no longer at play, we expect consumption to see a gentle recovery. The annual year-on-year growth in total retail sales of consumer goods is expected at around 14.8%, and the two-year average compound growth, 5% (compared to the year-on-year growth in 2019 at 8%). Constrained by the employment problem, the debt issue and other factors, consumption recovery may not be very resilient; and given that consumer spending on services will pick up slowly, we believe that two-year average year-on-year growth in total retail sales of consumer goods will increase quarter by quarter, but still lower than before the pandemic even by the end of the year.
Inflation prospect in China is different from that in the United States. The United States suffered greater supply-side shocks, and at the same time it also injected bigger fiscal stimulus, both of which added to the momentum of inflation despite strong economic growth. In comparison, China implemented relatively modest fiscal stimulus, and with heavy debt suppressing demand, the economy actually faces downward risks.
3. Tight credit policy, loose monetary policy and expansionary fiscal policy
Inflation rise triggered by supply-side shocks is not expected to lead policymakers to tighten the monetary policy; and given the heavy debt service pressure, China needs to tighten its credit policy, which also requires a loose monetary environment. In May, net credit financing was in the negative territory, and non-standard financing kept declining, but banks’ credit may have played a bigger role. We predict that by the end of the year, growth in social financing may fall back to around 10.9% (with the lowest point coming in the third quarter at around 10.5%), and growth in broad money may reach somewhere around 8.0%. Last year, to counter the pandemic’s blow, local government debt surged by 30%, and as a result debt issuance approval became more cautious in order to prevent credit risks; after the Yongcheng Coal default, some of the state-owned enterprises in China also faced financing difficulties. While maintaining prudence in general, Chinese policymakers have marginally tightened monetary policy in the first half of the year, but in the second half they may marginally loosen it, slightly paring down the long-term interest rate. In terms of the exchange rate, there will be limited space for Renminbi to further appreciate given the strong recovery in the United States and the weakened momentum of the Chinese economy. Renminbi’s exchange rate may even decline moderately.
Generally speaking, macroeconomic policies going forward will still feature the combination of tight credit policy, loose monetary policy and expansionary fiscal policy. Fiscal policy is anticipated to play a bigger role in private-sector deleveraging, disposal of financial risks and income distribution adjustment. Of particular note, mechanisms such as inclusive finance are quasi-fiscal measures with Chinese characteristics.
As for structural policies, the priority is efficiency improvement given lower supply elasticity. To this end, boosting technological innovation and digital transformation as well as curbing monopoly and stimulating fair competition are all essential. In addition to addressing traditional concerns like asset bubbles and financial risks, China needs to understand the monopolistic nature of the real estate sector and the role it could play in pushing up supply-side costs and worsening income distribution. Therefore, it’s imperative to enhance real estate regulation through the collection of real estate tax, among other measures, to make real estate less of a financial asset.
Figure 34: Prediction of major macroeconomic indicators
Sources: Wind; CICC Research Department
Endnotes:
[1] The official data for the end of 2019 have not been released. We estimated the total number of netizens and the net increase for the year at the end of 2019 based on the total number of netizens and net increase in the first half of 2019.
[2] Taobao Village refers to a village where the number of active online stores reaches more than 10% of the number of local households, and the annual e-commerce transaction volume reaches more than 10 million yuan. Taobao town refers to a town that has three or more Taobao villages.
[3] The figure for electronics is the weighted historical quantile of the production growth rate in Taiwan (China) and South Korea; the figure for steam coals is the historical quantile of the yield in Australia; the figure for cottons is the historical quantile of the aggregate yield of Brazil, India and the United States; the figure for iron ores is the historical quantile of the total shipment of Australia and Brazil; the figure for copper is the historical quantile of the yield in Peru; and the figure for crude oil is the historical quantile of the aggregate output of the United States and OPEC countries. The figures for electronics and crude oil are monthly for the period during early 2011 to April 2021; figures for coals and cottons are annual data for the period from early 2011 to 2020; the figure for iron ores is monthly from 2014 to April 2021; and the figure for copper is monthly from 2012 to April 2021.
[4] Both growth rates are two-year compound.
Download PDF at: http://new.cf40.org.cn/uploads/20210701pws.pdf