
Abstract: In this paper, the author provided an in-depth analysis on three key facts about economic recovery from the COVID-19 pandemic, and based on which, put forward several predictions about future economic activities. The first fact is the obvious substitution of service consumption by goods consumption during the pandemic which may reverse after global economy reopens; the second is the prolonged supply shortage in some areas such as oil and chips which may push up inflation in the midterm; and the third is the sustained rise of precautionary savings which will hinder economic recovery even as the pandemic recedes.
The COVID-19 pandemic is the most serious influenza the human society has ever encountered in the past 100 years, with considerable uncertainties associated with the medical treatment of the disease, impacts on economic activities and policy response from governments. People’s understanding and judgment at the early stage of the pandemic have been proved to be insufficient but have gradually improved.
At present, developed countries have the pandemic largely under control, and most emerging market countries are seeing progress as well. With the momentum in some countries significantly strengthened, the recovery of the global economy seems increasingly promising. It is against this background that we sought to describe some of the main features of economic activities, and based on which, provide predictions on their future trend.
I want to focus on three characteristic facts about economic recovery from the pandemic which we failed to foresee at the onset of the outbreak. Even now, our understanding of some of the facts remains vague, which can affect our prediction about future economic activities as well as analysis of the financial market.
Fact 1: Substitution of service consumption by goods consumption
From the very beginning, we were well aware that pandemic-induced sharp contraction in economic activities and cash inflows could seriously inhibit people's consumption. But for a long time, we haven’t paid sufficient heed to other forces at play: the pandemic has exerted extremely uneven impacts on economic activities and consumption, especially after the panic stage.
Simply put, the pandemic has a very strong inhibitory effect on consumption activities that require contact (mainly in the service sector) due to social distancing rules and people's fear of contracting the virus; but for the consumption of goods, the simple purchase process, the relatively small chance of contagion and the option of online shopping have protected such consumption from being badly affected by the pandemic.
Building on this observation, we then found that restricted service activities have led to a strong substitution of service consumption by goods consumption.
Put in simplified theoretical terms, higher risk of infection and inaccessibility to many services due to social distancing indicate a sizable rise in the real prices of services. Therefore, under the same income constraint, people turned to goods consumption to replace service consumption.
Let’s have a look at some key facts:
First, global goods consumption is especially vigorous.
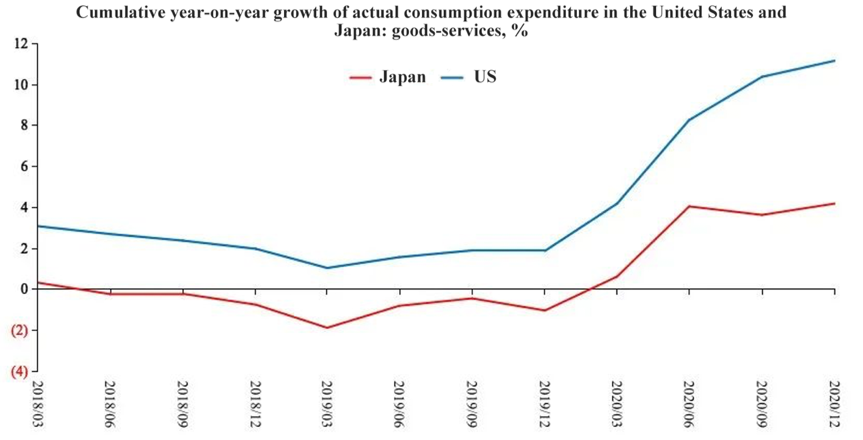
Figure 1: Cumulative year-on-year growth of actual consumption expenditure in the United States and Japan
Sources: Wind; Essence Securities
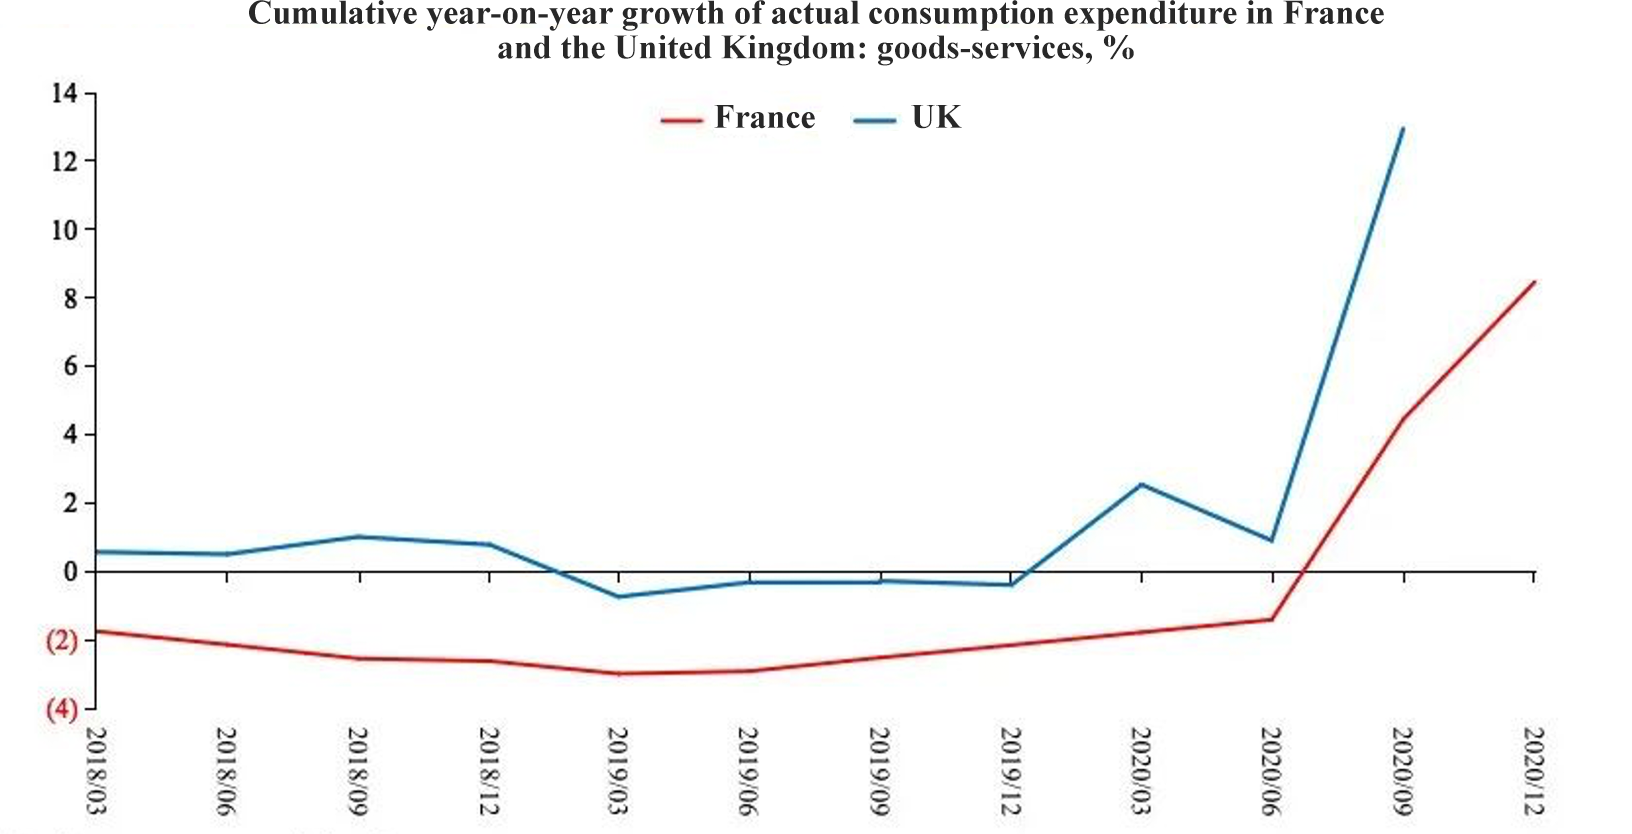
As shown in Figure 1, the difference between the growth of goods consumption and service consumption in the US and Japan (the growth of goods consumption expenditure minus the growth of service consumption expenditure) has generally remained stable before the outbreak of the pandemic. After the pandemic broke out, the consumption of goods relative to the consumption of services has seen a very large increase in both countries. A similar pattern can be observed in Europe (Figure 2).
Figure 2: Cumulative year-on-year growth of actual consumption expenditure in France and the United Kingdom
Sources: Bloomberg; Essence Securities
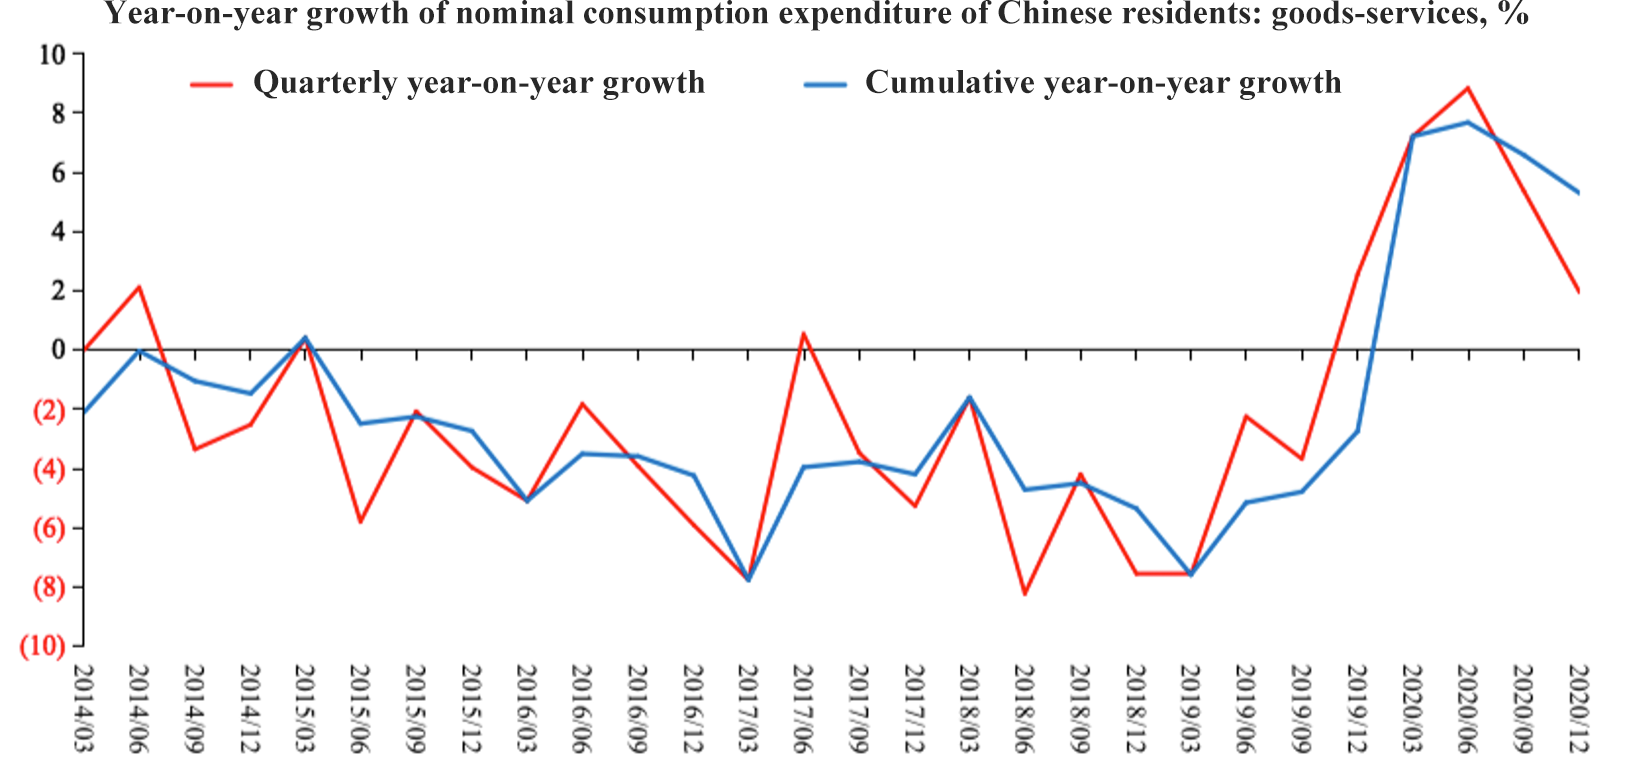
Figure 3: Year-on-year growth of nominal consumption expenditure of Chinese residents: goods-services
Sources: Wind; Essence Securities
Note: Household and government consumption data are only available in annual terms, and those for 2020 have not yet been released We used a combination of household consumption expenditure items as proxies, lumping food, tobacco, alcohol, daily necessities, and other goods together as goods, and housing, transportation and communication, education, culture and entertainment, and medical care as services.
Figure 3 demonstrates what happened in China. There is no doubt that a very strong substitution of service consumption by goods consumption had also occurred in China and lasted for a very long time until the virus was fully controlled.
From the existing data structure, we may not be able to see the effect of substitution directly. Instead, we can see a large decline in service consumption and a relatively small decline in goods consumption, which also provides a perspective to interpret the data. To address this issue, I further calculated the growth rate of global consumption of goods, mainly that of the United States, China, Japan, France, and the United Kingdom. Data for more countries are not available, but the mentioned economies in total account for a large enough share of global GDP.
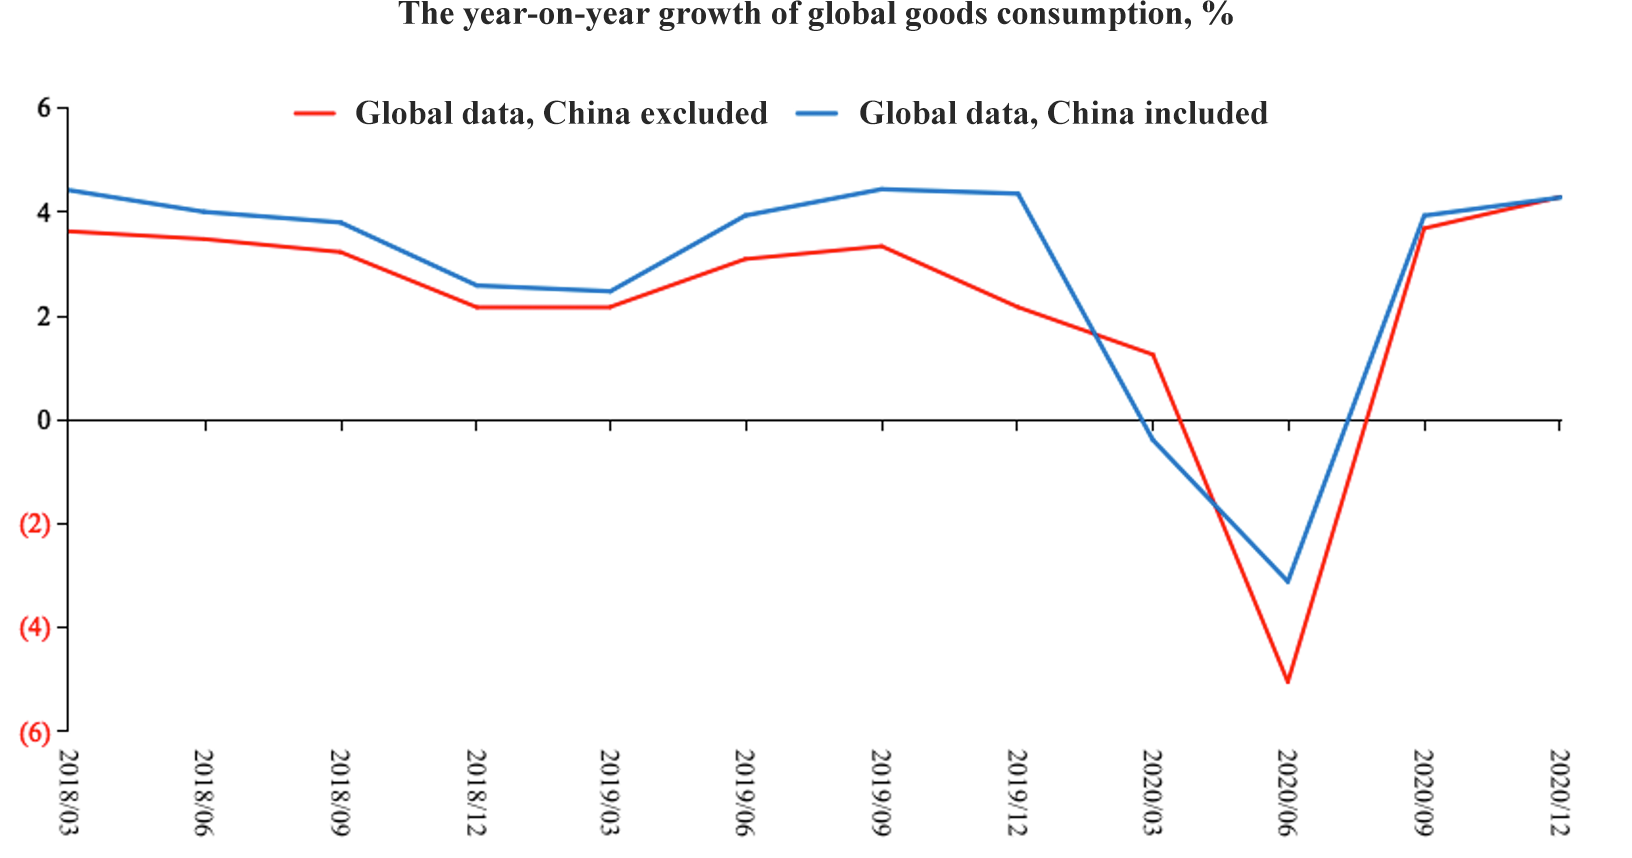
Figure 4: The year-on-year growth of global household goods consumption
Sources: Wind; Bloomberg; Essence Securities
Note: Here the global growth rate is the weighted average growth rate of household goods consumption in the US, France, UK and Japan.
Figure 4 shows the growth rate of global consumption of goods. There are two lines in the figure, one includes and the other excludes the data for China.
It is worth noting that when China is excluded, the growth rate of global goods consumption during the fourth quarter of 2020 when the pandemic was still running rampant worldwide, significantly exceeded the pre-pandemic level. Even when China is included (China’s consumption of goods had already begun to decelerate in Q4 last year), the growth rate of global goods consumption in the fourth quarter of last year had at least caught up with the level before the pandemic, but global economic activities in the same period were far from recovering to the previous level. This is very powerful evidence proving that the consumption of goods was exceptionally strong.
Second, the growth of global trade rebounded strongly.
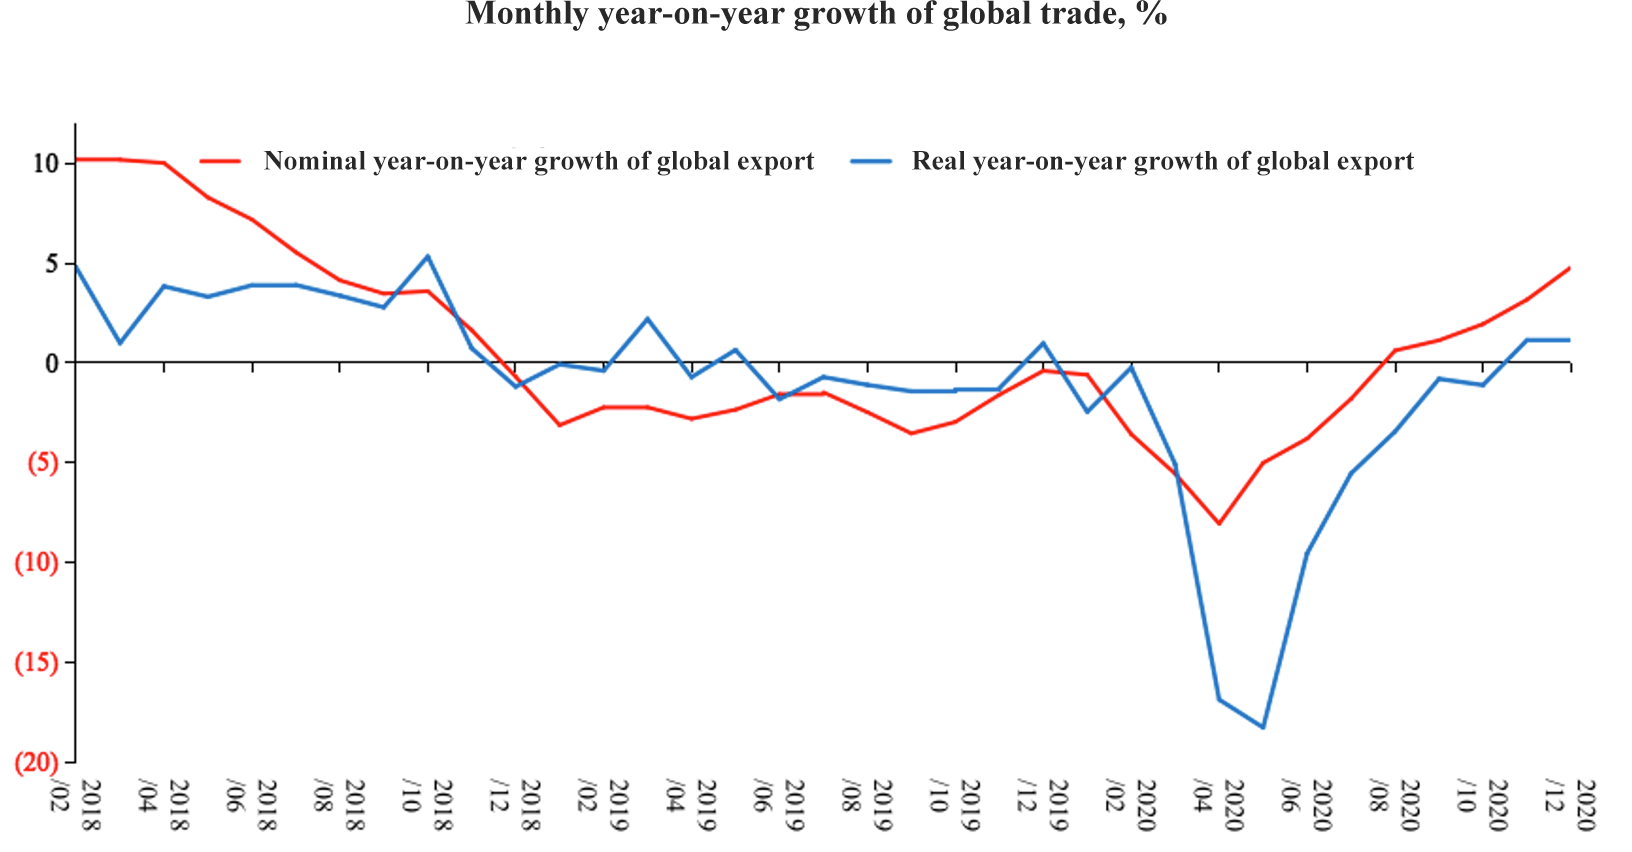
Since a large amount of global consumption of goods is realized through trade, a consequent change is that although the global economy has been hit badly by the pandemic, global trade experienced a robust recovery at a very early stage.
In the fourth quarter of last year, the nominal growth of global trade significantly exceeded the pre-pandemic level. Even excluding the impact of price factors, the growth rate of global trade in Q4 last year and Q1 this year reached a record high since 2018, well above the overall level of 2019 (Figure 5). This change is linked to the unusually high growth of global trade in goods.
Figure 5: Monthly year-on-year growth of global trade
Sources: Bloomberg; Essence Securities
Third, growth of global industrial activities has exceeded the pre-pandemic level.
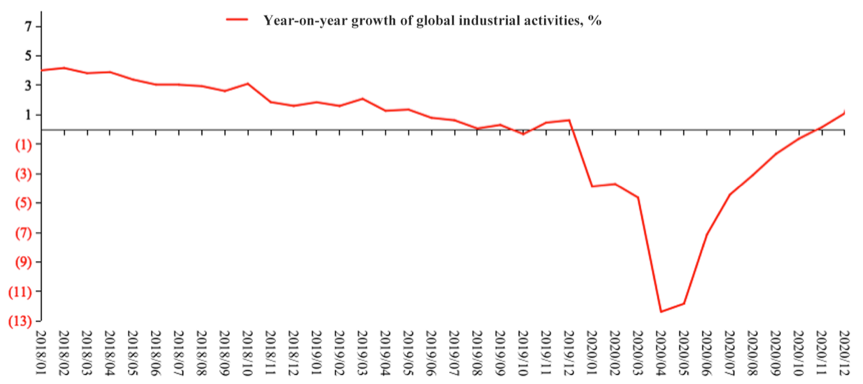
Goods production is largely realized through industrial activities, so we also need to study the growth rate of global industrial activities. Although the pandemic dealt a heavy blow to the global economy, and the growth rate of global income in the fourth quarter of last year was very low, the growth of global industrial activities during that period exceeded the pre-pandemic level (Figure 6).
Figure 6: Year-on-year growth of global industrial activities
Source: Bloomberg
Based on the above data, the first key characteristic fact 1 want to demonstrate is that the impact of the pandemic on economic activities is highly asymmetrical.
This asymmetry was more serious than what I expected a year ago. Due to the strong substitution of service consumption by goods consumption, the economic activities in global industrial production, trade, and goods consumption caught up with or exceeded their pre-pandemic levels in Q4 last year. This change actually explains many phenomena to be discussed in the following part.
Following the above explanation, an important issue I want to discuss is that the substitution of service consumption for goods consumption will be reversed as global economic activities restart in all respects, the pandemic comes gradually under control, and service consumption recovers. At the same time, since a large portion of goods consumption is consumption of durable goods which can last for a long time, the growth of goods consumption we have seen has actually overdrawn future consumption of durable goods.
Fact 2: The impact of restricted supply
Recently, with the rise of commodity prices, we see a lot of discussions about imported inflation.
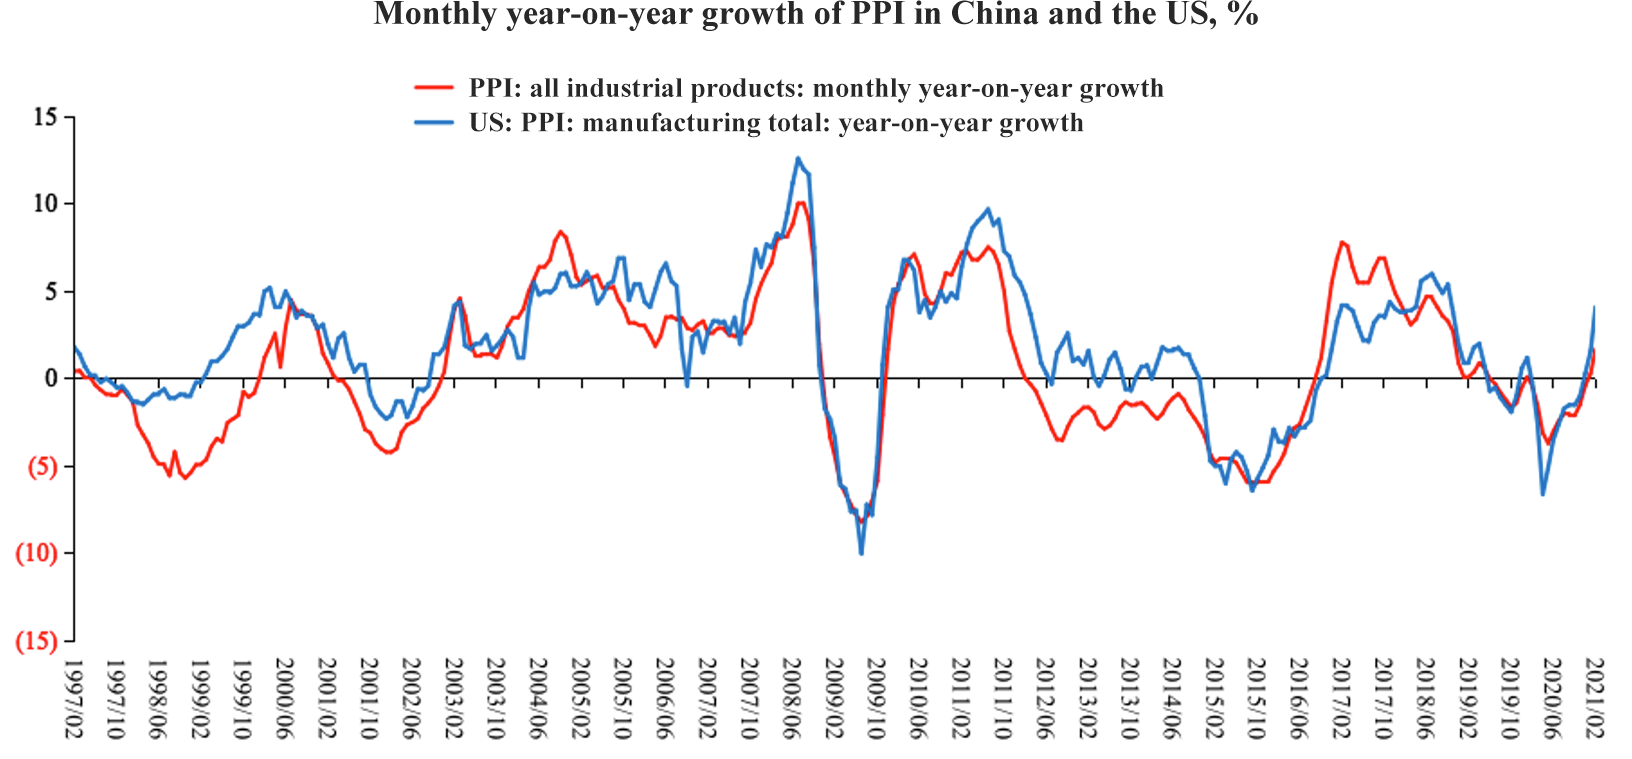
Figure 7: Monthly year-on-year growth of PPI in China and the US
Sources: Wind; Essence Securities
Figure 7 shows the comparison between the prices of Chinese and US industrial products (more precisely the price index of intermediate inputs in the case of the US) since the late 1990s.
I first made this comparison in 2003. At that time, I wanted to explain that the price formation for China’s industrial products is part of the global price formation. Now this conclusion is still valid. Fluctuations in China's industrial product prices and global industrial product prices are highly synchronized even on a monthly basis. This means that when we look at the prices of the Chinese manufacturing sector, we need to view it through a wider lens.
In this context, let’s discuss another key fact. Sometimes economic activities can drop sharply when hit by a strong external shock and later will rebound.
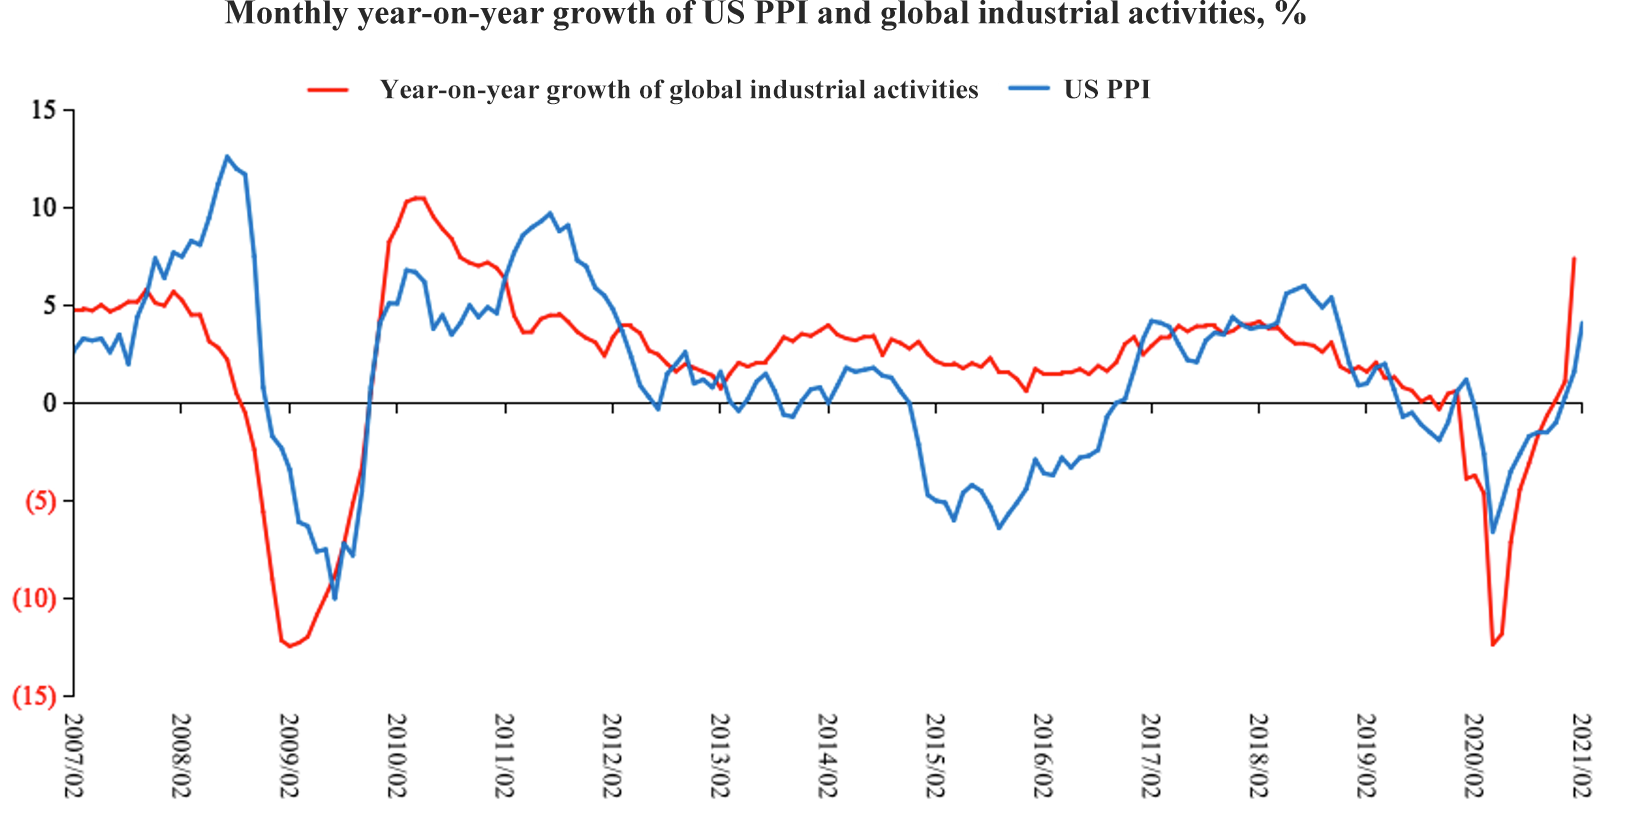
Figure 8: The elasticity of PPI changes during global economic recovery
Sources: Wind; Essence Securities
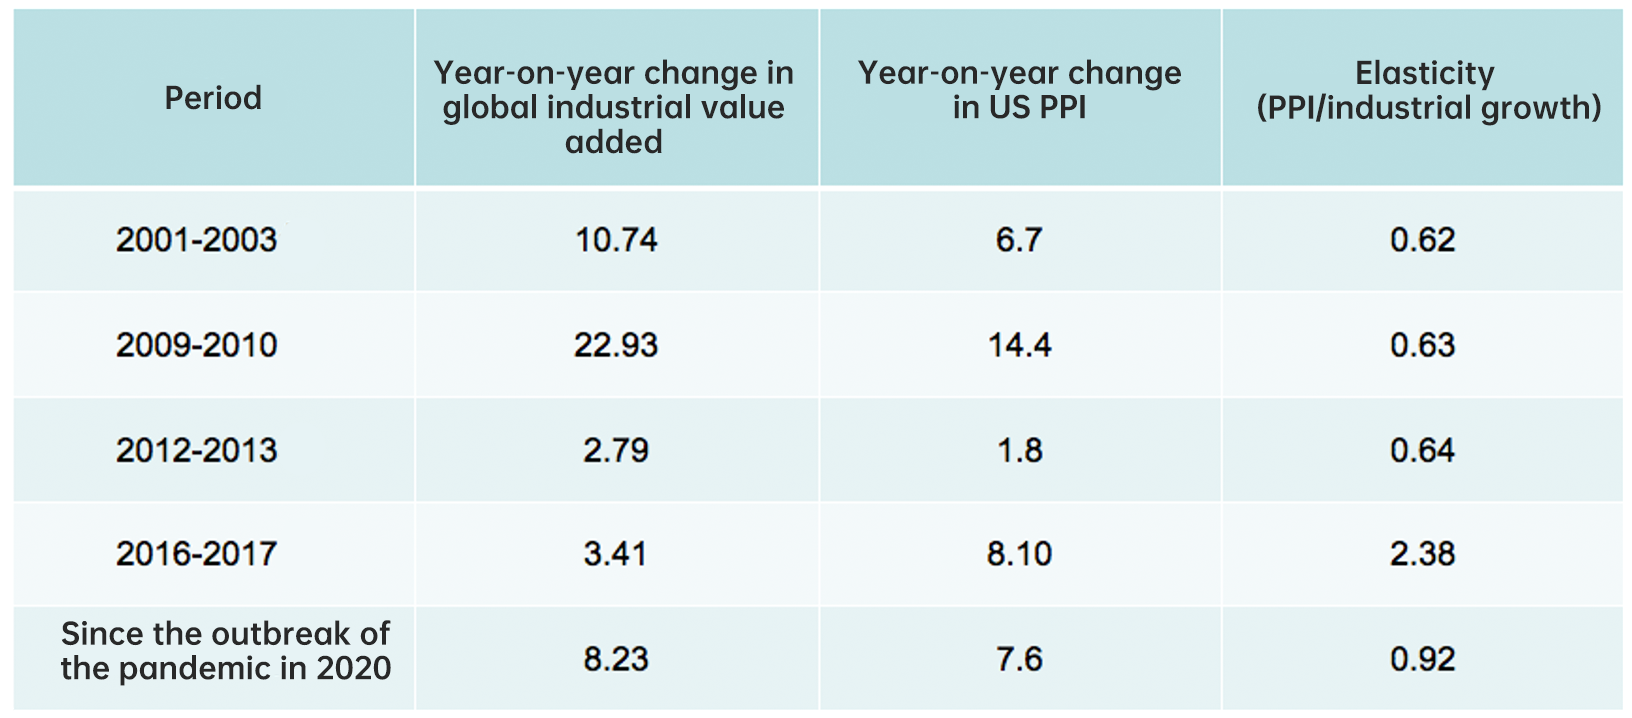
As shown in Figure 8, I studied five significant rebounds in global economic activities in the 21st century. First, I calculated the acceleration of the growth rate of global industrial production during the process where the economy grows from the bottom to the top. For example, during the global economic recovery from 2001 to 2003, the growth rate of global industrial production accelerated by 10 percentage points; during 2009-2010, it was 23 percentage points; and during the latest period (since the outbreak of the pandemic in 2020), 8 percentage points.
Second, I calculated the price changes of intermediate goods in the United States. The changes of the price of intermediate goods in the United States and China are completely synchronized (Figure 7). After calculating the acceleration of output growth, we can work out the increase in the price of intermediate goods in the United States during the recovery of global economic activity.
In this way, I can further calculate price elasticity, which is the increase in the prices of industrial products when economic activity accelerates by one percentage point, obtained by dividing price change with the change in industrial production.
Figure 9: The elasticity of PPI changes during global economic recoveries
Sources: Wind; Essence Securities
According to the table, the elasticity of industrial product price hovers around 0.63 in normal times, 0.62 in 2001-03, 0.63 in 2009-10, and 0.64 in 2012-13. In 2016-17 it ballooned to nearly 2.4, 4 times the normal level, which could mainly be explained by the supply-side structural reform, during which mandatory overcapacity cuts on coal, steel and chemical productions significantly suppressed supply and sent the price on an upward ride. At such times, any calculation based only on the demand side would produce an abnormally high elasticity.
The price elasticity of industrial products has stayed around 0.9 since the pandemic hit in 2020, about 50% higher than its normal level. Such a review of the past trend sheds some lights:
First, based on historical experience, two thirds of the current surge in the price of industrial products might be attributed to the recovery of demand, and the rest, to suppressed global supply.
The most convincing evidence for the latter is the particularly robust growth in China’s export last year, which was no less impressive than the strong recovery in global trade and consumption of goods. An important reason for this is that many orders went to China as it managed to bring the virus under control earlier than the rest of the world where supply capacities remained bogged down. From a global perspective, the boom in China’s export in 2020 was evidence of the dent in global supply.
The constraints on global supply is also evident when we look at the changes in the global crude oil market. Before the pandemic, the three major oil producers in the world were the United States, Saudi Arabia and Russia; while Saudi Arabia and Russia have recovered from the pandemic’s blow, shale oil production in the United States has almost collapsed, and its continued paralysis is what has been pushing up oil prices even when the demand isn’t that strong.
More worryingly, despite the high price of 60-70 dollars/barrel, financing by large shale oil companies is still on suspension. This could mean no additional supply in the future, another sign of the repression on supply. The recession in oil production could account for half of the supply side’s impact on the global economy.
The pandemic has wiped out much of the production capacity of the shale oil industry, and a full recovery is not expected in the next two years. It will take a long time for the producers to repair their balance sheets, which has inhibited their risk appetite and willingness to invest.
Supply suppression is also seen in some other markets for basic goods. Out of various reasons, the effect could be sustained at least into the medium term.
Some of the supply such as that of oil and basic goods will be hard to recover in the short term; but as the pandemic comes under control, some production capacity will be revived, and the price will fall as factories in Southeast Asia, Europe and the United States come back to normal operation.
Considering the above factors, we believe that a greater part of the inflation pressure we have seen up is temporary and one-off. As the Fed repeatedly stressed, there is no need to take action because inflation will naturally come down in a few months. However, some of the inflation pressure will prevail in the medium term especially on the upstream of the supply chain and basic goods such as petroleum, raw materials and chips. We can see sustained strain on supply in basic material production and other important areas.
In one word, the pandemic has slashed a great deal of production capacity that cannot be restored in the short run. As a result, after the economy gets back on track, with other factors unchanged, the average inflation pressure will be higher than its pre-pandemic level.
Fact 3: Precautionary savings and passive savings
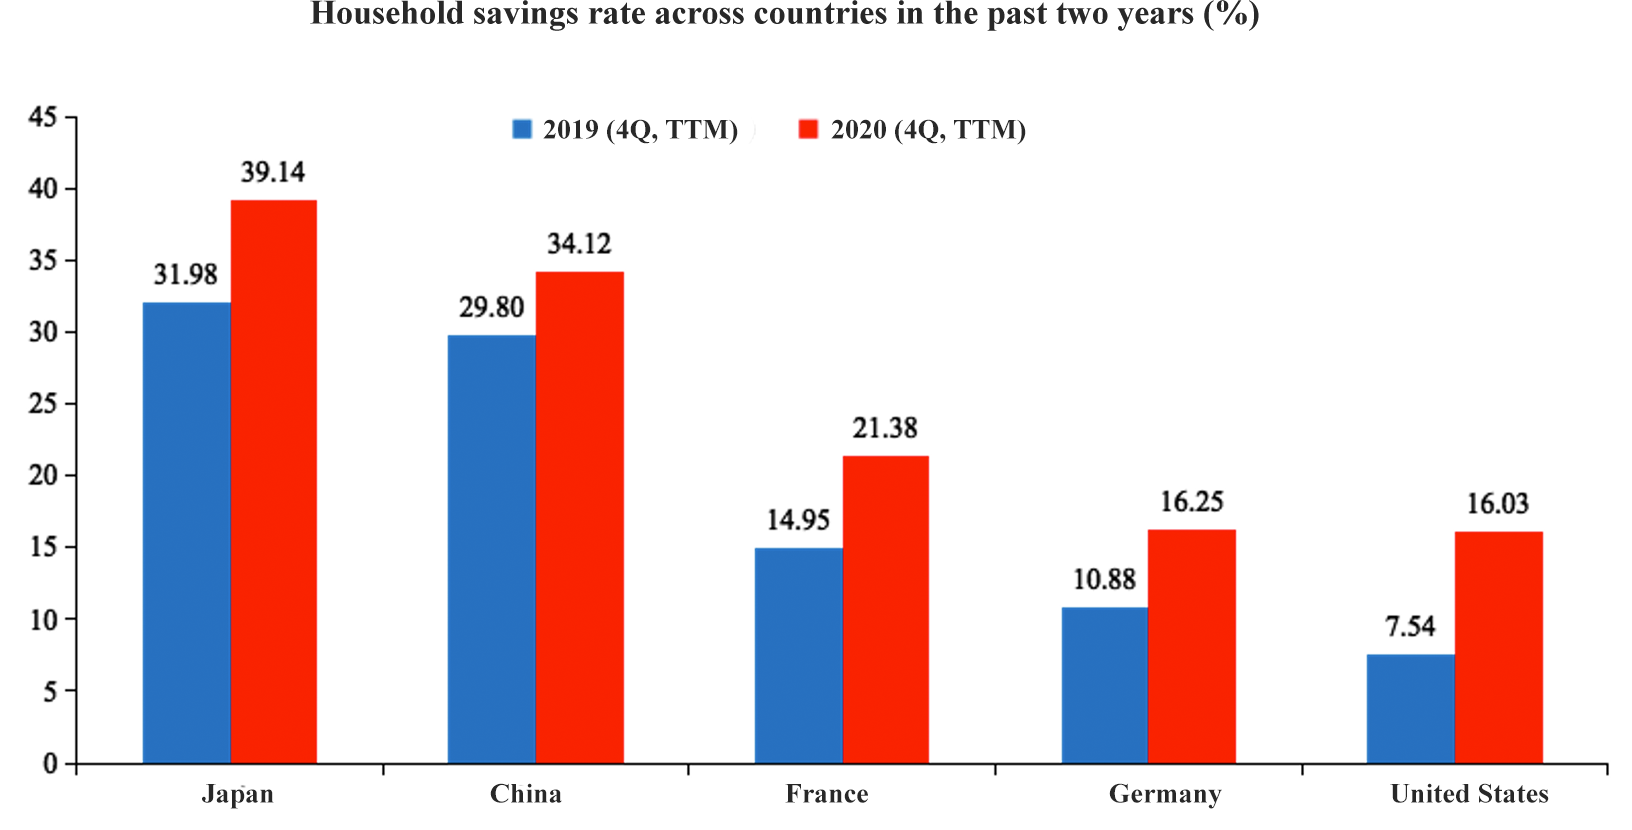
Next, let’s look at the changes in the household savings rate amid the pandemic. Covid-19 has significantly pushed up the savings rate as shown by annual figures, which is not surprising. Higher savings rate is the result of a drastic decrease in consumption including spending on goods, which is the key reason behind the sharp contraction of economic activities.
Based on annual figures across countries, the reduction in the consumption rate, or the rise in the propensity to save are similar in magnitude (see Figure 10), 7 percentage points in Japan, 4 percentage points in China and 9 percentage points in the United States. But actual situations are more complicated, and it is not fair to compare on an annual basis considering the different situations and duration of the outbreaks in various countries.
Figure 10: Household savings rate across countries in the past two years
Sources: Wind; Essence Securities
A closer look at the changes in quarterly savings rate reveals a strong pattern: countries more severely affected by the pandemic recorded higher increase in savings rate and suffered bigger economic shocks; among countries with similar level of outbreaks, Anglo-Saxon countries have seen exceptionally sharp rise in the propensity to save because they used to have extremely low savings rates; while in East Asian countries which have always maintained a high savings rate, the rise is not as significant. European countries fall somewhere in between.
China is the first country to bring the virus under control, and its statistics can offer an important clue to understanding situations and future trends in other countries.
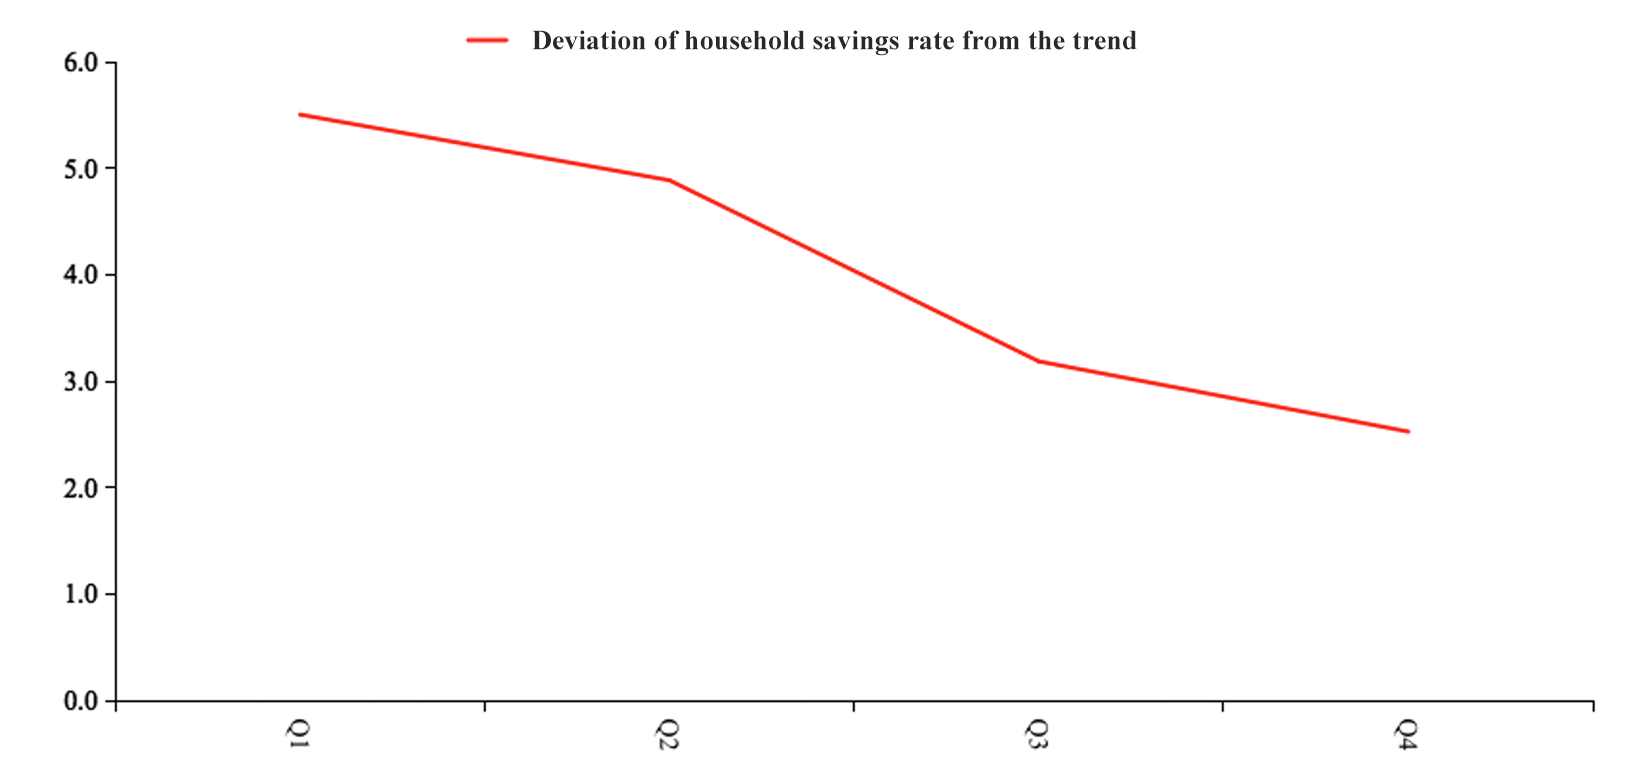
We have examined deviation of the quarterly household savings rate during the pandemic from its trend, i.e. the rise in savings rate as a result of the pandemic. In Q1, 2020, the savings rate in China rose by 5 to 6 percentage points and in Q4, 2020, by over 2 percentage points (see Figure 11).
Figure 11: Deviation of household savings rate in China in 2020
Sources: Wind; Essence Securities
Note: Savings rate = (national per-capita disposable income - per-capita spending) / national per-capita disposable income; deviation is the difference between actual quarterly savings rate and the underlying trend value.
This data contains two very important messages.
The first is, why has the savings rate risen during the pandemic? There are two explanations – first, passive savings which have been accumulated because lockdown measures paralyzed many consumption activities; second, precautionary savings as a result of increased risk-aversion among consumers out of greater concern for future uncertainties.
A large proportion of the additional savings in Q1 2020 in China were undoubtedly passive savings; however, after observing the underlying trend, we tend to believe that there were few passive savings in Q3-4 last year when the economy had basically gone back to normal. But despite the relatively low passive savings, total savings rate rose by over 2 percentage points.
In Q1 2020, the savings rate rose by 5 percentage points, a bit more than 3 percentage points were passive savings and the remaining 2 percentage points, precautionary savings. The proportion between the two were 3:2.
This proportion observed in China echoes some of the literature which holds that two-fifths in unusual growth of savings are precautionary savings while three-fifths are passive savings, which is why we give it a special mention here.
This has two important implications:
First, even after the pandemic is brought under control, there is still a strong inertia in the rise of precautionary savings. Compared with before the pandemic, people will be more motivated to save for precautionary purposes for an extended period of time, which will put more strains on economic recovery. Not considering the multiplier effect, two percentage-point more precautionary savings would shave off almost 1 percentage point from China’s GDP growth.
Second, increased risk aversion will affect both consumer spending and investments. Decrease in private sector investments will continue for a long time after the pandemic.
The economy is no doubt in recovery, but some of the momentum is unsustainable. Once the momentum is exhausted, we will come to realize that in many regards, willingness for households to spend and for businesses to invest will not go back to the pre-pandemic level, and that will significantly stem economic activities.
If China’s data, especially that for Q3-4 2020, offer some clues, we may observe similar patterns in the US, Europe and Japan. We will have to keep close watch on this.
One more thing about the data is noteworthy and a bit worrying. In Q1 2020, passive savings in China rose by at least 3 percentage points; the savings rate in the United States probably increased by 8 or 9 percentage points, a larger proportion of which were passive savings. People would naturally think that these passive savings will be released once economic activities are resumed, but in China’s case, as of Q1 2021, we have not seen that happen.
The deviation of the savings rate in China dropped to around 2% in Q4 2020. If this is mainly due to the additional precautionary savings, it would mean that the additional passive savings accumulated in Q1-2 last year had remained there without being spent at all. This is important to our understanding of the financial market and inflation.
First, driven by pandemic-induced risk aversion, people would adjust their balance sheets and especially their expenditures.
Generally speaking, they adjust to gain a sense of security. But would people feel safer when they save more? I tend to believe that greater wealth is an absolute reason for one to feel safer in uncertain times such as during the pandemic, when people are less willing to spend and more willing to save to achieve a higher wealth level where they feel safe.
In this case, the reason why additional passive savings were not released after the virus receded was that they translated into part of the wealth necessary for people to feel safer. If this explanation turns out to be correct, then the post-Covid sluggish spending of the passive savings accumulated during the pandemic will be a universal phenomenon.
If the passive savings will not translate into increased spending, then inflation in the United States or Europe may not be so severe as we expect.
China’s experience indicates that most of the additional passive savings will still be there if people prefer to hold greater wealth in case of future uncertainties.
Second, taking into account various factors such as changes in the household savings rate, supply-side shocks, and the substitution of service consumption by goods consumption, we expect the actual growth of the Chinese economy in 2H21 to be remarkably weaker than before the pandemic. In 2022, it could just be somewhere around 5%. Sustained precautionary savings, substantial slowdown in global goods consumption and exports, recovery of supply chains outside of China — all these mean that the level of economic activity may be lower in general than before the pandemic.
Download PDF at: