
Abstract: In this article, the authors shared six judgements of China’s macroeconomic performance. First, the output gap has been basically closed, but the recovery needs to be further consolidated; second, structural improvement has yet to fully resume; third, the slow recovery of the service sector has been encumbering improvement in the labor market; fourth, rising commodity prices can increase stagflation risk; fifth, the sustainability of high export growth is uncertain; and sixth, cross-border capital flows could cause turbulence to the domestic financial market.
Due to COVID-19, China registered a low growth in Q1 2020. According to the newly released data, China only realized a quarter-on-quarter growth of 0.6% in Q1 2021, indicating there is much uncertainty with future recovery. Of particular note, six aspects require special attention.
Judgement 1: Output gap has been basically closed, but the recovery needs to be further consolidated.
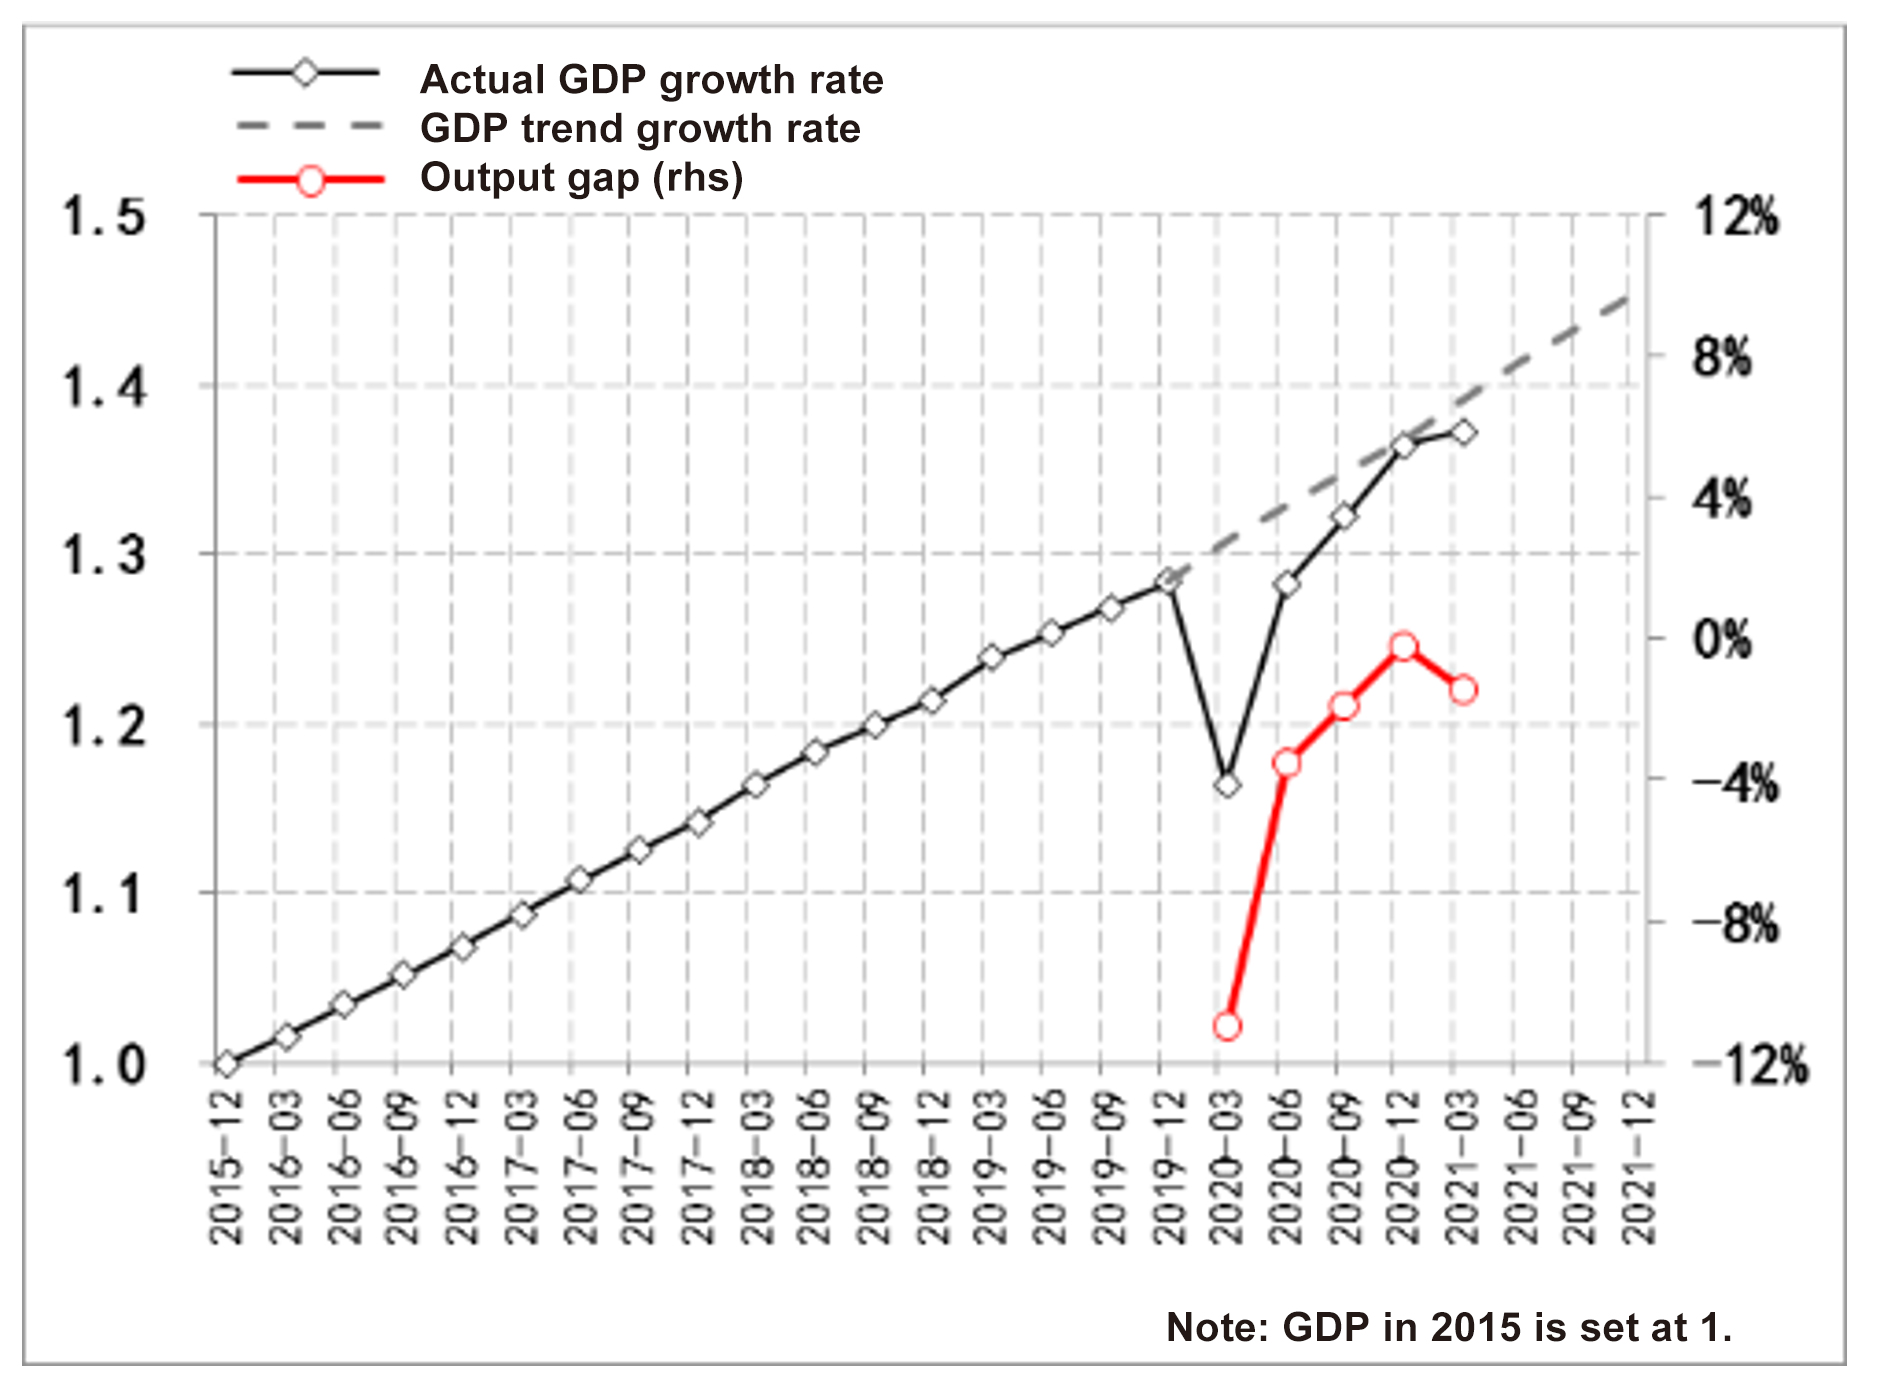
The Chinese economy deviated from its growth trend during 2016 - 2019 with an output gap of over 10% in Q1, 2020. After three quarters of recovery, the year-on-year growth picked up to 6.5% in Q4 2020, indicating that the output gap caused by the pandemic had been basically closed.
However, if we take the average GDP growth of the first quarter of each year from 2016 to 2019 as a benchmark, the year-on-year growth of Q1, 2021 should have been over 20%, higher than the actual 18.3%, and the actual quarter-on-quarter growth of 0.6% is also much lower than the average figure for Q1, 2016-19 of 1.85%. The numbers indicate that economic recovery has to be further consolidated.
Figure 1: Economic Recovery in China
Source: Wind
Judgement 2: The structural improvement process has yet to fully resume
Unlike the aggregate output gap which has been largely closed, structural gap and contradictions have loomed even larger:
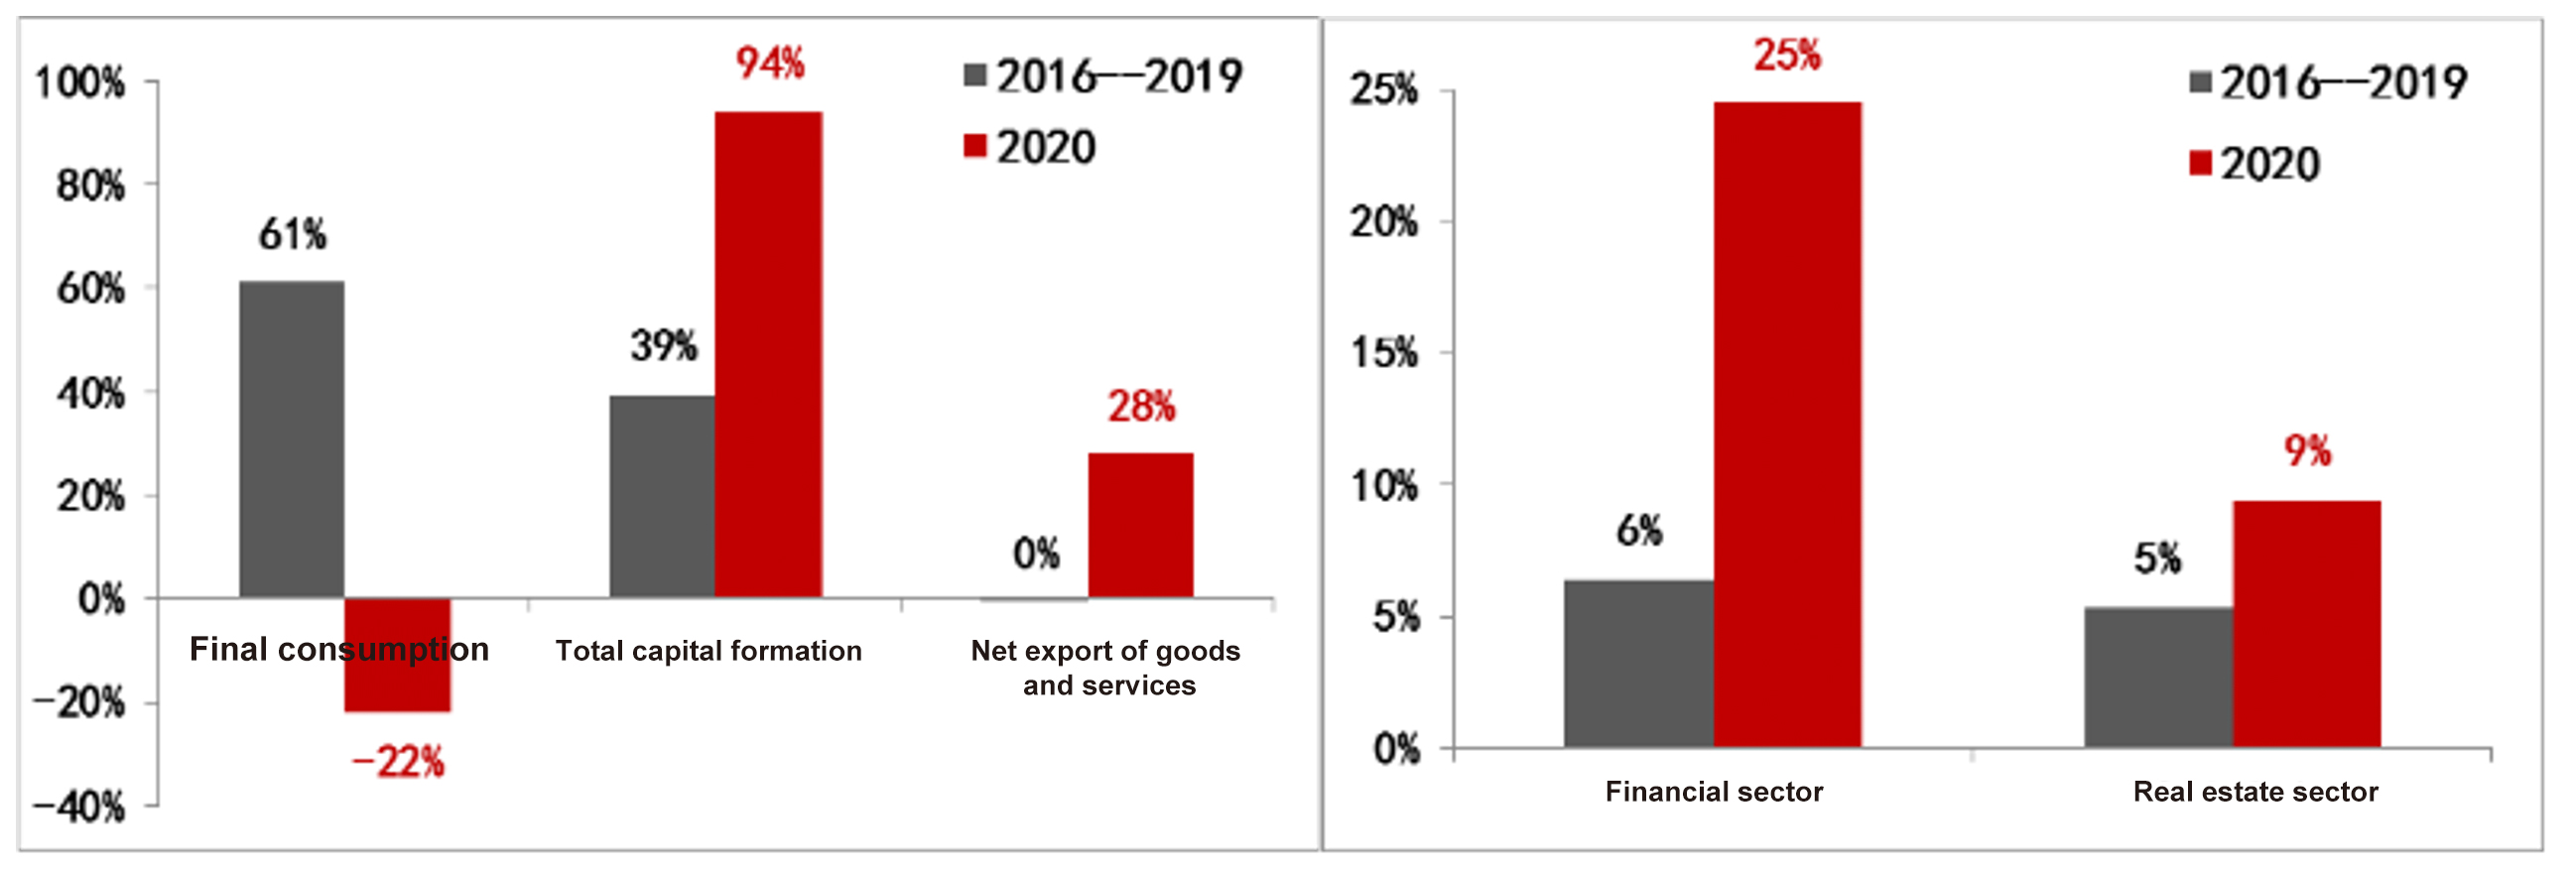
On the demand side, the contribution of final consumption to economic growth slumped to -22% last year, much lower than the pre-pandemic average of 61%, while the contribution of net export of goods and services reached 28% and that of investment surged to a whopping 94%.
On the supply side, the contribution of the financial sector to economic growth in 2020 was nearly 25%, and that of the real estate sector, almost 10%. In other words, over one third of the growth came from these two sectors.
Figure 2: Contribution of consumption, investment and export to economic growth; share of the financial and real estate sectors in total growth
Source: Wind
Before the pandemic, enabling final consumption to play a main role in driving growth was the key to structural improvement on the demand side. During 2016 - 2019, the contribution of final consumption to growth rose from 50% to over 60%. On the supply side, priorities in structural improvement included addressing overcapacity and overstocking, deleveraging, reducing costs, and strengthening weak links. During 2016 - 2019, the average contribution of the financial sector was less than 7%, while that of the real estate sector, less than 6%.
It’s clear that under the pandemic’s blow, structural adjustments in China have been disturbed, if not interrupted.
Judgement 3: Recovery of the service sector has been slow, encumbering improvement in the labor market
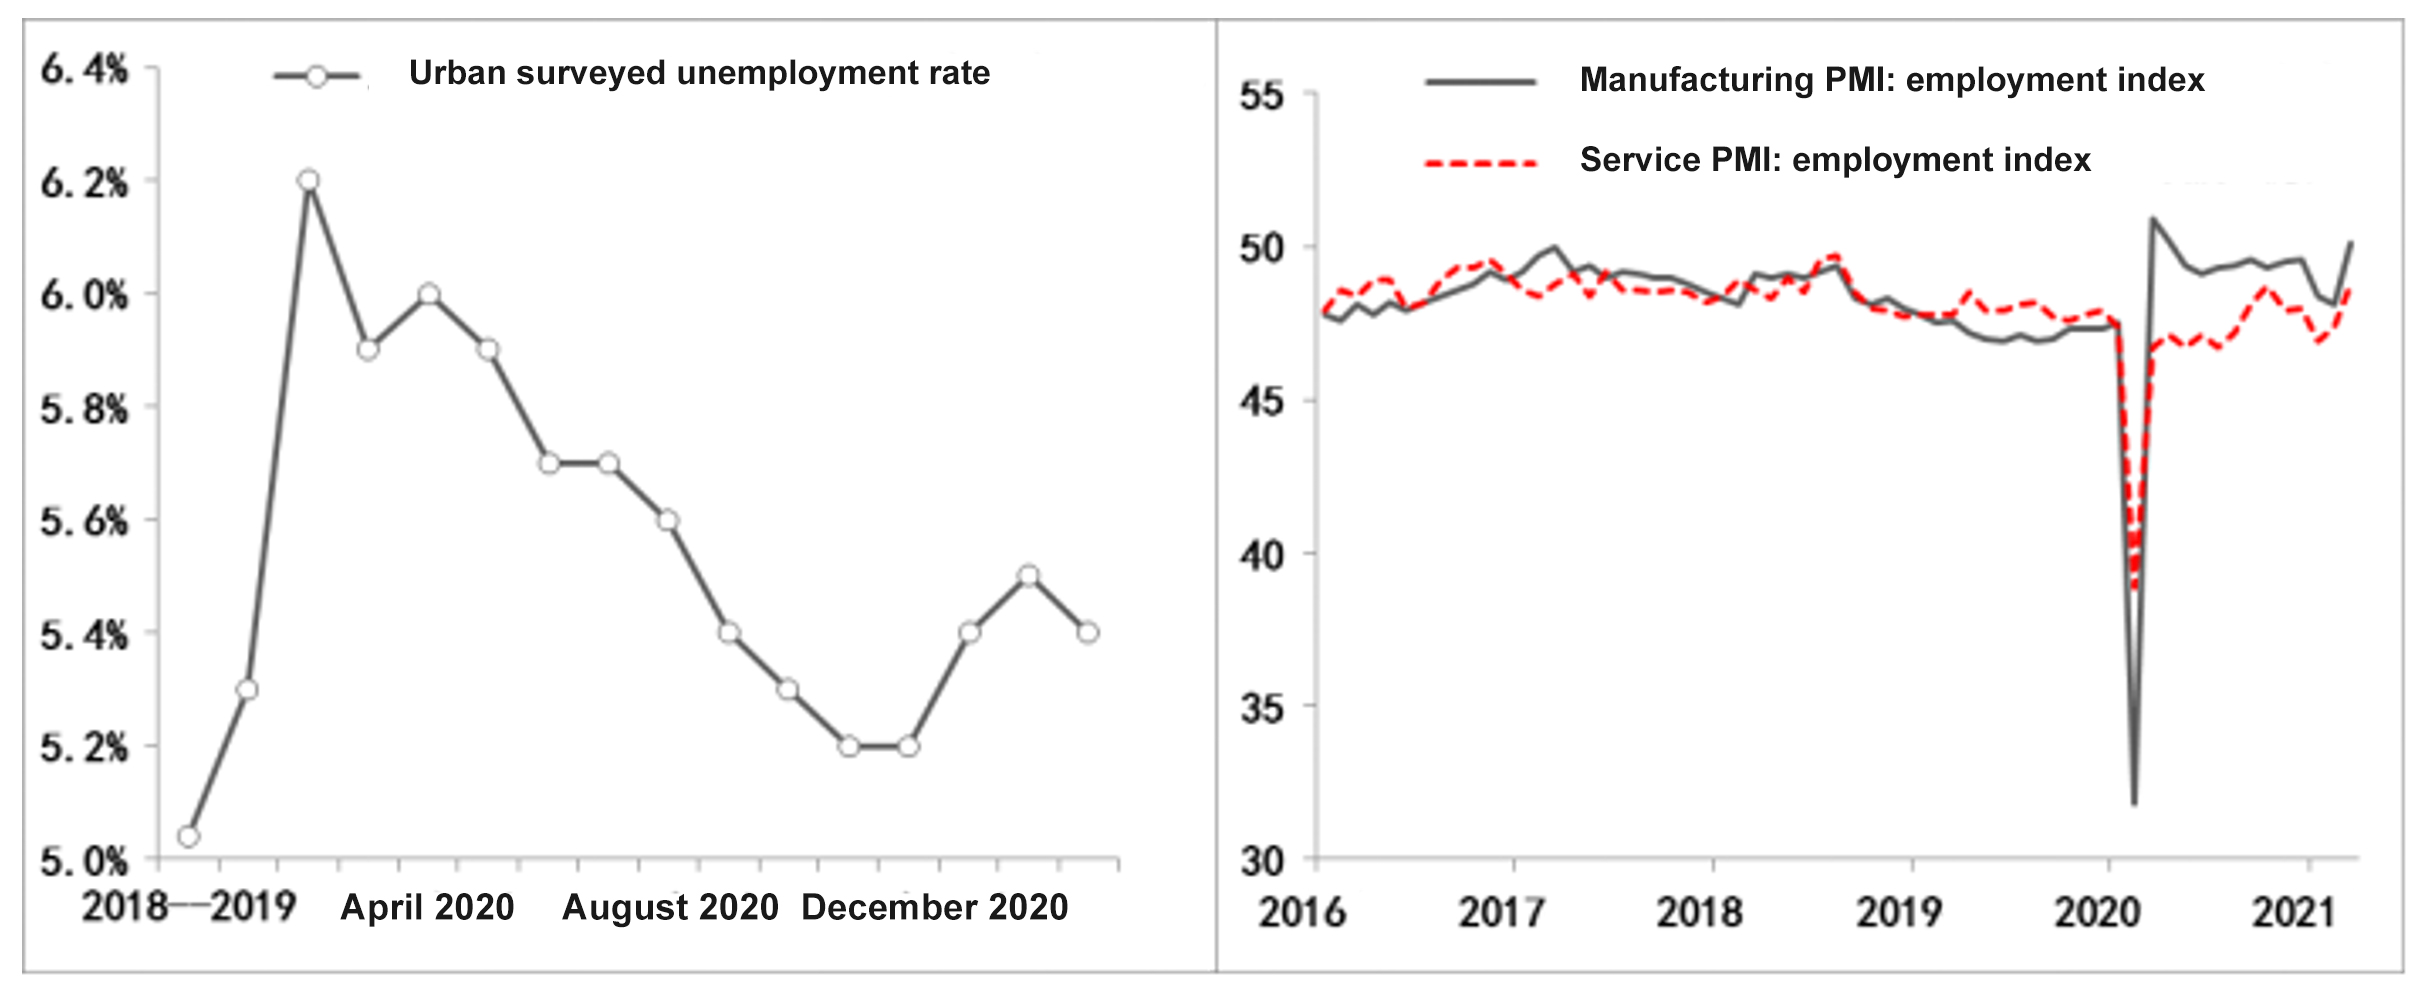
Urban unemployment rate stands at 5.3% now, according to survey. Although much lower than 6.2% at the height of the pandemic, it is still higher than the pre-COVID average of 5%. The overall picture would be more worrying if reduced labor participation and actual employment in non-urban areas are taken into account.
The main reason why unemployment pressure remains unaddressed is the slow recovery of the service sector. Since March 2020, the employment index under the PMI of the service sector has been lower that that under the PMI of the manufacturing sector; but for the best part of the pre-pandemic period, the former had been higher than the latter.
Figure 3: Recovery of employment
Source: Wind
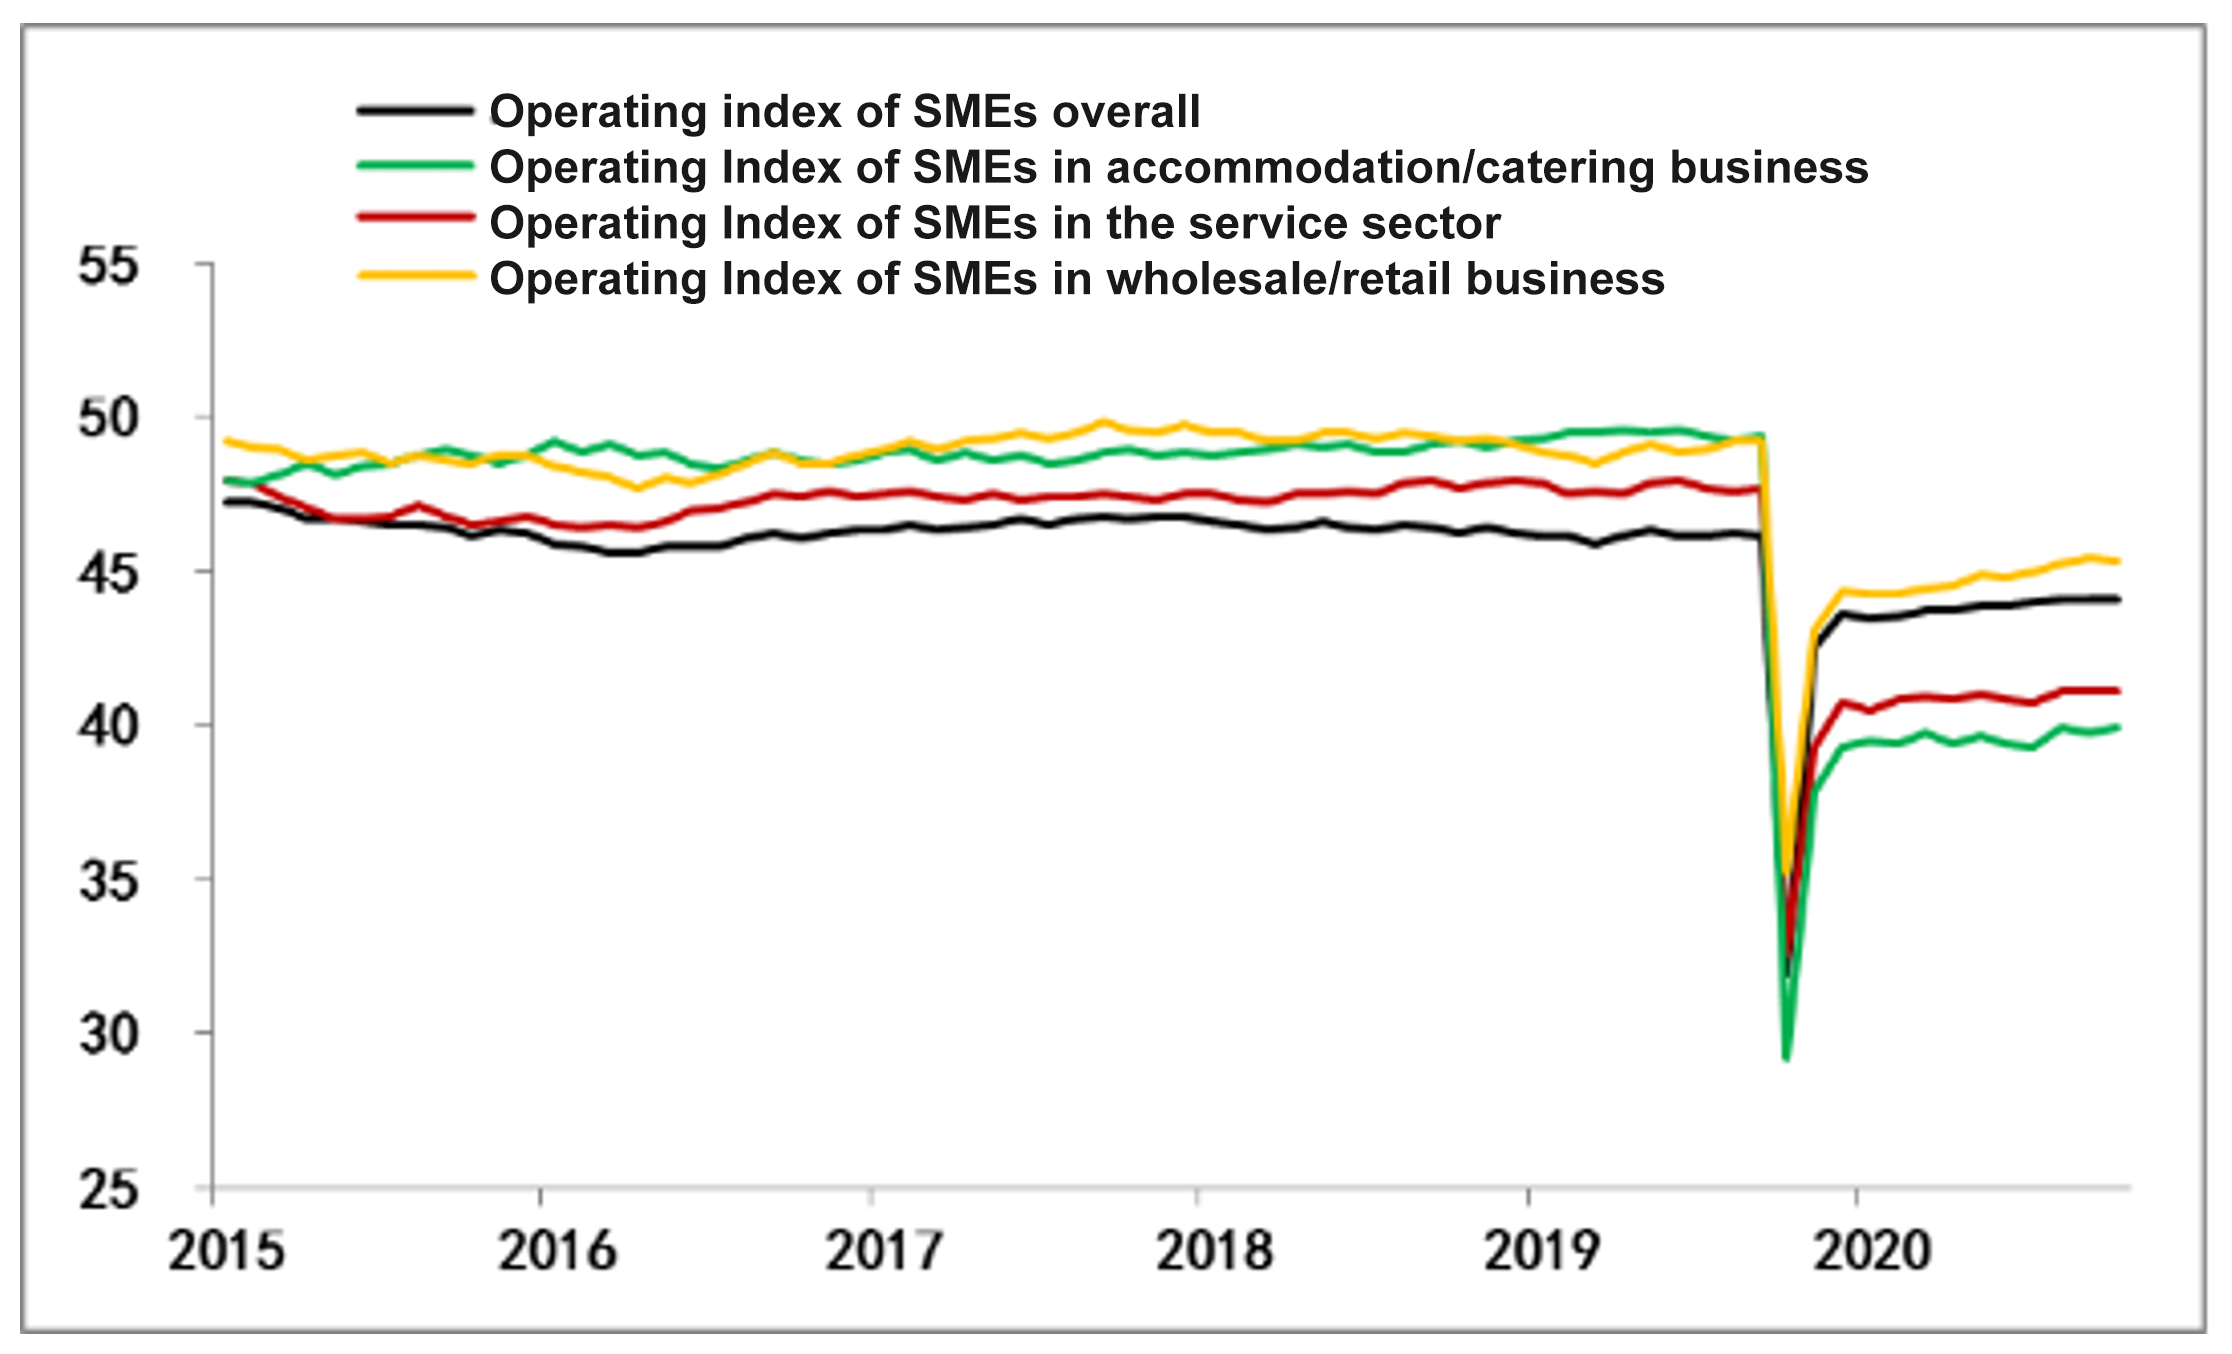
The most obvious reflection of the slow recovery of the service sector is the difficult situation that small and micro enterprises (SMEs) and individual businesses find themselves in. The operating index of SMEs has gone back to 44 after it plunged to 32 last February, but it is still lower than the pre-pandemic average of 46; to be specific, SMEs in the service sector only picked up to 41, much lower than the pre-pandemic average of 47. Of particular note, different from before, the operating index of SMEs in the service sector has been continuously lower than that of all SMEs since COVID-19 hit, not to mention that some of the SMEs and individual businesses like small hotels, pubs and stores have closed for good under the pandemic’s blow.
Figure 4: Performance of SMEs
Source: Wind
Judgment 4: Rising commodity prices can increase stagflation risks
Since last August, commodity prices have seen continuous growth, showing signs of an overheated physical asset market. The prices of many commodities have rebounded to pre-epidemic levels, some have even exceeded historical peaks.
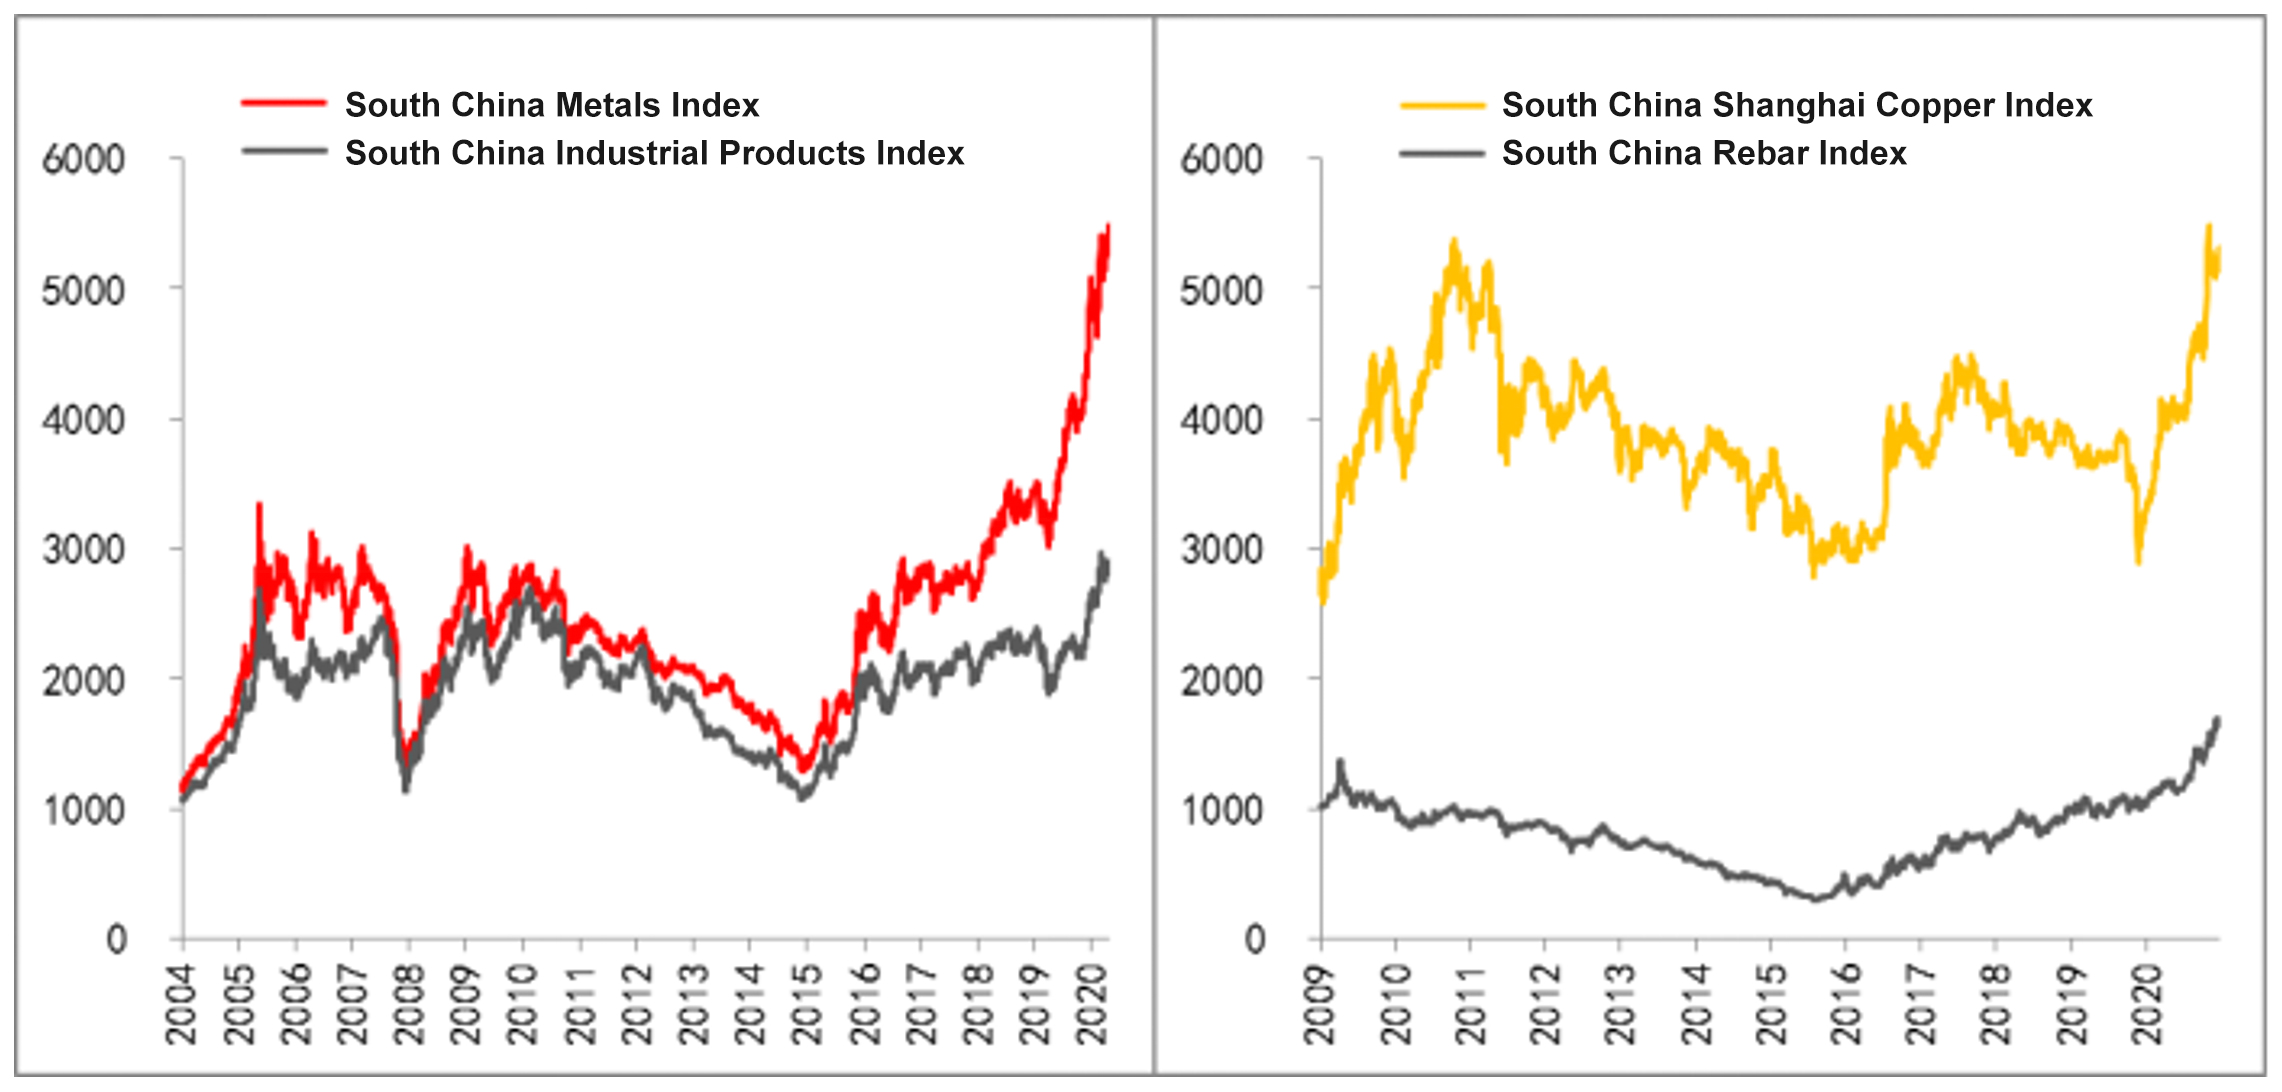
For example, the Nanhua Shanghai Copper Index has risen above 5240, exceeding the historical peak level at the end of 2011, and the South China Rebar Index has risen above 1680, exceeding the historical peak level in 2009. So far, the South China Metals Index and Industrial Products Index have increased by 26% and 27% respectively from early August last year.
The slow recovery of employment and the service sector has badly affected final consumption, and surging prices of upstream products would squeeze profits on mid- and downstream products, which in turn will increase the risk of stagflation.
Figure 5: South China Commodity Indexes
Source: Wind
Judgment 5: The sustainability of high export growth is uncertain
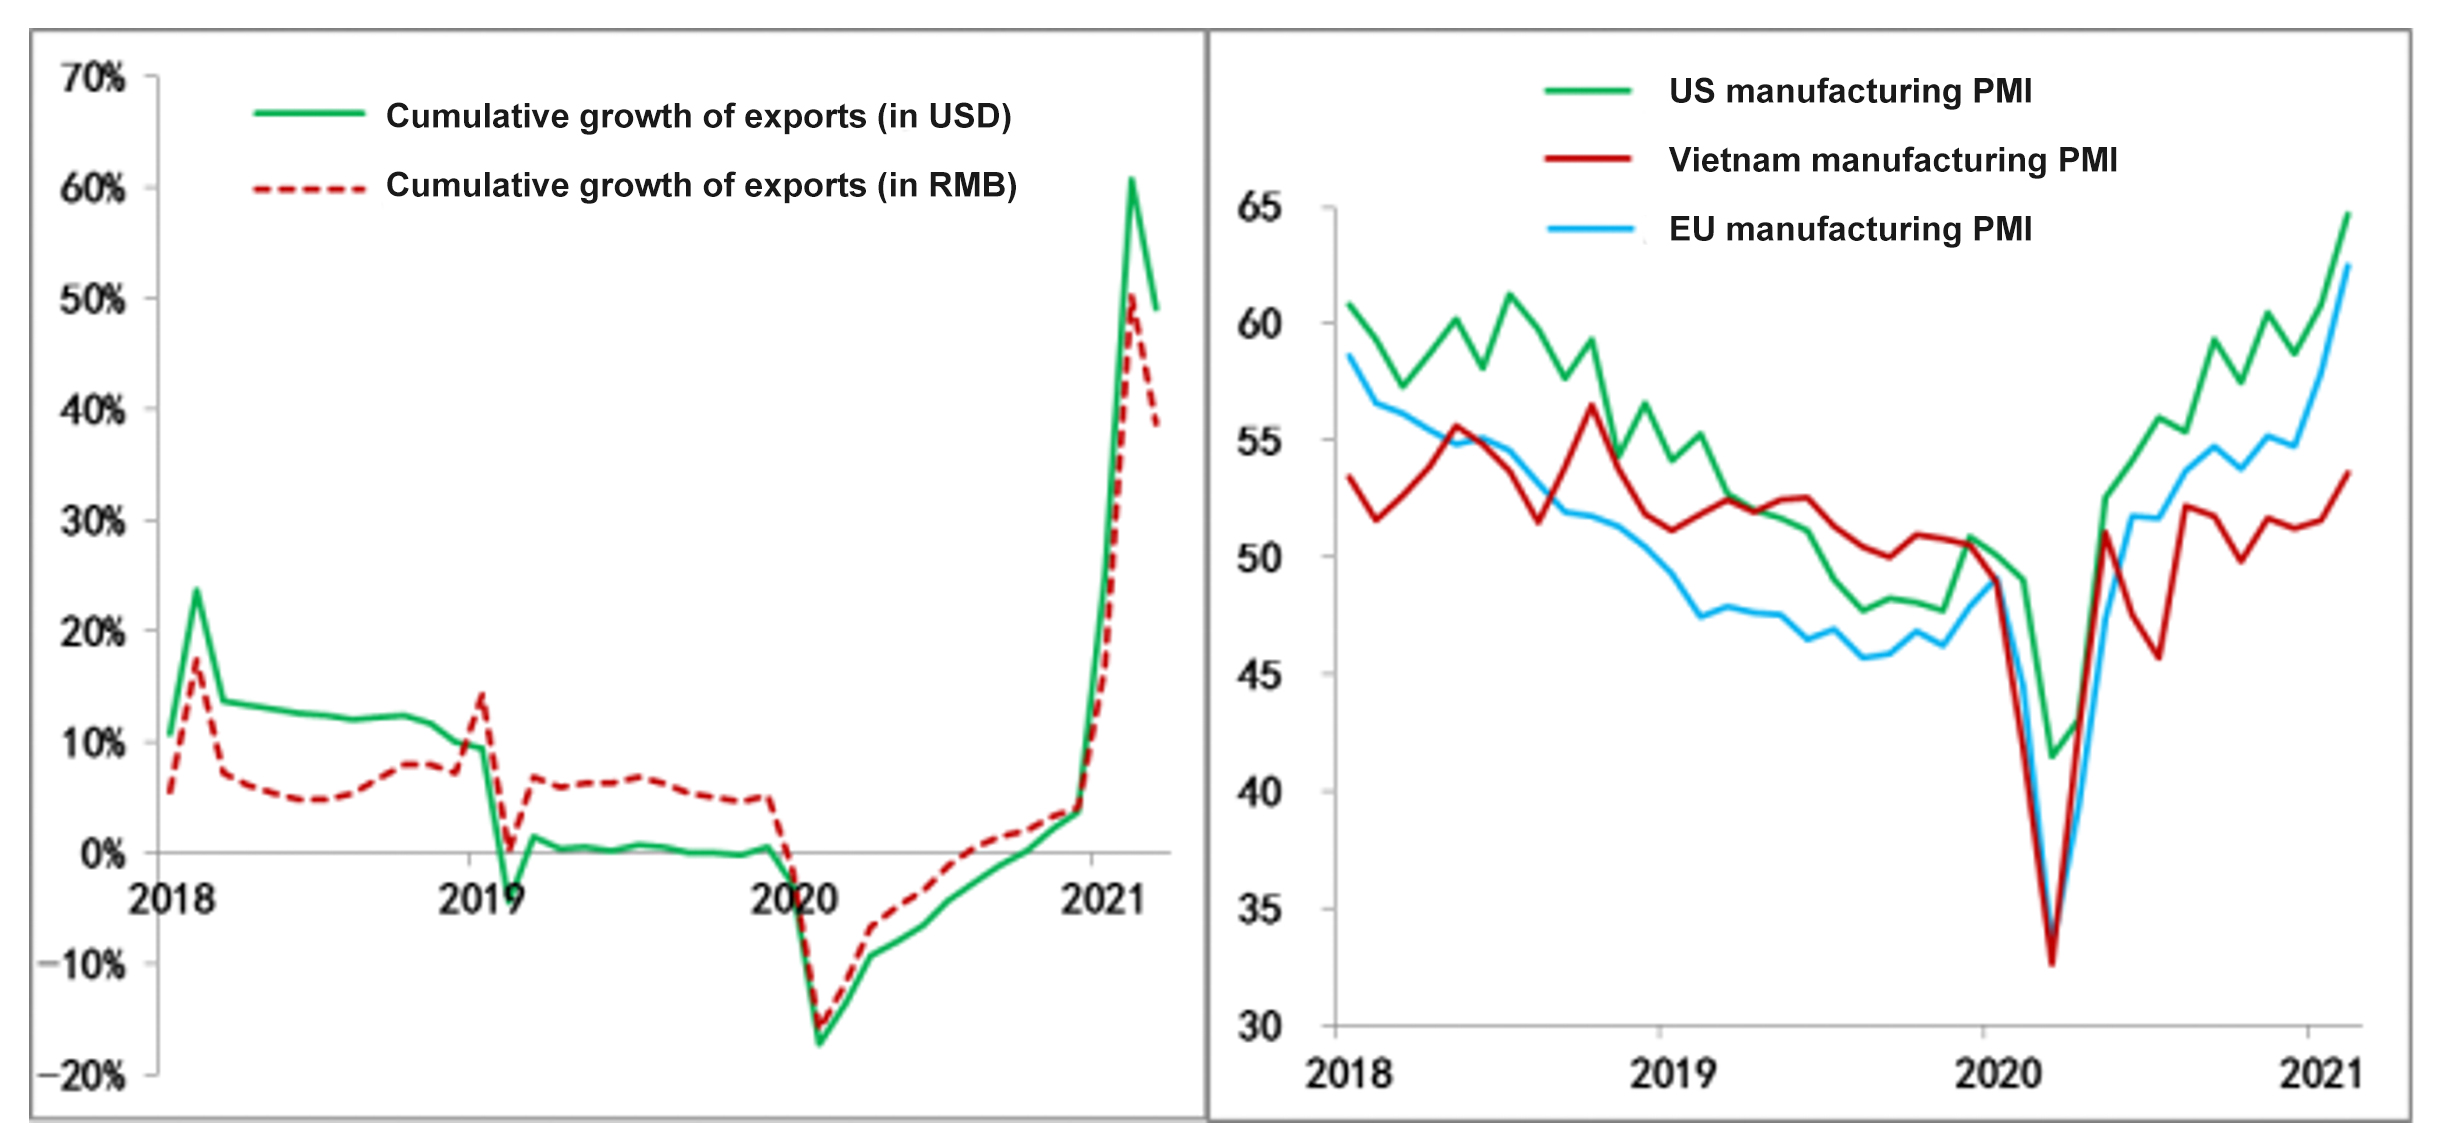
Due to rising demand for epidemic prevention products, the booming "stay-at-home economy", and the recovery of overseas production and orders, China’s exports have sustained a high growth since June last year. However, as the global vaccination rate continues to rise and the weather gets warmer which can help prevent virus spreading, China may see a decline in anti-epidemic product exports. Moreover, the recovery of overseas production capacity will also weaken China’s export.
Coupled with the advancement of US strategy to cut China out of the global value chain, the Biden administration may start by reducing imports from China during the implementation of its infrastructure spending plan.
Therefore, there is great uncertainty whether high export growth could be sustained.
Figure 6: China’s export growth and overseas manufacturing PMI
Source: Wind
Judgment 6: The impact of cross-border capital flows on domestic financial markets
Since 2018, China has accelerated the opening-up of its financial sector, and RMB assets have grown increasingly attractive to international investors. As of the end of last year, domestic RMB stocks and bonds held by foreign investors totaled nearly 6.8 trillion yuan, an increase of 184% from the end of 2017.
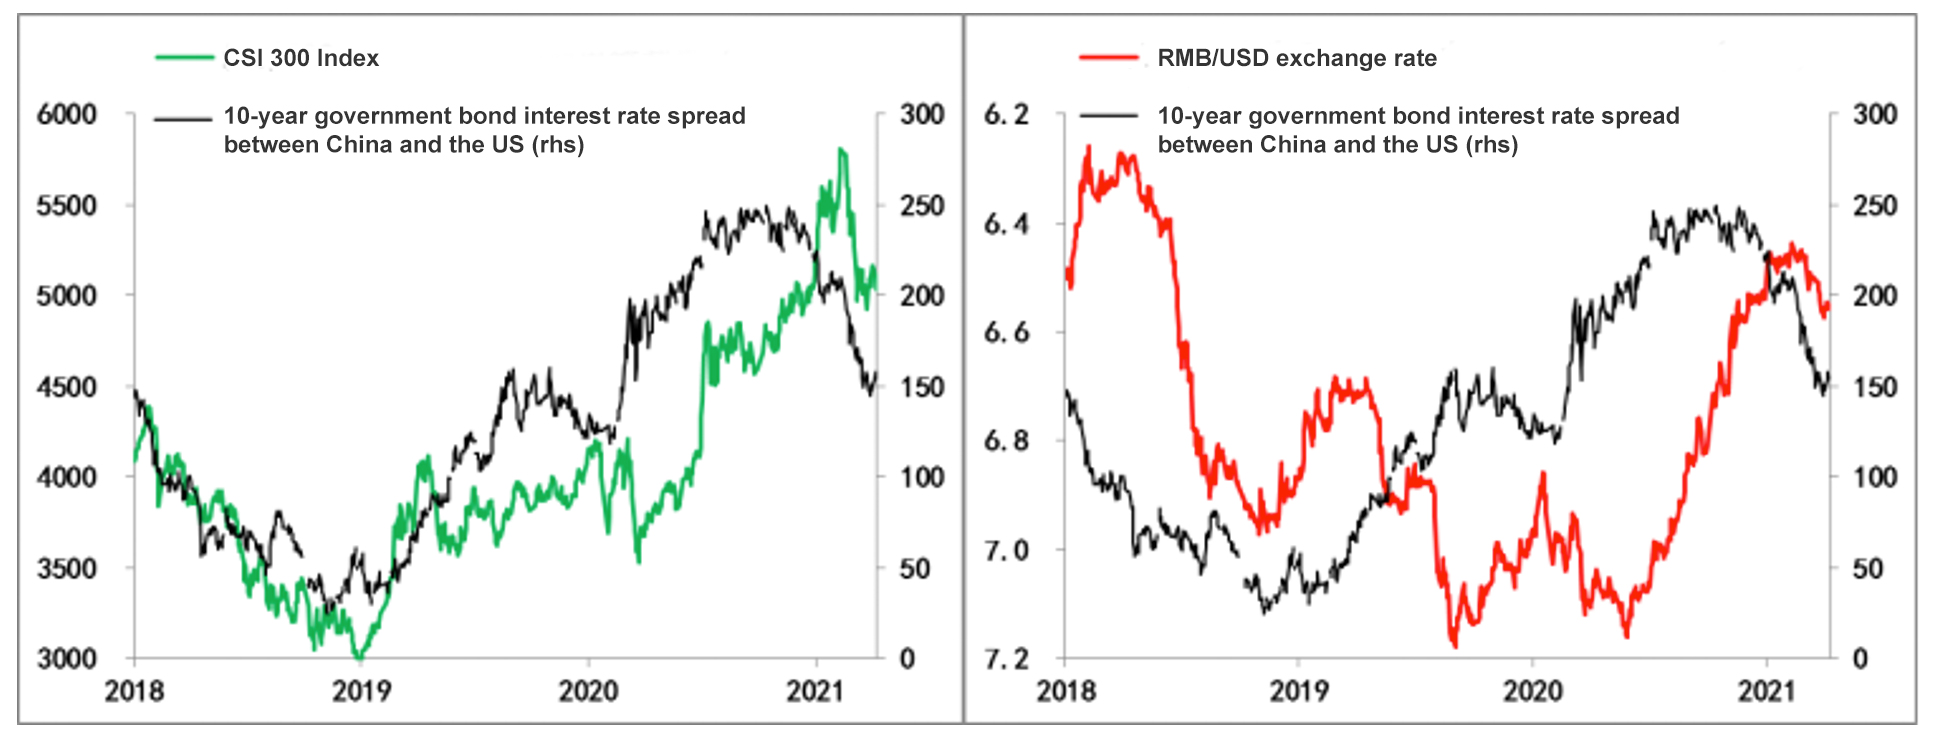
In addition, unlike most major developed economies that have applied quantitative easing policy with zero or negative interest rates, China’s monetary policy has remained in the normal range. The interest rate spreads have provided important support for the RMB exchange rate and RMB assets.
However, since the beginning of this year, yields on medium- and long-term US Treasury bonds have continued to rise. The yield rate on 10-year US Treasury bonds has exceeded 1.75% and is expected to exceed 2% this year. Following the US, interest rates on medium and long-term government bonds in other developed countries have also risen to varying degrees. Some emerging markets have also implemented interest rate hikes. These changes will narrow the spreads between domestic and foreign interest rates, which may trigger cross-border capital flows.
Figure 7: Interest rate spread between China and the US, and trends of A-shares and RMB exchange rate
Download PDF at: