
Abstract: This article discusses China’s economic outlook by 2035 against the backdrop of the country soon becoming a high-income economy. By comparing China against economies that have crossed or approached the high-income threshold in the past 30 to 50 years, it makes the following findings. First, economic growth of East Asian economies shows a great similarity which makes it possible to predict the size of the Chinese economy by 2035. Second, while culture is an important factor affecting economic performance in the long term, economic growth of a country tends to decelerate after its per capita income reaches or approaches the threshold of a high-income economy regardless of the cultural background. Third, slowdown of the economy as well as Renminbi appreciation should be considered when projecting China’s growth in the long term. These two factors combined will likely push up China’s per capita GDP to $30,000 in 2035 which, however, would still be much lower than that of the US.
I. The third decade of the 21st century could be a period of great transition
An important reason why I choose to look ahead to the year 2035 is that China is now at the beginning of the third decade of the 21st century, which could be a period of great transition for China's reform and opening-up as well as economic and social development. The significance of this decade is mainly reflected in the following three aspects:
First, China is very likely to enter the ranks of high-income countries in 2021, which is one of the important transitions that China is about to experience.
In 2020, China's per capita GDP was more than $11,000 in current US dollars, still some way off the $12,500 threshold of high-income economies in 2020. Due to the overall downturn in the world economy in 2020, the $12,500 threshold is expected to be lowered in 2021. Meanwhile, China is likely to have a real growth of around 8.5%, and a nominal growth exceeding 10% in 2021.
If the appreciation of Renminbi exchange rate is taken into account, China is highly likely to cross the threshold of high-income countries in 2021. Even by conservative forecast, China will become a high-income country by 2022.
Second, the Fifth Plenary Session of the 19th CPC Central Committee has put forward proposals on the 14th Five-Year Plan and long-term goals for 2035. The Plan itself is currently being drafted and will become official and binding once approved at China’s two sessions in 2021.
The assessment on China's economic outlook in 2035 against such a backdrop can help enrich the understanding and discussion of the Chinese economy during the policy-making process.
Third, as China eventually crosses the high-income threshold, it is necessary to review the progress that China has achieved by comparing with economies that have crossed or approached this threshold over the past 30 or 50 years around the globe. The result from such an international comparison will be of great significance.
II. China's economic development stage vs. that of Japan, South Korea and Chinese Taiwan
At the end of 2019, we compared the economic performance of China with that of Japan, South Korea and Chinese Taiwan in the context of the transformation of East Asian economies, based on indicators such as economic structural change, PPP-based per capita GDP and income, as well as social development data such as the Lewis turning point.
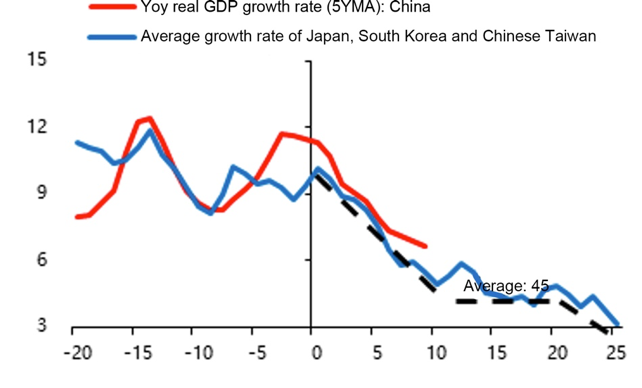
The conclusion was that the level of China's economic and social development in 2010 was about the same as that of Japan in 1968, South Korea in 1991 and Chinese Taiwan in 1987. Based on the result, by setting 2010 as the benchmark year for China, 1991 for South Korea, and 1968 for Japan, then extending 25 years forward and 20 years backward on the time axis, we can show the economic growth rate of each country in the corresponding time period on the axis.
With this method, we calculated the average economic growth rate of Japan, South Korea and Chinese Taiwan, and compared them with China's real GDP growth rate (see Figure 1). It could be found that the economic growth rates of East Asian economies were very close to each other, no matter whether it was during high growth period before economic transformation or amid economic deceleration in the ten years or so following economic transformation.
Figure 1: Real GDP growth rate during transformation (%)
Sources: Wind, Essence Securities
Given the similarity in the pattern of economic growth rates, we could roughly predict the trend of China's economic scale by 2035. Of course, we can further come up with forecasts under conservative, neutral and optimistic scenarios.
No matter which scenario it would be, one important assessment is that the deceleration of economic growth in China has not yet been over from a long-term perspective. Based on the experience of East Asian economies, China's growth is likely to stabilize at 4%-5% between 2025 and 2030, or a little longer, before decelerating again. Based more broadly on global experience, China's growth rate is expected to eventually converge to around 3% after 2035.
In terms of specific economic numbers, under a neutral scenario, China's economic aggregate would reach about $33 trillion in 2030, surpassing the US over the same period. At that time, China's per capita GDP may be close to $24,000 in market price terms, and probably $30,000 by 2035.
III. The standard of high-income country and the performance of economies when crossing the threshold
Based on the above analysis, there are two issues worth discussing as China is about to become a high-income country: first, "what is a high-income country", that is, what are the criteria for becoming a high-income country; second, how to assess the performance of countries that have crossed or come close to these criteria over the past 30 and 50 years.
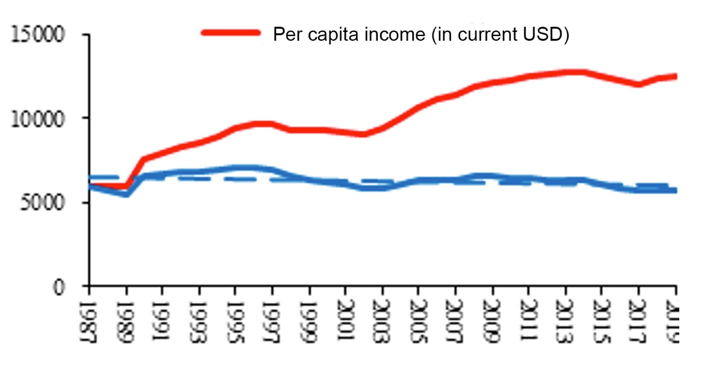
For the first question, the standard for a high-income country is based on per capita income developed and released by the World Bank after 1987. If the per capita national income exceeds the threshold, it is considered a high-income country; if not, it is a middle- to high-income or low-income economy. As shown in Figure 2, the top curve represents the level of per capita national income of high-income economies.
Although the technical details about the formulation of this standard are not clear, we can use a curve (see Figure 2) to depict how the standard, converted to 1987 US dollars, has changed over the years. The value, after adjusting for US inflation, has been relatively constant since 1987, at about $6,000. The World Bank is likely to lower this standard in 2021, given the massive global economic contraction in 2020. Once it is lowered, China's per capita income is likely to cross that threshold, given China's economic growth and currency appreciation.
Figure 2: Threshold of High-income country based on per capita national income
Sources: Wind, Essence Securities
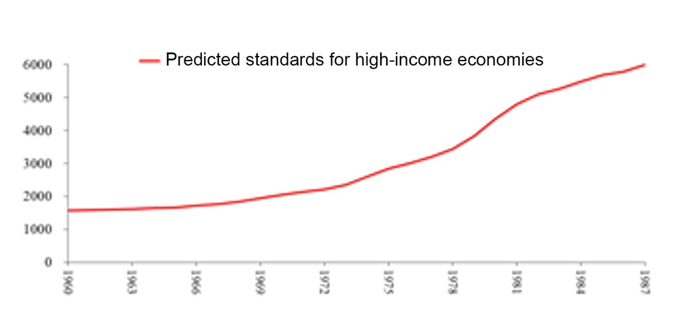
In addition, although the World Bank did not publish the standard of high-income economies until 1987, using the techniques described above and also based on CPI, we can extrapolate the standard back to 1960, i.e., the $6,000 in 1987 corresponds to about $1,600 in 1960 (see Figure 3).
Figure 3: Predicted standards for high-income economies
Sources: Wind, Essence Securities
After having clarified the standards for high-income economies, we can turn to the second issue, that is, the performances of economies when they crossed or approached the threshold in the past decades.
We excluded small economies such as Singapore and Costa Rica and selected those with a population of more than 10 million and within the upper middle income range in 1987. There are 16 economies that meet this standard, including Russia, Brazil, Portugal, and South Korea. Eight of them crossed the high-income threshold after more than 30 years of development, for example, Portugal (1994), Chile (2012), Romania (2019), Hungary (2007); the other eight economies are still in the upper middle income range. Some of them, such as Russia, Argentina, and Venezuela once crossed the high-income threshold, but later fell back to the upper middle income range due to economic recessions, while countries such as Brazil, Iraq, Iran, Mexico and South Africa have remained in the upper middle income range for the past 30 years and never entered the high-income rank (see Table 1).
While the standards for high-income economies have generally remained unchanged after adjusting for inflation (around the 1987 level of $6,000), on the surface, as long as a country can maintain economic growth, even if at a slow rate, it can always meet this standard at some point. However, some upper middle income countries have consistently failed to reach this threshold. This phenomenon is worth thinking.
Table 1: Successful and failed attempts to become high-income economies
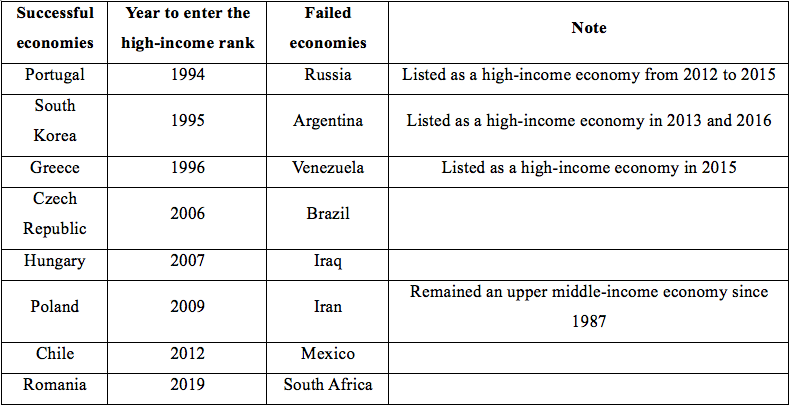
Among the more than 200 economies in the world, there are over 80 high-income economies, accounting for 40% of the total number of the world’s economies, including some relatively small ones. However, some large economies, such as Brazil and Russia, once were listed as high-income economies but then fell back into the upper middle income range. This is a phenomenon worth noting.
If we extend the period of study from 1986 to 1970, we can find that Italy was also a country that developed into a high-income economy by World Bank standard after a relatively long time after the war. In fact, many European countries did not become high-income economies right after World War II. For example, Spain didn’t reach this threshold until the early 1970s. Some other European countries were middle-income economies in the 1960s, 1970s, and even 1980s, and gradually developed into high-income ones.
IV. Religious and cultural influence on crossing the high-income threshold
There is no doubt that the economies across the world that have reached or are close to reach the high-income threshold have very different economic systems and cultural backgrounds. We tried to adopt the perspective of religion and culture to explore whether there is a correlation between religious and cultural factors and the countries’ ability to join the high-income ranks.
The reason for the perspective is that the economic performances of various economies seem to show that there is a connection between the level of economic development and religious and cultural factors. But economies are affected by different religions and cultures, as well as other factors.
In order to eliminate the influence of these factors, we selected a group of economies with the most successful economic development from the same religious and cultural background. In this way, many structural factors affecting economic growth were eliminated in the process of sample selection, while religious and cultural influence and per capita income factors were retained. On this basis, we carried out a comparative analysis of the economies of Confucian culture, Islamic culture and Christian culture.
The first is the economies of the Confucian culture, including China, Japan, South Korea, and Chinese Taiwan. For these four economies, a fundamental question we want to answer is: based on the benchmarking method mentioned above, are there any systemic differences in the economic growth of these four economies before and after reaching the high-income threshold?
Here are some key facts drawn from the statistical measurement results:
First, economies of the Confucian culture, including Chinese mainland, have a significantly higher economic growth rate than economies of other religious and cultural backgrounds within the time period we just defined.
Second, around the time when the Confucian economies are reaching the high-income threshold, the growth rate of these economies has declined without exception, and this decline is a long-term trend.
Third, the difference in economic growth between various economies of the Confucian culture is not significant in terms of intercept and slope. This means that for any East Asian economy, with a given per capita income level or a given relative degree of development, it is possible to accurately calculate its potential economic growth rate in the long run. In other words, there is no statistically significant difference in economic growth rates and the slowdown trend between Japan, Chinese Taiwan, South Korea, and China at the same development stage, in other words, the Confucian economies feature a strong consistency of economic growth.
The second is Islamic economies. Since the Islamic countries in the Middle East benefit greatly from their oil resource, which can significantly affect their economic development, we chose Malaysia, Turkey and Kazakhstan as study samples. These countries are less affected by oil, and have reached or approached the high-income threshold. The conclusion is that these countries have also experienced a significant economic slowdown before and after reaching the high-income standard. At the same time, their intercept value is significantly lower than that of Confucian economies, which means that their economic growth during the same period is lower than that of Confucian economies.
The third is the Christian economies. Since 1970, 10 large Christian economies have reached the high-income threshold. With the same study methods, we find that compared with Confucian economies, the differences within Christian economies are relatively large, but economic slowdown trend is very obvious without exception. The results are statistically significant under many (but not all) regression settings.
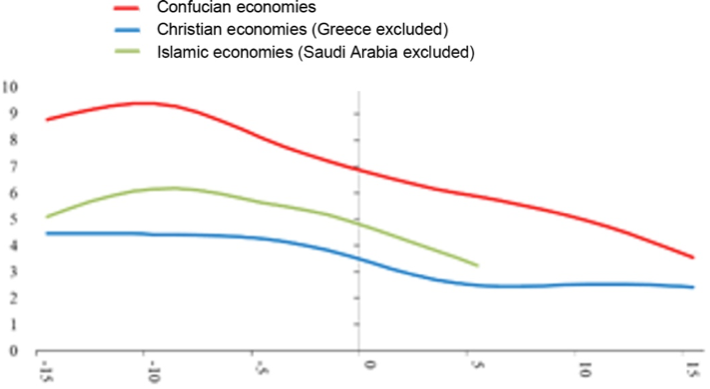
To show the statistical results of economic growth comparisons from different religious and cultural backgrounds, we use HP filter to display them more intuitively. As shown in Figure 4, around reaching the high-income standard, the long-term economic growth trend of Confucian economies has declined significantly. This downward trend is not "L-shaped", but a gradual one until it converges to the long-term economic growth of developed countries.
Islamic economies feature a similar growth trend to those of Confucian economies, but the intercept value is significantly lower and the slope value is slightly smaller. Even for the Christian economies, after one reaches a relatively high level of income, it shows an obvious deceleration trend. The commonality is that these economies are all in a long-term deceleration trend, gradually converging to a long-term growth rate of about 3%.
Figure 4: Potential real GDP growth of economies from different religious and cultural backgrounds (HP filter)
Sources: Wind, Essence Securities
Note: Saudi Arabia is excluded due to its sharp fluctuations of economic growth rate and limited data. Greece is excluded due to the great impact of European debt crisis.
V. Exchange rate as a factor contributing to crossing the high-income threshold
For economies that are rapidly catching up, economic growth is a critical factor to reaching the standards as a moderately developed country; however, it is not the only factor.
Exchange rate also plays an important part. In theory, currency appreciation amid economic catch-up can help a country become a moderately developed country at a faster pace. But a case-by-case analysis of different economies reveals a more complicated picture.
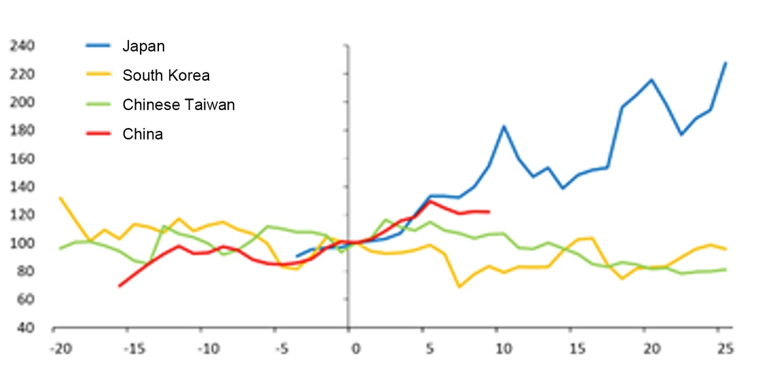
Similar to the comparison between East Asian economies amid transformation hereinbefore, we can compare the exchange rate of US dollar against Japanese yen, South Korean won, and Taiwan dollar in a given time frame. It turns out that during the two decades after their respective benchmark year, only the yen appreciated significantly against the greenback, while the won and the Taiwan dollar both depreciated; the USD/CNY exchange rate has gone back to the level a decade ago.
This comparison is certainly flawed, partly because it fails to take into account the ongoing fluctuations in the USD’s value and inflation. Thus, to calibrate the analysis, we use real effective exchange rate as the indicator to exclude the effect of these two factors.
The result again shows (Figure 5) that the value of the Japanese yen went upward dramatically in the 25 years after the country’s benchmark year, meaning that the exchange rate factor played an important part in sending Japan into the rank of high-income economies. But this is not the case for all countries. In the same time frame, the real effective exchange rate of Renminbi rose to a certain extent, while that of the new Taiwan dollar and South Korean won both fell. Thus, not all economies playing catch-up will see their currencies appreciate in value.
Figure 5: Real effective exchange rates of different economies amid transformation
Sources: Wind, Essence Securities
Note: The exchange rate of the USD against other currencies in the benchmark year is standardized at 100.
VI. Labor productivity as a factor contributing to crossing the high-income threshold
Higher labor productivity is essential for an economy to cross the high-income threshold. According to the Balassa-Samuelson hypothesis, a country with increasing labor productivity has either a rapidly growing wage level or an appreciating currency.
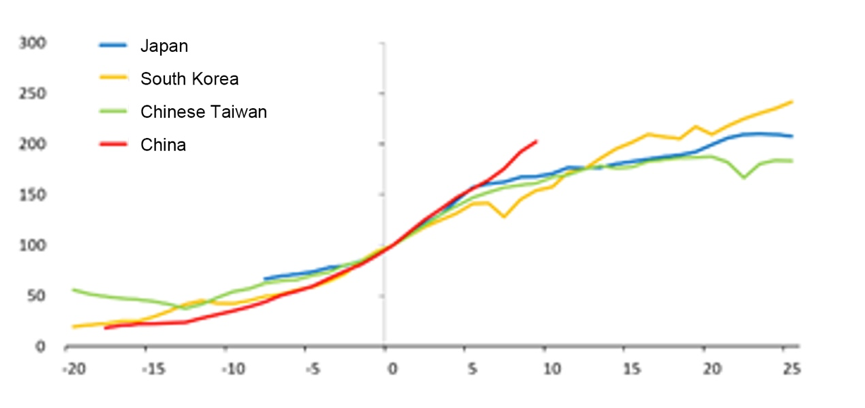
Figure 6 displays the real growth in manufacturing wage (after inflation is excluded from the nominal growth) of the Chinese mainland, Japan, South Korea and Chinese Taiwan.
Up until now, the Chinese mainland has seen the fastest growth in manufacturing wage among the four economies, followed by South Korea that outpaced Japan and Chinese Taiwan for the two decades after the benchmark year. This may partly explain why South Korea reached a higher level of average income than Taiwan after entering the 21st century.
Figure 6: Real manufacturing wage of economies amid transformation
Sources: Wind, Essence Securities
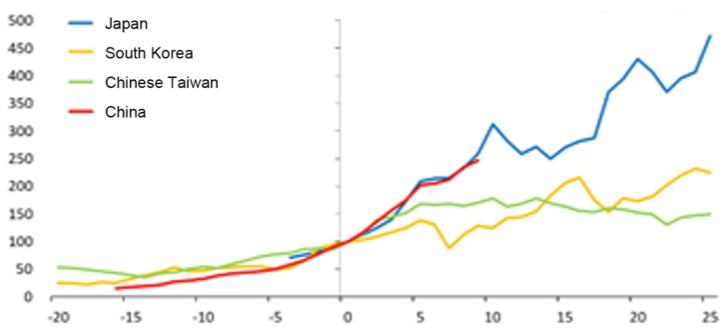
However, this comparison is also flawed as it does not consider changes in the real exchange rate. Hence, we have put forward a new indicator, which is the product of the real effective exchange rate and the real manufacturing wage. With both factors taken into account, the comparison would be more well-rounded.
The most important difference in the results is that Japan catapulted as the economy with the fastest wage growth when the rise in yen’s real effective exchange rate is taken into account; absent this factor, it actually had a slow per capita wage growth for a long time after it became a high-income country. Meanwhile, the wage in South Korea increased rapidly, but this growth rate would decline—although still higher than that of Taiwan - if we consider the depreciation of won (see Figure 7).
Figure 7: real effective exchange rate * real manufacturing wage in economies amid transformation
Sources: Wind, Essence Securities
The growth of China’s productivity up until now, with both the real wage and the real effective exchange rate taken into account, is closer to that of Japan in this comparison, which means it has outperformed South Korea and Taiwan at similar stage of development in this regard. In other words, China’s catch-up is reflected not only in its total GDP growth, but also in the continuous appreciation of Renminbi.
China’s economic growth in the next 15 years may not necessarily follow Japan’s pattern, but judging from past fluctuations in Renminbi’s exchange rate and Figure 7, currency appreciation is an important manifestation of labor productivity growth in China. This could be partly attributed to the low tolerance of the Chinese government for inflation and a more resilient labor market. Therefore, our forecasts of the economy in 2035 must consider the differences that Renminbi appreciation could make.
The real effective exchange rate of Renminbi against the basket of currencies has grown at an average speed of 1.4% annually since 1997. Based on the historical experience of other East Asian economies and other related factors, we conservatively estimate that Renminbi would appreciate by 1% each year against the USD and the basket of currencies during the years until 2035. Given that the US dollar index is currently near its long-term average, we can go further as to produce some numerical estimations based on the above discussions. For example, China’s GDP is expected to reach about $33 trillion, and its per capita GDP around $24,000 in 2030.
VII. Summary
First, for an East Asian economy that has started market-based resource allocation and export-oriented transformation and caught up in industrialization, at a certain point in time, its potential economic growth is almost solely determined by the level of average income at that time. In other words, at a certain time or given a certain level of per capita income, East Asian economies would show no significant difference statistically in their growth rates.
Second, culture is undoubtedly an important factor shaping economic growth over the long run. In terms of economic catch-up, economies with Confucian culture have generally performed well, with long-term economic growths that are significantly higher than the others. However, growth of economies with whatever religion or culture would experience long decline after the per capita income nears or reaches the threshold for high-income economies, and would circle back to and stabilize at around 3% eventually.
Third, predictions of China’s economic growth in the long run should consider both the long-term slowdown and the appreciation of Renminbi. The factors combined are expected to push up China’s per capita GDP to around $30,000 in 2035, the level of a moderately developed country. However, even at that time, China’s per capita GDP would still be way lower than that of the US (about 30% of the US number), so it remains extremely hard for China to catch up with the US in this regard.
Download PDF at: