
Abstract: Secular stagnation, the new normal of global economy, and de-globalization are two major external challenges faced by the Chinese economy. While the former features low interest rates, low inflation and low economic growth, the latter is likely to be aggravated by the COVID-19 outbreak. In the meantime, China is also facing one of the most severe constraints to economic growth, that is, total population growth will enter the negative territory very soon, which will cause serious shortfall in aggregate demand. It is against such a backdrop that China has put forward the “dual circulation” development pattern with unleashing domestic demand potential as the main body. To boost demand, China should continue to actively participate in the global supply chain while circumventing decoupling, be aware of the unsustainable role of investment in bolstering economic growth and unleash domestic consumption potential, especially that of rural residents and low-income groups.
Recently leaders of China stated that the country should give full play to the advantages of its super-large market and gradually form a new development pattern in which domestic and international circulations reinforce each other with domestic circulation as the main body.
While this has been generally referred to as the "dual circulation" policy, what should be noted is that it is a new pattern of development which not only concerns economic circulation, but also the new model and pattern of China’s economic development in the future. It is an issue that could determine whether China's long-term positive economic outlook can be sustained.
I. Secular stagnation is the new normal of world economy
First, let's take a look at the concept of "secular stagnation", that is, what kind of world economy, globalization trend, as well as post-COVID-19 external environment that the Chinese economy is facing and will face?
That “secular stagnation” is the new normal of world economy has been a consensus among many economists around the world, including Professor Stiglitz. While Chinese scholars haven’t paid that much attention to this concept so far—I'll come back to the reasons for this later—it is time for us to focus on this issue. We must understand what the new normal looks like, otherwise we will be clueless to what kind of new economic environment we are in.
At the Caijing Annual Conference last year, Zhu Min, former deputy managing director of the IMF, had a video conversation with Alan Greenspan, former chairman of the US Federal Reserve.
Several key issues were mentioned in this conversation. First, Greenspan pointed out that the global economy was facing secular stagnation, which was an important message.
Second, he attributed the global secular stagnation to the trend of aging around the world. Of course, he was mainly talking about the aging of population of developed economies, including the US. But I think he had a point.
Third, Greenspan believed that too much social welfare spending was one cause of secular stagnation, and as a remedy, the US should cut such spending. I think while his diagnosis is reasonable, the approach he proposed to address secular stagnation is debatable.
Fourth, Greenspan mentioned that China was also facing increasing aging population, coupled with increasing welfare spending, which would reduce savings and investment, and eventually hamper the increase of productivity. The policy implication of what he said is that China should not overly increase public spending on social welfare and social security like the US did.
While he was right about the cause of global secular stagnation, the solution he recommended was inappropriate at least for China. In fact, it might not be a right choice even for the US.
Figure 1 shows the global aging trend, that is, the change in the proportion of people over the age of 60 in total population over the years. As can be seen, aging is most serious in developed countries, which fits the general pattern that population ages with the increase of per capita income. However, in developing countries and emerging economies, the speed of aging has also been quite fast; especially in recent years, the trend has intensified and could accelerate further in the future.
Looking ahead, even the least developed countries will experience the same aging trend in the long run. Population aging is a global trend and also a normal inevitability throughout the world.
Figure 1: Global aging trends

The contribution to economic growth on both supply and demand sides will decrease as a result of aging. As economic growth slows down and income distribution exacerbates, rich people will not be able to spend much more than they already do, while poor people will not have enough money to spend no matter how much they want to. As a result, the propensity to save will continuously outpace that to invest, resulting in low inflation, interest rates and economic growth rate:
First, low inflation. Many people have said recently that global economic trend will likely change after the COVID-19, shifting to inflation from a long-term deflation, though I have little faith in this judgment.
Second, low interest rates. There are a variety of ways to look at interest rates. Figure 2 shows the real lending rates in several developed countries, the data of which come from the World Bank.
Figure 2: Real lending rates by country
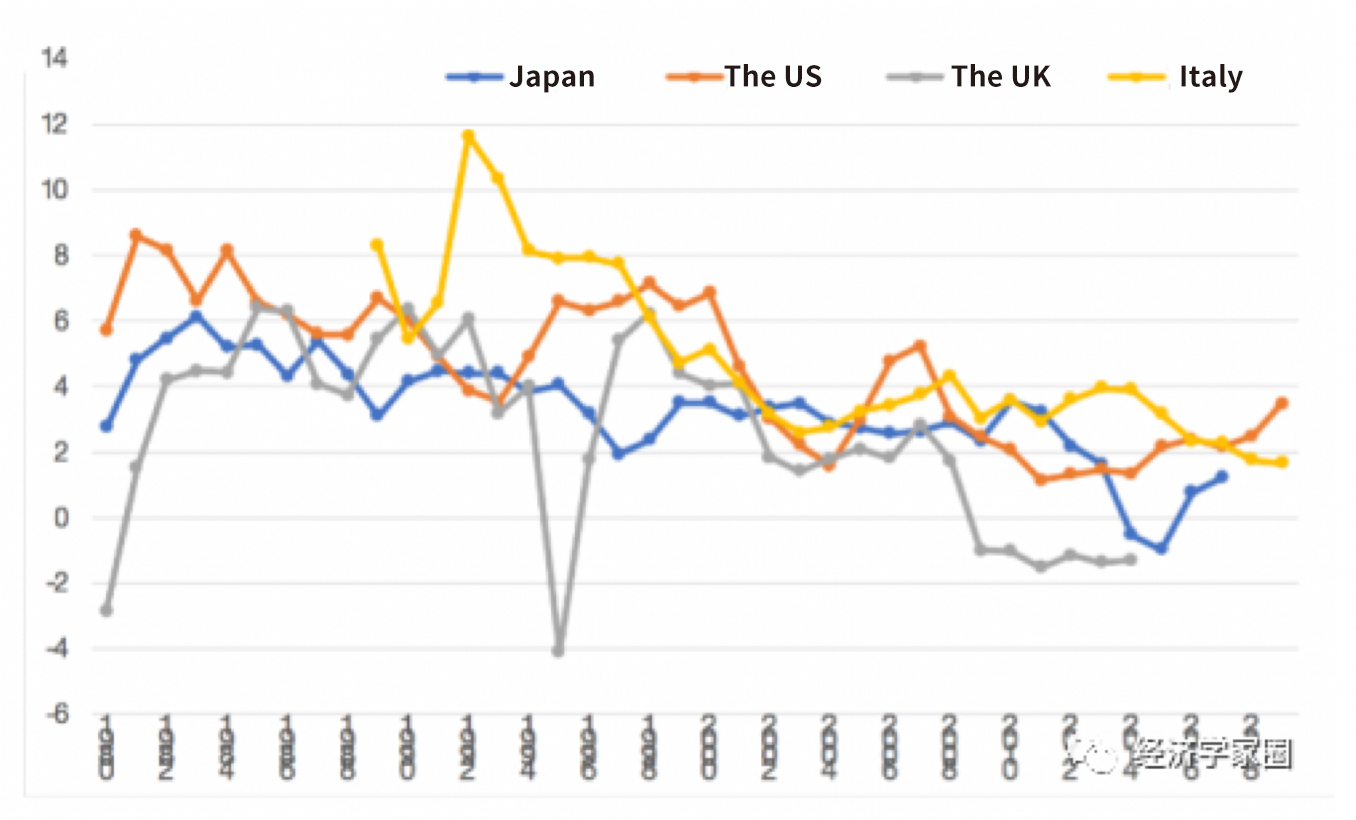
Third, low economic growth rate. This had been the trend in the developed world before the financial crisis and has intensified since then.
Such a long-term trend featuring the "three lows" started from the US and then spread to all developed countries, thus becoming the new normal of the world economy and has been referred to as secular stagnation.
What needs to be discussed is whether the secular stagnation is still going on and whether it will affect our judgment of China's external environment in the future.
Let's take a look at the impact of the COVID-19 again. Joseph Stiglitz said earlier that “a V-shaped recovery is probably a fantasy.” In fact, economists have been coming up with an alphabet soup in trying to predict the future trajectory of economic recovery. Even the Nike swoosh has been borrowed to show what the recovery might look like. I have noticed an image lately, and would love to use that to share my view on economic recovery.
It is a shape that Gillian Tett, an editor-at-large of the Financial Times, first drew when she was a rookie reporter learning Pitman shorthand. It is the symbol for “bank” as shown in Figure 3. She used this shape to suggest a possible recovery trajectory.
Figure 3: A recovery trajectory that cannot return to the original level
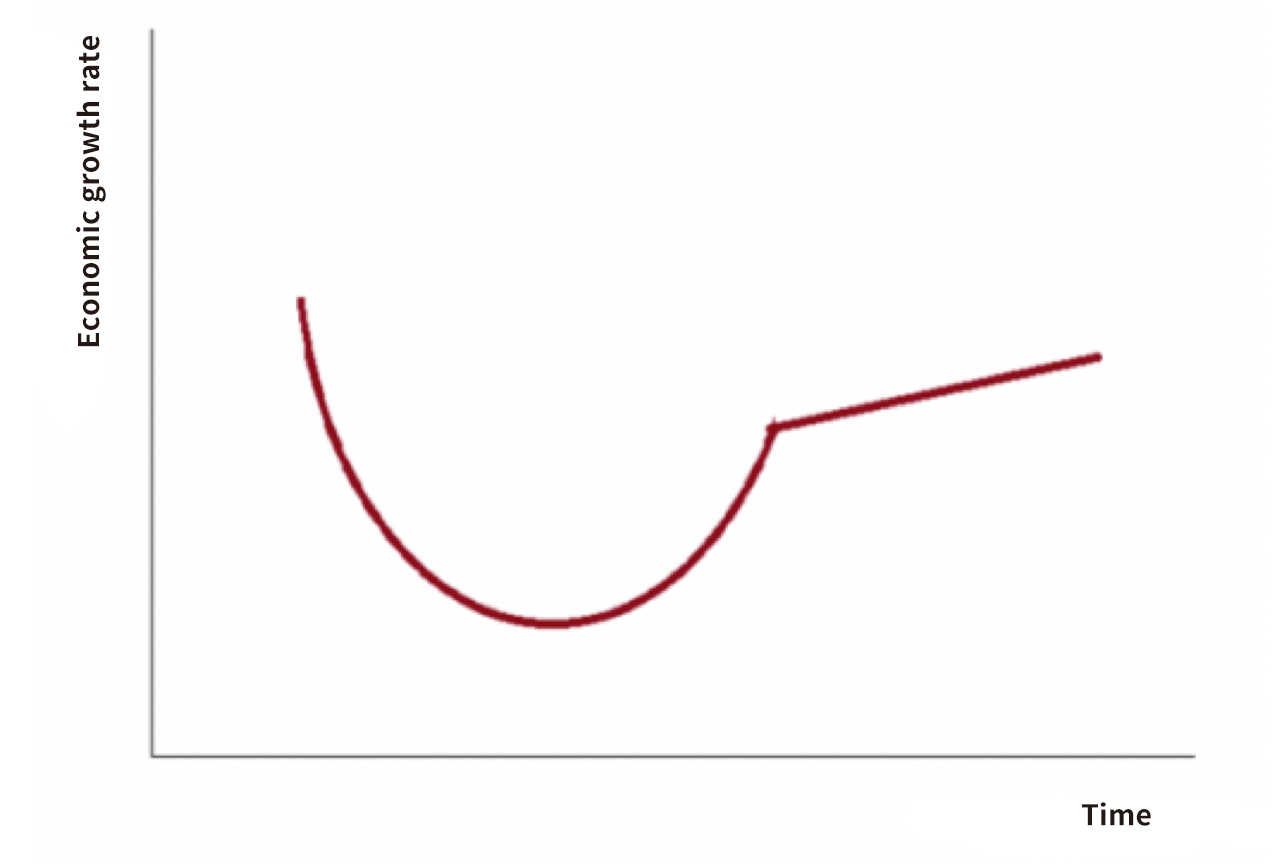
This image shows that we would not expect a V-shaped recovery for global economy. While economic recession can happen very fast, economic recovery often takes so much longer that economic growth will remain at the bottom for quite a long time.
Suppose the recovery is U-shaped. However, it will be unlikely that the economy will recover to the pre-pandemic level; instead, the recovery will highly likely terminate on the way, thereby starting a new normal. I think such a scenario is very likely to happen.
Historical experience shows that any long-term economic development trend should be gradual and slow. However, an unexpected event can induce a sudden acceleration, and as a consequence a gradual change may become an abrupt one. The trend of de-globalization and secular stagnation of the real economy are very likely to accelerate, aggravate, and intensify due to the outbreak of the global pandemic.
Meanwhile, supply chain adjustments and disruptions, especially those related to national security and public health can add more uncertainties to the recovery of the world economy.
Therefore, the global stagnation will not only persist, it may even deteriorate. This is a basic background and the external environment we are facing.
II. The starting point of the "dual circulation" pattern is to tap the demand potential
Let's now turn to China's economic situation. Of course the Chinese economy will be affected by the external environment, but a more relevant background for it is the long-term changes that have happened in the country. China is suffering from an aging population, that is, we are getting old before getting rich.
For a period of time in the future, China will face a situation featuring the world's largest aging population, and the fastest aging rate. This will be the most important or fundamental factor restricting its economic development.
Generally speaking, demographic changes usually go through two turning points, and the first is that the size of the working-age population stops growing and starts to shrink.
The population of this age group is very important, because when this population group, which is economically termed “productive population”, grows fast and is huge in number, we will have a demographic structure featuring “many producers and few consumers”. When this group peaks and then starts to see negative growth, which happened in China in 2010, it will affect a country’s potential GDP growth.
How? First there is labor shortage; second, the pace of human capital improvement will slow down with the reduction in young labor force; third, when replacement of labor by capital is too fast, it can lead to diminishing returns to capital; and the last is that there are fewer rural laborers available for labor transfer, which can result in slowed improvement in resource re-allocation efficiency and productivity. Putting these factors in the production function, we can come to the conclusion that the potential growth rate will inevitably decrease.
This was the first demographic turning point that occurred in 2010, that is, the growth of the working-age population turned from positive to negative, causing the demographic dividend to disappear (Figure 4).
Figure 4: Two turning points in China’s population growth
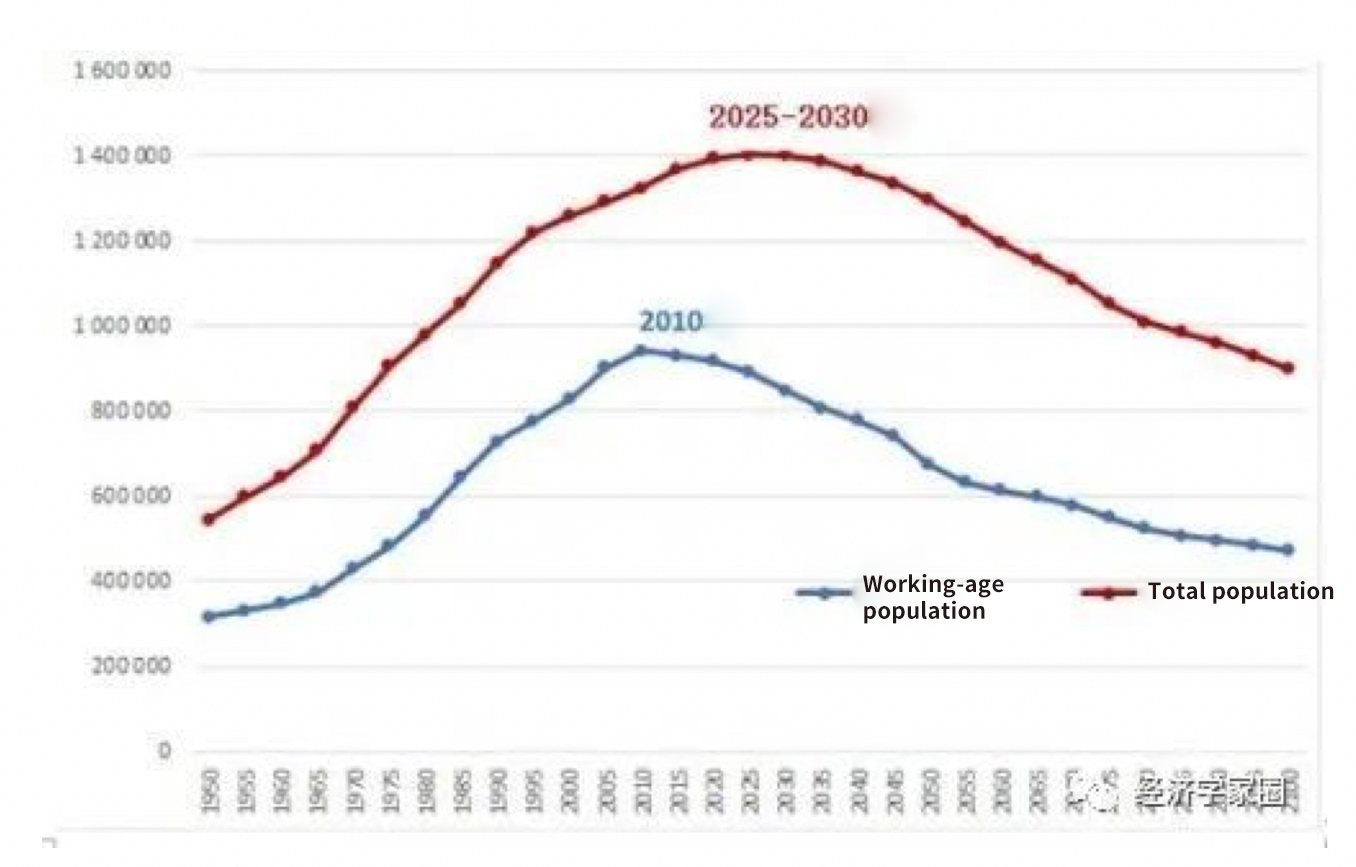
What we did not pay attention to in the past is that there may be a second turning point in population growth, which is the growth of the total population turning from positive to negative.
According to some predictions, China’s total population will reach its peak between 2025 and 2030. This is not a prediction made by me, just a range within which many predictions would generally fall. Sooner or later, this turning point will surely come, and it won’t take long to see it. We will soon face the second demographic turning point where total population growth turns from positive to negative.
What will this turning point bring? I have studied what occurred in many countries. For example, currently there are 20 countries with negative population growth in the world. Compared with other countries at the same level of development, these countries with negative population growth have worse economic growth performance. This is the first feature. The second feature is that there was a sharp decline in economic growth around the time when population growth went from positive to negative.
Generally speaking, the first demographic turning point has resulted in the disappearance of the demographic dividend and the decline of potential growth rate, which is a supply-side problem, while the second demographic turning point may produce problems related to the long-term global secular stagnation, that is, insufficient aggregate demand.
In other words, what we saw in the first turning point was the decline in potential growth rate. As long as we can maintain growth at the potential rate, the growth rate decline will be a long-term process.
However, if demand is too weak to realize an economy’s potential growth capacity, economic growth decline will be rapid and severe.
Figure 5 shows that after the first turning point, that is, when the growth of the working-age population dropped below zero, the demographic dividend disappeared and the potential growth rate declined. At that time, we had predicted a downward trend in the potential growth rate. What happened afterwards proved that the actual growth rate was consistent with the forecast.
What does this mean? First, our forecast is accurate, and second, Chinese economy has reached its potential growth rate. Therefore, we can say that there is no problem with China's economy, and so far, its development has been and will be facing an upward trend for a long time. This conforms to the law of economic development, so from that time till now, my personal research has focused on increasing the potential growth rate by carrying out reforms.
I have never worried that the potential growth rate of the Chinese economy will be restricted by the demand side. However, due to changes in the global economic environment, especially after the outbreak of the COVID-19 pandemic, the Chinese economy may suffer from demand-side constraints. If this prevents the Chinese economy from realizing its potential growth rate, we will see growth decline in a faster pace. This is why China proposed the development pattern where domestic market and international market can boost each other and the domestic circulation is the mainstay. This strategy is meant to tap demand potential.
Figure 5: The actual growth rate and potential growth rate of the Chinese economy
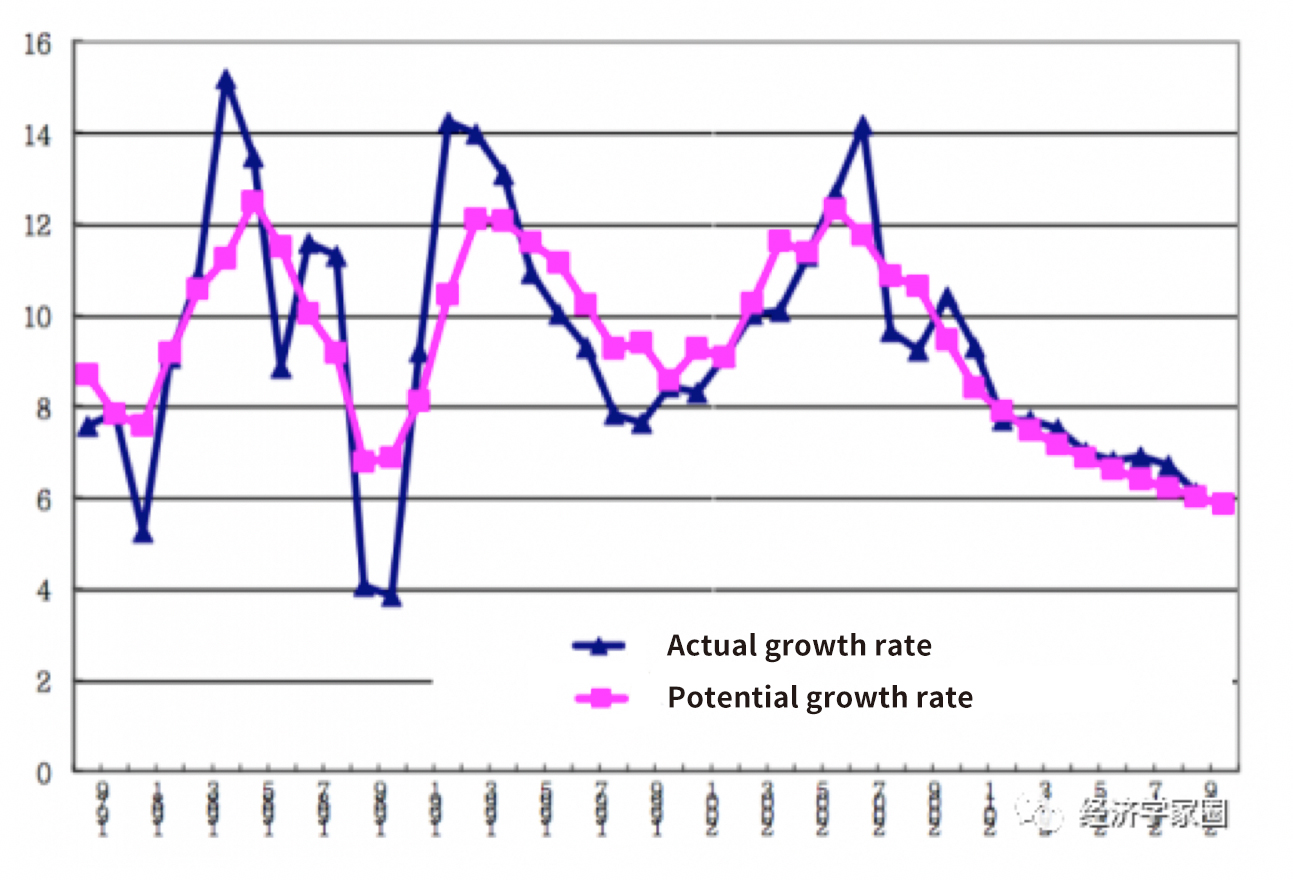
Is it possible that due to demand-side constraints, the actual growth cannot reach the potential rate? The answer is yes, and Japan is an example.
The Bank of Japan (the central bank) calculates a potential growth rate of GDP every quarter as well as an actual growth rate afterwards. Subtracting the potential growth rate from the actual growth rate, that is to say, subtracting the growth rate of potential output from the actual output, the difference is called the output gap, or the growth rate gap. If this difference is negative, it means that the actual growth has not reached its potential capacity, which is an undesirable situation.
Japan’s economic bubble collapsed in 1990 and its economic stimulus effect continued for a period of time. Therefore, in the fourth quarter of that year, the actual growth rate was much higher than the potential growth rate, and the growth gap was positive. Then it dropped more and more. Starting from 1993, until the first quarter of 2020, the output gap in most years was negative. In other words, in most cases in recent years, Japan's economic growth has not reached its potential growth capacity.
It is also worth noting that the potential growth rate calculated by Japan is actually very low. In other words, even when the potential growth rate is already very low, Japan still has not realized its potential growth capacity. We can see this phenomenon does exist and Japan’s lesson is worthy of our attention and research.
III. Consumer spending is the key to boosting dual circulation
Let’s look at the demand factors driving China’s economic growth, including external demand, investment and final consumption. Our understanding of them will affect how we take stock of China’s current economic development. Meanwhile, addressing challenges facing the three demand factors will be the focus of China’s policies to push forward the dual circulation strategy.
First, external demand.
A paradox will emerge if we simply look at the contribution of the three demand factors to China’s GDP growth: the contribution of external demand, or net exports of goods and services, to the country’s GDP growth stood at only 11% in 2019; it even fell below zero in many previous years. In statistical terms, external demand means net exports, or total exports less total imports.
So a question arises: does negative external demand mean that it is not important?
It even gives rise to a ridiculous idea that China only needs to cut down its imports so that exports can contribute more to GDP growth, which is nothing but a mercantilist conclusion. But the fact is far from that. International trade remains an important contributing factor to China’s economic growth. This is why researchers have converted the statistical concepts as shown by statistical indicators into economic concepts and re-estimated the contribution of external demands, which has important policy implications.
According to a research led by Wu Zhenqian from the University of International Business and Economics in China, during 1995 and 2011, the contribution of external demands to GDP growth reached 22%, as compared to 2.5% when calculated in statistical terms. It’s another thing whether the re-estimates of this research I quote here are accurate, but there is no deny that it embodies a correct perception that external demands remain important to the Chinese economy.
Hence, China should fully tap into its own comparative advantages, and the unique position, connection and resilience it has in the global value chain, in order to cement its in-depth integration into the global division of labor and avoid decoupling or isolation from it.
Second, investment.
It should be noted that the contribution of investment demands to GDP growth in China will inevitably decline, and it did slump in recent years. At the same time, it’s increasingly clear that the support from investment demands for economic growth is unsustainable.
To start with, overreliance on investment to achieve high growth is a feature of high-speed development, not high-quality development, while the latter is what China is seeking in its drive to transform its economic development model.
Besides, the potential growth rate of the Chinese economy has been on the downward ride for a long time, and it will finally circle back to the long-term average growth of the global economy. That will affect investment demands and their contribution to China’s GDP growth.
Moreover, the contribution of investment will not be able to remain at the historical level given the secular stagnation of the global economy and the possible speedup of de-globalization. If we compare across countries, it’s clear that if investment in an economy contribute to a much larger part to its growth than in other countries and this continues for a long time, this contribution will inevitably come down overtime.
Third, final consumption.
Contrary to investment, consumption has always contributed to a much lower proportion to China’s GDP than in many other major economies. According to statistics on consumption rates (the proportion of final consumption in GDP) across countries from the World Bank, the rate in China has been relatively low for long. While if we look at the data provided by the Chinese statistics authority, we can see that the contribution of final consumption to economic growth (in percentage points) has been declining over recent years, but its contribution to China’s GDP growth (in percentage points) has been steadily improving. Household consumption accounts for 70% of total final consumption, with urban and rural households taking up 78.2% and 21.8%, respectively.
It’s natural that household consumption, especially spending by rural residents and low-income groups, should become an increasingly important demand factor driving economic growth. This should also be a focus in China’s efforts to promote the dual circulation.
IV. Income redistribution needs to be improved during the 14th Five Year Plan period
People will spend more only when they can spend more, and to that end, three things need to be improved: income, income distribution, and income redistribution.
First, let’s look at income growth. China’s GDP and household disposable income have shown similar trend of growth over the long run, though in different periods they have grown at different speeds, with GDP growth outpacing income growth for more of the time. But since the 18th National Congress of the Communist Party of China, household income has been growing faster than GDP.
The fact that household income growth has kept pace with or even outpaced GDP growth contributed greatly to China’s success in doubling urban and rural household income on the basis of the 2010 level and poverty alleviation. Looking ahead, the country will have to ensure that the two growths keep pace at least, or it will be hard for consumption demands to continue going upward and support economic growth over the long run.
Second, let’s look at income distribution. Figure 6 shows the wealth gap in China measured by the ratio of the average income of the top-earning 20% of households to that of the bottom-earning 20%. The three curves from the bottom to the top represent respectively this ratio in urban China, in rural China, and the ratio of the average income of the urban top earners to that of the rural bottom earners.
Figure 6: Ratio of the average income of the top 20% earners to that of the bottom 20% earners
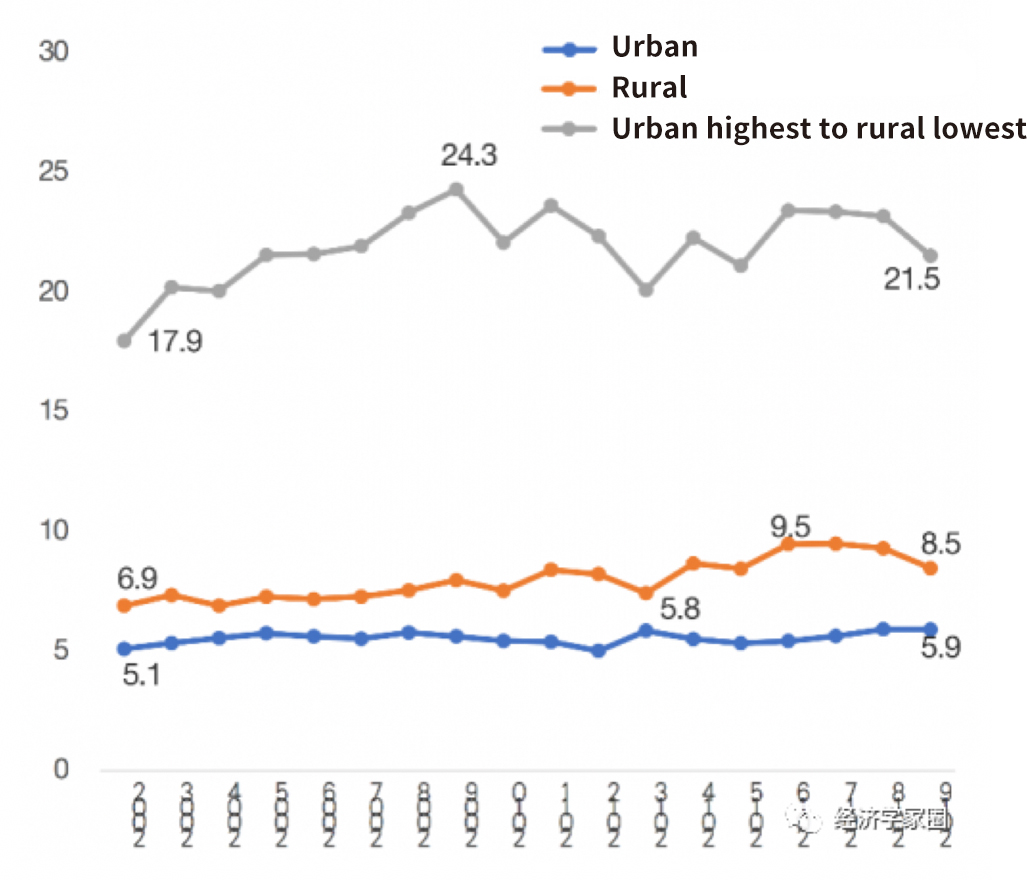
Broadly speaking, the income of all groups has been increasing, showing that the general picture is improving, but the paces of improvement for different groups have not been well-coordinated enough to close the income gap. That’s why China has huge potential to improve its income distribution.
In the past, the Chinese government has provided basic public services in order to improve income distribution, which worked well, but the improvement was mostly owed to the primary distribution function of the labor market—as the labor market developed and absorbed larger workforce, more people got jobs, low income households and unskilled workers secured higher income, and income distribution got improved as a result. But this kind of improvement cannot close the wealth gap fundamentally, not to mention that under the new high-quality growth model, the potential of the labor market’s primary distribution function to improve income distribution is increasingly repressed.
Hence, the policy focus for expanding domestic spending in the next step is to improve redistribution.
In Figure 7 below, the fluctuating curves represent the Gini coefficients of different countries. These countries are ranked according to their per capita GDP.
Figure 7: To fundamentally reduce the Gini coefficient, income redistribution must be improved
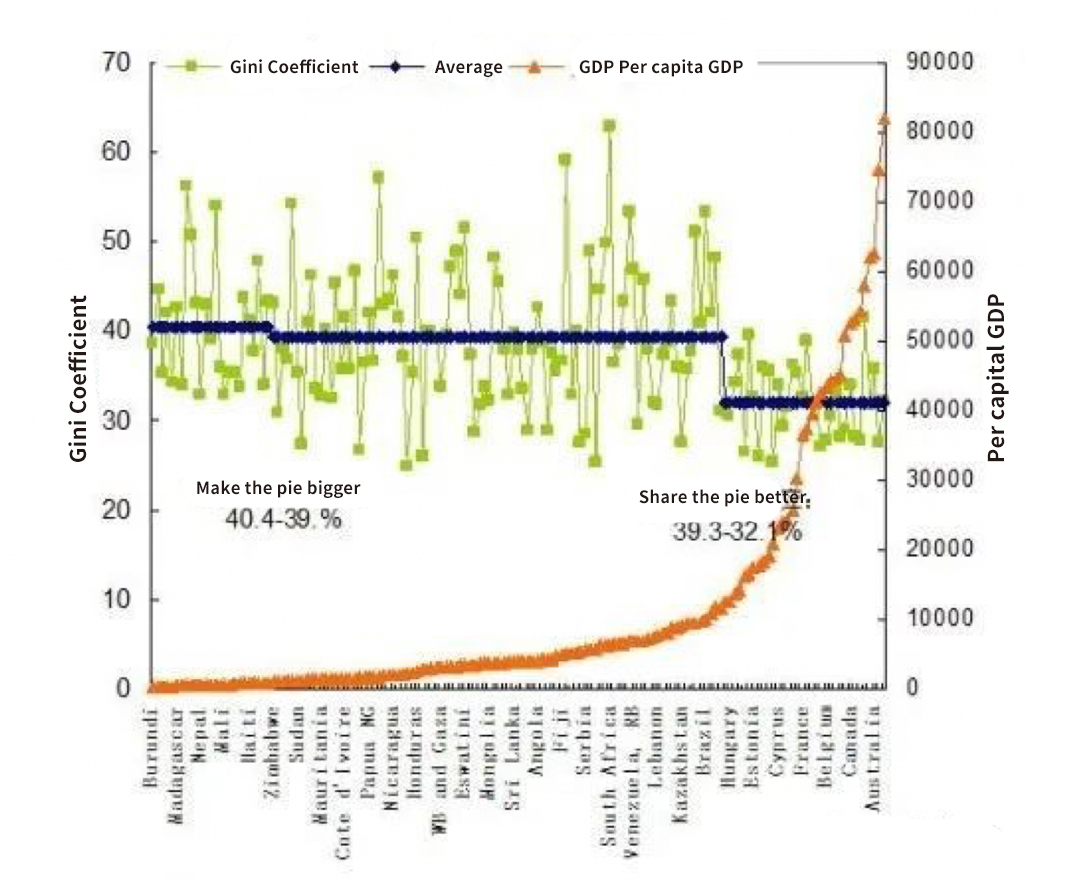
Then we calculate the average Gini coefficient for different groups of countries classified according to their level of development. We then see that the coefficient stands at around 40% for countries with medium to high level of income, which means that the wealth gaps in these countries are big; and the coefficient is much smaller in high-income countries, such as those with per capita GDP of 12000 to 15000 dollars.
We did not understand why it’s like this before. Many assumptions were put forward. But actually, it’s not as complicated as we thought. The key underlying logic here is that when a country has a higher level of income, the government will intensify income redistribution efforts with taxation and transfer payments, which would bring the Gini coefficient down immediately.
On average, OECD countries lowered their Gini coefficients by 35% through income redistribution.
In 2019, China’s per capita GDP rose above 10,000 USD, and it is expected to exceed the threshold of 12,000 USD and bring the country onto the list of high-income economies during the 14th Five Year Plan period. During this period, China should step up efforts to improve its income redistribution, deliver better and more equitable basic public services, and enhance the consumption capacity of its residents through the three channels of income increase, income distribution and redistribution, so as to boost demands to bolster up the country’s economic growth.
Download the PDF at: http://new.cf40.org.cn/uploads/2020094cf.pdf