Abstract: Both China's industrial and service sectors slumped earlier this year due to COVID-19. However, the former is recovering quickly and will likely see a surge long after the previous one in 2009-2012. Three signs point to its likely occurrence: first, the recovery of industrial production has been obviously faster than that of the service sector overall; second, the performance of SMEs shows that the recovery of the industrial sector surpasses that of the service sector; third, the recovery of electricity consumption in the industrial sector is better than that in the service sector.
At a press conference held by the State Council Information Office on July 23, an official from the Ministry of Industry and Information Technology said that China's major industrial production indicators had picked up steadily in the first half of this year. The value-added of industrial enterprises above designated size declined by 1.3% year on year (yoy), improving by 7.1 percentage points compared with the first quarter. It grew by 4.4% yoy in the second quarter and 4.8% in June, indicating improvement in production and sales.
Meanwhile, China's export growth rebounded much faster than expected amid a sharp contraction in global trade. While global trade was estimated to drop around 18.5% yoy in the second quarter according to a WTO report released in June, China's export saw a weak positive growth of 0.1% in dollar terms, hitting a record high in terms of global market share.
Various signs are showing that China's industrial production has got quite close to its normal growth rate, which is also supported by data of electricity and coal consumption of industrial firms and the rapid rebound in bulk commodity imports. But the recovery of the service sector has lagged behind, the growth of which in the second quarter was only 1.9%.
Both international comparison and comparison between China's industrial and service industries show that China's industrial sector is robust and will likely see a surge again long after it did last time.
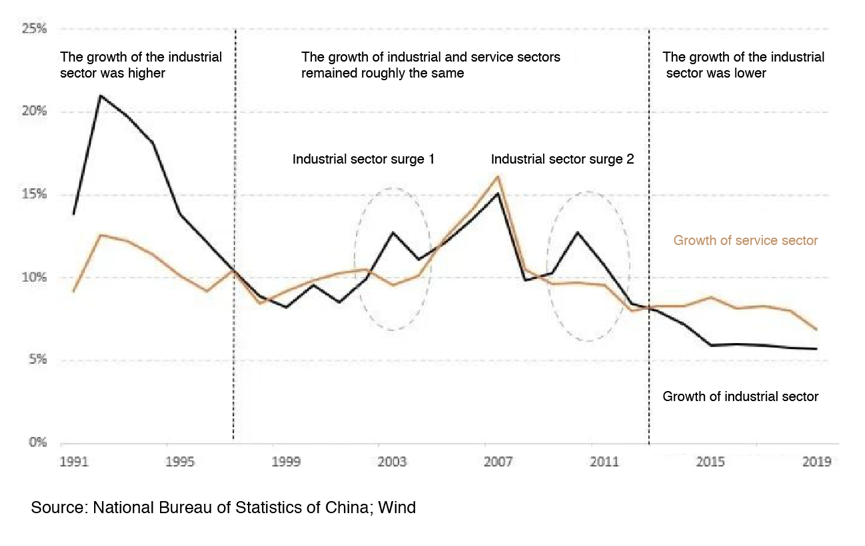
Figure 1: Comparing the growth of industrial and service sectors in China: three periods

I. China's industrial sector surges in history
Since the founding of PRC in 1949, growth of the industrial and service sectors can be roughly divided into three stages based on the comparative relationship between the two sectors:
The first stage. For most of the time before 1996, the growth of the industrial sector had far outpaced that of the service sector, resulting in the continuous rise of the former's share in GDP.
The second stage. In 1997, insufficient aggregate demand and excess capacity occurred, and the growth of the industrial and service sectors roughly converged until 2013. Meanwhile, the share of the industrial sector in total GDP remained relatively stable.
The third stage. After the economy entered the "new normal" in 2014, the growth of the industrial sector has been significantly and continuously lower than that of service sector, while its ratio in GDP also declined. China has entered a profound transformation of the economic structure.
From a long-term perspective, most industrialized countries went through such structural adjustment. What should be noted is that while the growth of the service sector has been gradually catching up with and surpassing that of the industrial sector, there were two reversals in this trend—in 2003-2004 and 2009-2012, the growth of the industrial sector soared over that of the service sector temporarily, while its share in GDP also picked up.
II. Three signs that China's industrial sector will see a surge again
When the coronavirus first hit China, both industrial and service industries fell sharply. However, three recent signs indicate China's industrial sector might see a surge again.
Sign I: The recovery of industrial production has been obviously better than that of service sector overall
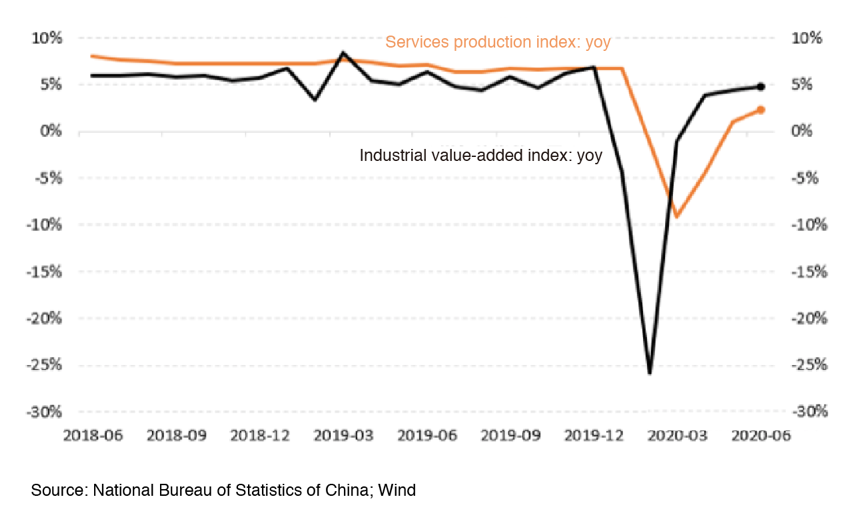
The services production index is an indicator that measures the monthly yoy changes in the price-adjusted output of the service sector. The industrial value-added index measures the monthly yoy changes in the output of the industrial sector.
Before the outbreak, the services production index remained consistently higher than the industrial added-value index, which was consistent with the comparative relationship of the two sectors' growths since 2014. After the outbreak, industrial production was once hit harder, but its growth outpaced that of the service sector in March. In June, the industrial sector registered a growth of 4.8% yoy, outpacing the service sector and basically returning to the normal growth range. While in June, yoy growth of the service sector slowed by nearly 5 percentage points.
Figure 2: The industrial value-added index has improved more than the services production index

Sign II: The performance of SMEs shows that recovery of the industrial sector surpasses that of the service sector.
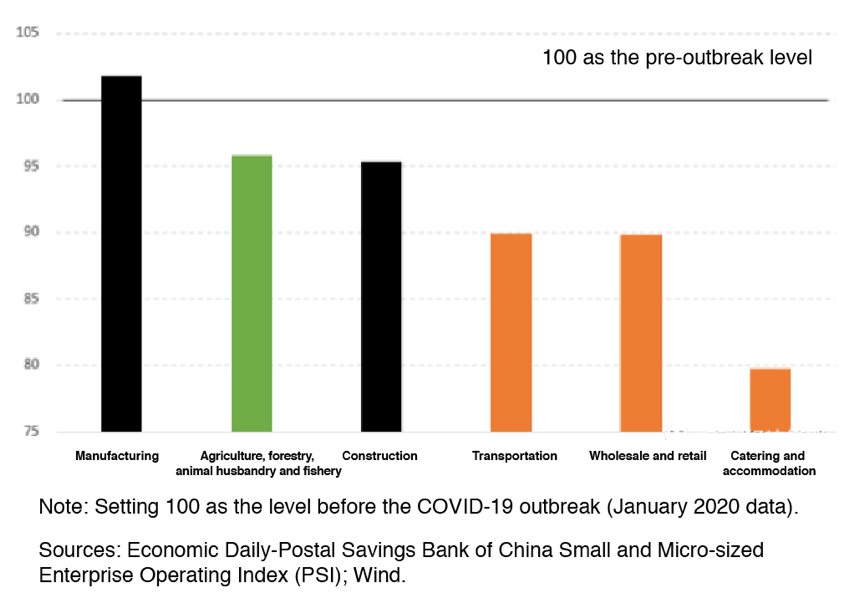
According to the Small and Micro-Sized Enterprise Operating Index jointly released by Economic Daily and Postal Savings Bank of China, in June 2020, among all SMEs, only those in the manufacturing sector have recovered to the pre-outbreak level. This also shows, from another perspective, that SMEs face more difficulties in their recovery than large and medium-sized enterprises.
Another distinct feature of the operating conditions of SMEs in June is that the performance of such enterprises in the manufacturing and construction industries exceeded or was close to the level before the outbreak. However, in the service sector, transportation, wholesale and retail, and accommodation and catering industries had much weaker performance. Among them, the operation index of SMEs in the accommodation and catering industry is still 20% lower than the level before the virus outbreak.
Figure 3: The operation indexes of SMEs in six industries indicate the performance of the industrial sector is clearly better than that of the service sector

Sign III: The recovery of electricity consumption in the industrial sector is better than that in the service sector
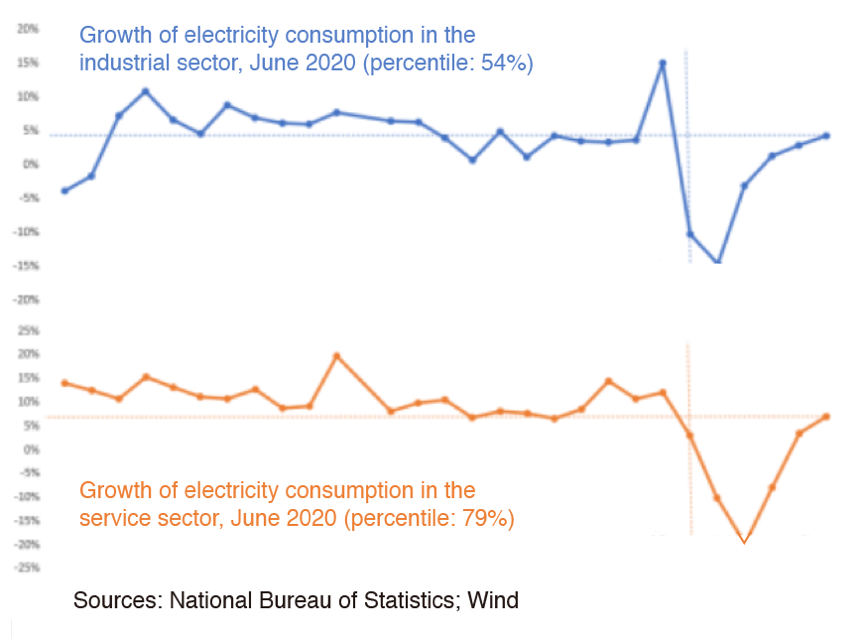
In June, the yoy growth of electricity consumption in the industrial and service sectors was 4.3% and 7.0% respectively. Seemingly the service sector had a higher growth rate in electricity consumption. However, the electricity consumption per unit GDP of the two sectors are completely different, so we cannot compare the rates directly. Judging from historical performance, 4.3% was a medium level for the industrial sector, while for the service sector, a rate of 7.0% was actually quite low.
Specifically, in the 28 months since the beginning of 2018, industrial electricity consumption in June ranked 54%, roughly in the middle of the historical average growth, whereas that of the service industry ranked 79%, obviously lower than the historical average. The percentile rankings of a longer period of 117 months starting from 2009 are respectively 56% and 80%, which show that the results are very consistent. It can be seen that from the perspective of recovery of electricity consumption in industrial and service sectors, performance of the industrial sector is significantly better than that of the service sector.
Figure 4: Yoy growth of electricity consumption in the industrial and service sectors since Feb. 2008

III. Logic behind Industrial Sector Surge
Three signs indicate a potential surge of the industrial sector. But will the surge really happen?
Let's go back to Figure 1 and examine the cause of the previous two surges. Both occurred during special times - the former occurred during and immediately after the SARS outbreak (2003-2004), and the latter occurred during the global financial crisis and post-crisis period (2009-2012).
Why did the industrial sector surge then? The answer is obvious: first, during these two periods, consumer confidence and demand of the residential sector were negatively impacted to a certain extent, resulting in a relatively lagging recovery in the service industry. Second, government-driven infrastructure investment spurred fixed asset investment in industries other than the service sector and correspondingly boosted industrial production. But the effect on the service industry, especially consumption-oriented service, is relatively limited. Now China's industrial sector is seeing a potential surge. The logic behind it is similar, but it also has the following distinctive features:
First, the shock to offline service sectors such as transportation, catering and accommodation, and cinema has a more lasting impact.
Second, the pandemic has changed the structure of household consumption, as people turn to spend more on manufactured goods and less on services. As demands for services plummet, in order to maintain their level of utility, consumers spend more on manufactured products many of which serve as direct substitutes for services— for example, people can purchase hair clippers instead of going to barbershops, or buy cooking ingredients for homemade foods rather than eating out. As a result, consumptions of goods will take up a larger part in total consumer spending.
Third, the account of tourism revenue under China's balance of payments has been seeing an annual deficit of over 200 billion US dollars over the past five years. The deficit this year is expected to decline significantly as most Chinese tourists choose to travel domestically. Besides, as analyzed above, a large proportion of travel demand will be replaced by demand for goods while demands for services will be stemmed to a certain extent.
Fourth, with various policy support, infrastructure investments resumed a growth rate of nearly 10% or even higher in May and June. Investments in fixed assets in the second half of this year are expected to increase at 10-15%. The boosted demand will help maintain industrial production at a high level, but the effect on the service industries, especially consumer service industries, is rather limited.
IV. Traits of the new wave of industrial sector surge in China
Several things may stand out in this wave of industrial sector surge in China:
First, this surge features very different structural changes that deviate temporarily from the historical trend discussed above—the industrial sector is again growing faster than the service sector, and this will be the case for quite a while. In the second quarter of 2020, industrial growth was almost 3 percentage points higher than service growth, which could be taken as the start of this wave of industrial sector surge in China.
The industrial sector and the non-consumption demands for industrial products are expected to become the pillar of post-pandemic economic growth. Meanwhile, the proportion of industrial production in GDP will also rise temporarily. This is similar to what happened in the previous two surges in 2003-2004 and 2009-2012.
Second, this wave of surge will be relatively short-lived and weak.
On the one hand, it is expected to last for a short period of time. Industrial production in China will usher in a boom of over four quarters, with its exact duration dependent upon the situation of the pandemic in China and across the world. But at the end of the day, the growth rate of industrial production will circle back to its normal level below that of the service sector.
On the other hand, this wave of surge lacks support from strong external demands compared with the one in 2003-2004, nor is it founded on huge infrastructure investments as that back in 2009-2012 was. Hence, it can be taken as a "boom" only when compared with a weakened service sector.