
Abstract: As COVID-19 becomes a new normal, it will incur additional transaction cost for offline transactions. This article finds that government subsidies will be needed to make up for these additional costs in order to bring the economy back to the pre-pandemic equilibrium. In particular, the consumer discretionary sector should be the focus of government intervention. The author estimates that the subsidy needed would be a little more than 1% of China's GDP.
I. Economic recovery model in the COVID-19 new normal
The novel coronavirus outbreak which started early this year is the most severe global pandemic over the past 100 years, and has brought unprecedented shock to the global economy.
China started to lift lockdowns in March, and the US and some of the European economies also began to restart the economy in May. How should we assess the impact of the COVID-19 on economic reopening when it still takes a long time to realize the universal availability of vaccine and effective medicines? Our starting point is transaction cost.
Modern economic activity is based on the division of labor and transactions. Although many transactions have already been shifted online, a large amount of transactions still take place offline.
From the perspective of transactions, the COVID-19 new normal will bring additional transactional cost to each offline transaction, not only the cost resulting from taking prevention measures such as wearing a mask and keeping social distance, but also the cost of infections, as low as the chance is. Economic entities weigh the trade-off between the transaction cost and return and adjust their behaviors accordingly.
If the potential benefits outweigh the additional cost, economic entities would continue the transaction; otherwise, they would postpone or cancel the transaction. If such a logic could be translated into observable, measurable and testable hypotheses, it would be helpful to deepen our understanding of the issue. So we put forward the following two hypotheses:
First, although the benefit from a transaction is hard to observe and could be subjective, we assume that in general the larger the value of a transaction is, the bigger the potential benefit will be; second, transaction cost is fixed.
Based on these two hypotheses, we could infer that: for a single transaction of a product, the larger the value of the transaction is, the lower the proportion of transaction cost will be and the more likely transactions of the product will restore to the level prior to the pandemic; in contrast, the smaller the transaction value is, the higher the proportion of transaction cost will be and the more likely transactions of a product will be canceled or delayed.
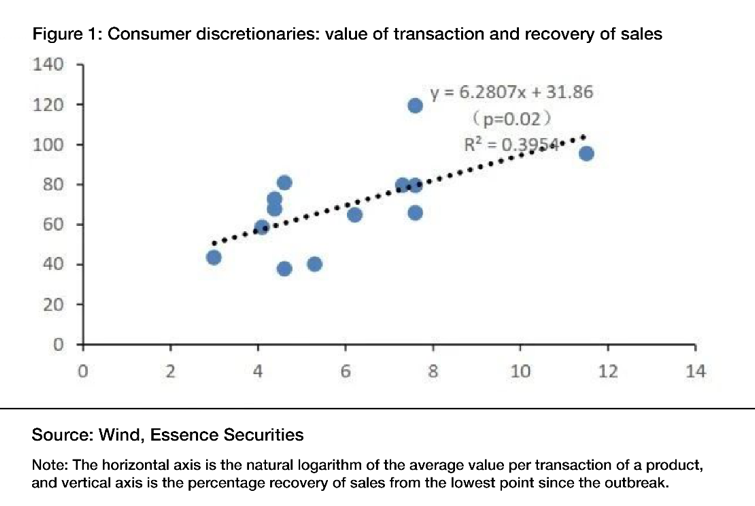
To test this inference, we first look at the cross-sectional data of 13 consumer discretionaries as shown in Figure 1. The horizontal axis is the natural logarithm of the average amount per transaction; and the vertical axis is the recovery of sales growth from the lowest point since the outbreak of the pandemic as a percentage of the decrease of sales at the early stage of the pandemic, which shows to what extent the sales of a certain product have recovered.
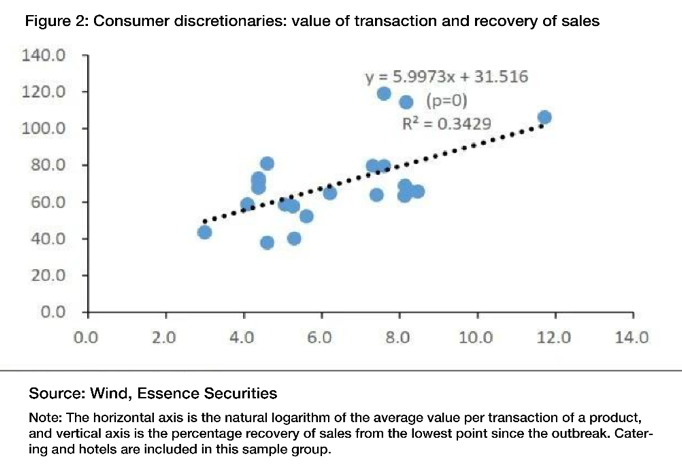
It is not hard to see that as of the end of April, there is a significant positive correlation between the amount of consumption and the extent of sales recovery. This is also true when increasing the sample size to include services such as catering and hotels (Figure 2). These two statistical results support the above inference.
It should be noted that the model is simplified in terms of the model specification, assumption of different infection probabilities for different activities and the potential impact of supply constraints in some industries, but we believe such simplification will not alter the basic analysis and conclusions.
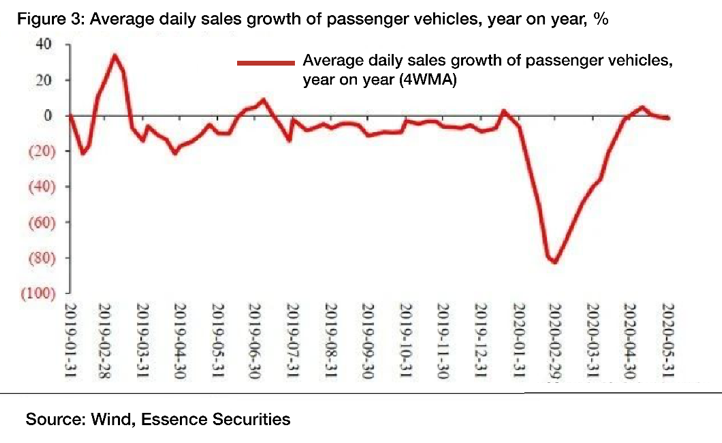
The above result is also supported by transaction data of daily economic activities. Figure 3 shows that high-value transactions of products like automobile dropped dramatically before seeing a symmetrically V-shaped recovery. Actually the transaction of automobiles has rebounded to the level prior to the pandemic.
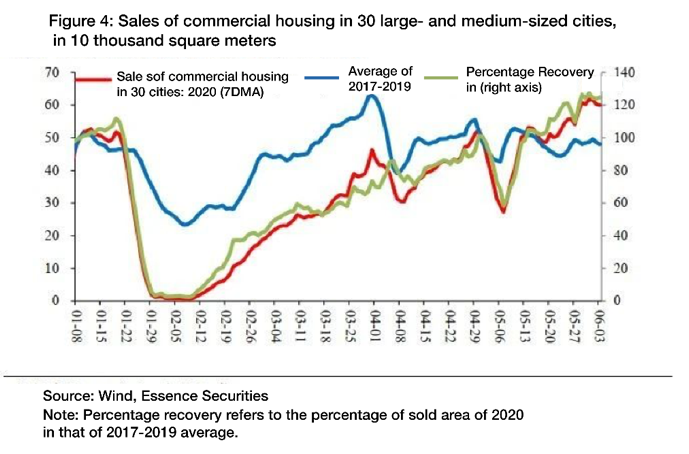
The sales of real estate have also seen a similar recovery trajectory. Figure 4 shows that the transaction of commercial housing fell dramatically from the end of January to the early of February, and began to recover rapidly since mid-February. At the end of April, the transaction had basically recovered to the level prior to the pandemic, while in June, it significantly surpassed the pre-pandemic level.
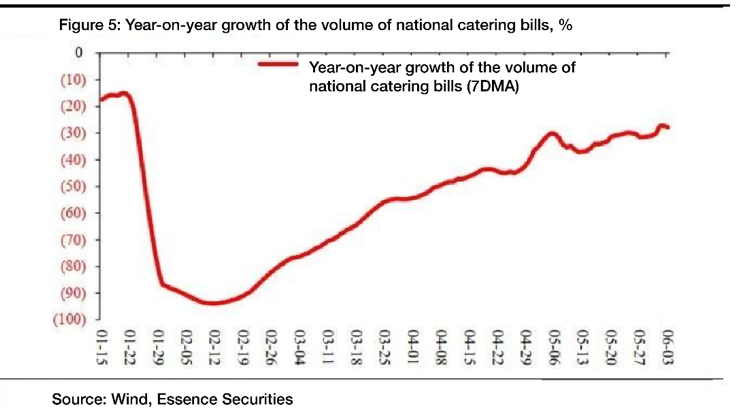
In terms of low-value transactions, Figure 5 shows that the catering sector is clearly recovering, but the total volume of transaction at the end of April was about 30% lower that prior to the pandemic. Even in June, it is still 20% lower than the historical average level.
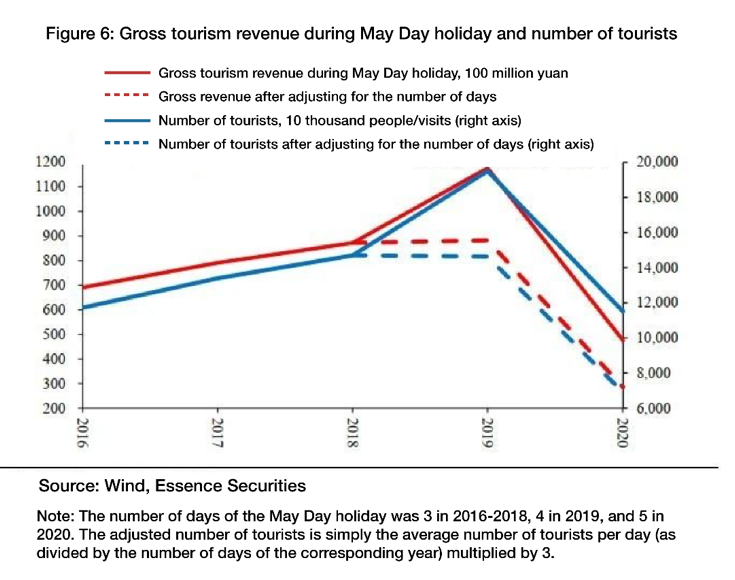
Meanwhile, Figure 6 shows that both the number of tourists and gross revenue of tourism during the May Day holiday this year dropped significantly compared with the same period of last year.
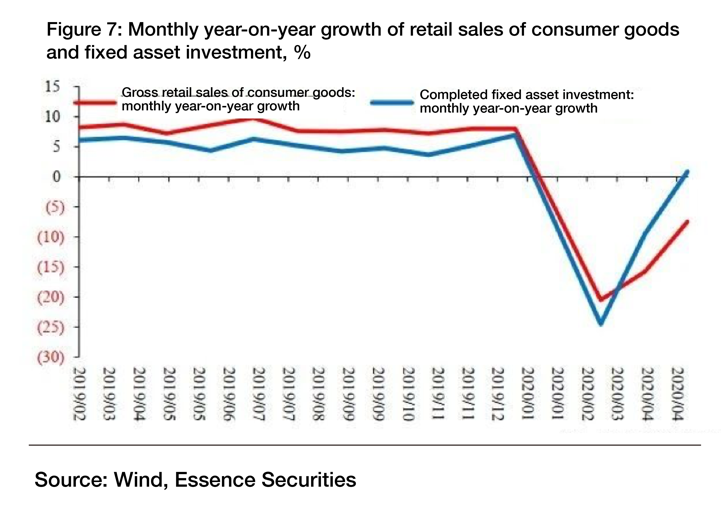
From the perspective of aggregate consumption and investment in the economy, the value of a single transaction of fixed asset investment is significantly larger that of consumption.
Figure 7 shows that investment has seen a V-shaped recovery, and is likely to get back to the pre-pandemic level in May; but retail sales of consumer goods are still significantly lower than the pre-pandemic level overall, and the recovery momentum of retail sales is also significantly weaker than that of investment activities.
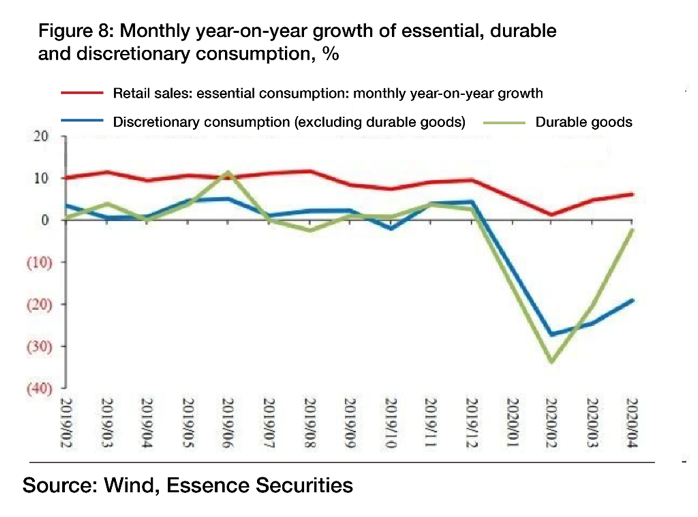
The retail sales of consumer goods can be further divided into that of essential, discretionary and durable goods. From Figure 8, it can be easily seen that the recovery of durable consumer goods of high value is significantly faster than that of other discretionary goods.
Overall, each single transaction will incur additional transaction cost under the COVID-19 new normal, which is fixed to some extent. Under such a condition, the impact of COVID-19 will be smaller on high-value transactions relative to low-value ones.
From a macroeconomic perspective, COVID-19's impact on high-value investment and durable consumer goods has basically gone, but it still inhibits low- value transactions which can hardly shift online.
II. The mechanism of transaction cost and quantitative measurement
In the next part, we attempt to estimate the cost of transactions and analyze the micro mechanisms through which transaction cost affects transaction activities, and thereby put forward appropriate policy suggestions.
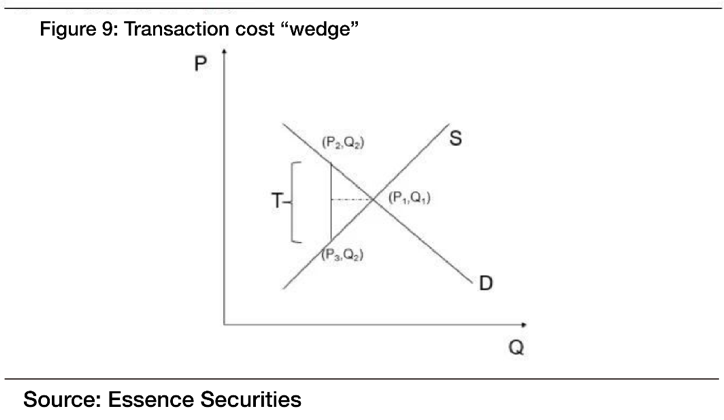
In terms of the analytical model, Figure 9 shows that the equilibrium between supply and demand is (P1, Q1) when there is no transaction cost. The additional transaction cost under the COVID-19 new normal is marked as T (transaction cost), and the vertical length of T shows the cost of the transaction.
When transaction cost is introduced into the transaction process, how will the market reach a new equilibrium?
For producers, consumer demand has declined due to the pandemic, which means that the impact of the disease is a demand shock, and the new equilibrium lies at (P3, Q2).
For consumers, they have to bear an additional transaction cost for each transaction, which means the price of each transaction has increased. Therefore, for consumers, the impact of the pandemic is a supply shock. The new equilibrium now lies at (P2, Q2). The price P2 borne by consumers under the new equilibrium consists of two parts, one is P3 which is paid to producers, and the other is transaction cost T.
This theoretical model actually is similar to a tax wedge: when the government imposes a fixed amount of tax on a commodity, it will have an impact on its transactions . Here we use transaction costs to replace taxes in the tax wedge.
The model is explained as follows.
First, the triangular area enclosed by P1, P2, and P3 is the loss of social welfare caused by the pandemic.
Second, it appears that consumers shoulder the transaction cost brought about by the pandemic. But in fact, under market equilibrium, this transaction cost is shared between producers and consumers. The reason is that consumers reduce transaction activities because of the cost, which will lead to a lower equilibrium price. Due to the price decline, producers have to share the additional transaction cost to a certain extent. The additional cost shared by producers is P1-P3, and the transaction cost ultimately borne by consumers is actually P2-P1. The relative allocation between the two parties is determined by the elasticity of the supply and demand curves.
Third, this model can be generalized if we do not consider other complicate situations. By generalization, it means that at the beginning of the outbreak, with no knowledge about which protective measures are the most effective and unable to objectively measure infection risk, people in a panic mode tend to perceive the risk of infection as extremely high. Under such conditions, the transaction cost represented by T can be regarded as being very large or even infinite. In this model, it means T expands vertically in an infinite manner, which is equivalent to having T move continuously along the horizontal axis to the left, until the transactions come to a complete stop.
When vaccines or medicine are widely available, people do not need to take protective measures anymore, and have no risk of infection. At that time, the transaction cost will drop to 0, T continues to move to the right, and finally the market returns to the original (P1, Q1) equilibrium level.
In addition, when the disease becomes part of the normal life, what kind of protection measures are most effective, and what is the risk of infection? People have to go through a process of trial and error to answer these questions. At first, it will be only a subjective judgment, based on which people carry out many transactions. Then people find that the risk of infection seems to be very low, so they begin to adjust their risk perception. Then the implied transaction cost will also fall, T keeps moving to the right, and the market get closer to the state before the pandemic. But in theory as long as the infection risk exists, the transaction cost will always exist, and transactions cannot return to the original equilibrium of (P1, Q1).
Under the new normal, economic entities continuously adjust their assessment of the probability of infection, and adopt more effective, less expensive protective measures. This process can drive down transaction cost and push the market closer to the pre-pandemic equilibrium level, which in turn will facilitate the overall recovery of economic activities.
Since March, China's economic activity has followed this pattern, and the economic recovery in the US and Europe may also follow this pattern. The main difference may be that China has largely eliminated the virus in the country. So Chinese people perceive infection risk as very low. In the US and Europe, economies are reopening, but the number of new infections per day is still very high, so the European and American's assessment of the risk will be higher than that of the Chinese, which will restrain the economic activities to a greater extent.
But there is no doubt that this model is still a simplified analysis. It may capture important factors and features of the reality, but reality is always more complicated than theory.
With this theoretical framework, we can evaluate the value of transaction cost. In the above model, it is relatively simple to do so. Because (P1, Q1), the equilibrium level before the pandemic, is known, Q2 is also known, so to get T, we need to estimate the elasticity of the supply and demand curves.
However, there are many statistical difficulties in estimating the elasticity of supply and demand curves which are affected by many complex factors in addition to the price. To accurately estimate these elasticities requires massive amounts of data, sophisticated data processing methods, and some rough assumptions.
For us, we do not try to estimate the elasticity of supply and demand of each commodity, because doing so is too tedious and of limited significance. Our basic idea is to combine consumer discretionaries as a composite commodity to estimate its supply and demand elasticity, and the transaction cost is the average of that of all the commodities.
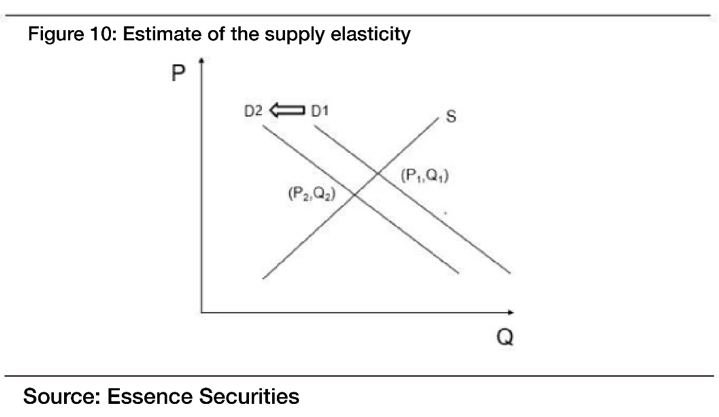
Estimating the supply elasticity of a group of commodities is relatively simple in theory. For producers, the impact of the pandemic is a demand shock. As shown in Figure 10, the pandemic causes the demand curve to shift from D1 to D2, so that the market equilibrium moves from (P1, Q1) to (P2, Q2), and both equilibria can be directly observed. The pandemic itself is like a natural experiment, and is an exogenous shock led by demand, so based on the observation of these two values, the elasticity of supply can be obtained.
According to our estimate, the supply elasticity is 4.4, which is likely the upper bound of the true supply elasticity. Since the restrictions imposed by the government on production activities during the pandemic have stemmed supplies, the supply elasticity calculated based on the assumption that the virus only affects demand could be overestimated. The actual supply elasticity may be somewhere between 2 and 3.
As for the demand elasticity— based on studies of consumption coupons issued recently, Liu Qiao et al. at Guanghua School of Management of Peking University estimated that the absolute value of the demand elasticity stood at over 3.1. However, considering that the issuance of the coupons has affected consumer spending, the number could have been overestimated.
Building on observations of past fluctuations in the transaction volume and the price of the composite commodity, we have tried to reproduce some of the data in a natural experiment context. Drawing from the pattern of the data and our experiences, we believe that the absolute value of the composite commodity’s demand elasticity is probably around 2.
Technically speaking, many variables could affect the accuracy of this estimate, but we can assume the demand elasticity to be somewhere between 1 and 3, and the supply elasticity to be somewhere between 2 and 3, and thereby derive a range for transaction cost. We can keep trying to deliver a more precise result for more accuracy. Yet, we believe that it is more or less of the correct magnitude.
With the estimates of the elasticities above and observations of the transaction activities at the end of April, the cost of each transaction is assessed to be 330 yuan.
We reckon that the ultimate transaction costs will stand at over 140 yuan after the economy is back in equilibrium. This is a high price for many small-value transactions to pay, but negligible for large-value deals. For instance, a transaction cost of 140 yuan takes up only a small proportion of home appliance purchases at 2000 or 3000 yuan, and thus exerts very limited influence on these transactions; in comparison, it could be too much for the purchase of a movie ticket or a meal.
III. Policy suggestions focusing on subsidizing transactions
What policies should be adopted in response to the increase in transaction costs?
If the additional cost for each transaction is 140 yuan as we assumed, to push the economy back to normal, the government should subsidize each transaction with the same amount of money— in addition to medical efforts including the development of vaccines and treatments.
In other words, if the government provides a subsidy of 140 yuan for each transaction, the market will resume its pre-pandemic equilibrium.
From a theoretical perspective, this policy can deliver many favorable outcomes.
First, except for certain vulnerable sectors and groups that have borne the brunt of the pandemic’s blow, the others have basically gone out of the virus’s shadow. Through government subsidies, the loss in social welfare by these vulnerable groups can be shared among all taxpayers, which has similar effects as social insurance. This is a support mechanism that should be put in place amid crises.
Second, this policy does not distort resource allocation. It can bolster economic recovery without incurring any additional loss of social welfares.
Third, the amount of subsidies could be flexibly adjusted according to the pandemic’s development. If the risk of a recurrence increases as the weather gets cold, the government could provide more subsidies; if the virus gets well under control, the amount can be reduced; and if the pandemic is eradicated, the government could immediately remove the policy.
By driving economic recovery, the subsidy policy could save the economy from being caught in a downward spiral and produce a multiplier effect.
However, will the subsidies to be distributed place too heavy a burden on government spending? We have also performed analyses on this to offer a policy approach and analysis of the magnitude needed.
Since investment activities and some of the spending on durables have come back to normal, subsidies should mainly target the consumption of non-necessities. According to the proportion of spending on non-necessities and observations of related transactions, we estimate that the subsidies would account for slightly over 1% of GDP.
That means if the government sets aside a total of 1.2 trillion yuan to subsidize all transactions of non-necessities, each at a fixed amount, the economy will resume its pre-pandemic equilibrium in theory.
Of course, exactly how this subsidy scheme should be implemented involves many complications, and the above analysis is theoretical and only intended to provide a general policy direction. Various constraints and operational feasibility are yet to be considered in designing concrete moves.
IV. Conclusion
This paper analyzes the impact of the COVID-19 pandemic on the Chinese economy after it becomes the "new normal", discusses the micro mechanism of how the outbreak affects economic activities, compares the author’s theoretical inferences with related real-time data for validation, and based on estimates of key theoretical parameters, puts forward corresponding policy suggestions.
We believe that under the new normal, each offline transaction incurs additional cost to people which is comprised of two parts— 1) cost incurred to prevent infection, and 2) suffering and hardship once infected. Economic entities will compare the additional costs with the potential benefits, and adjust their behaviors accordingly (online transactions are not discussed in this paper for simplicity).
Assuming that high-value transactions deliver higher potential benefits, and the cost of each transaction remains relatively stable, we can reach the following conclusion: the transaction costs account for a small proportion of benefits in high-value transactions, which are easier to resume their pre-pandemic vitality; on the contrary, the transaction costs would be relatively higher in low-value transactions, which are therefore more difficult to pick up quickly.
In the empirical test we carried out, data at both the sector level and the aggregate level in China have confirmed the conclusion above. How well the virus is contained affects how individuals assess the risk of infection, which is an important factor in determining the transaction costs. Drawing on the tax wedge model, we have studied the influence of additional transaction cost on the equilibrium price level, estimated the transaction cost based on April's data, and proposed policy suggestions accordingly.