
Abstract: 2019 is coming to an end. At this point, looking back, how do we evaluate China's economic transformation in the past ten years? Looking forward, how do we view the prospects for China's economic growth in the next ten years?
On December 10, the author conducted a detailed comparison and analysis of China's economic transformation in the context of the transformation of East Asian economies in his new article.
According to Gao, China's economic slowdown hasn't ended so far. The study found that in the past eight years, China's overall performance was close to Japan, South Korea and Taiwan within similar period in terms of economic growth rate, urbanization, exports and manufacturing competitiveness. But there are certain pressures in areas such as investment rates, leverage and population aging, which may further affect the economic performance of the next decade (2020-2030).
In October 2010, we wrote the research report "Changes Unseen in Thirty Years-Turning Trends in China's Potential Growth". In the article, we discussed the trend of China's potential economic growth from 2011 to 2020 and the impacts. At that time, our estimation under a neutral scenario believed that the potential growth rate of China's economy may fall to about 7% by 2015 and further drop to about 5.5% by 2020. In addition, we proposed that with the downward trend of the potential economic growth, the government might continue to adopt counter-cyclical policies, which would accumulate loads of distortions and potential financial risks. Ten years later, we could see that the deviations between the projections and the reality are not huge, while the key ideas behind it are barely satisfactory. Since 2010, China's economy has generally been on a long-term downward trend with variations. The most important reason is that with the economic development and higher income level, China has gradually shifted from imitation-driven model to innovation-driven model, relying more on consumption and services instead of exports and investment to stimulate the economy. At this point, how do we evaluate China's economic transformation in the past ten years? How do we view the prospects for China's economic growth in the next ten years? To answer these questions, we tried to conduct a detailed comparison and analysis of China's economic transformation in the context of the transformation of East Asian economies.
I. China's economic growth performance has been similar to Japan and South Korea in the past eight years
To make the international comparison, we need to benchmark China's economic transformation with the historic transformation of East Asian economies. In order to find the benchmark year, we used two indicators, one is GDP per capita in US dollar, with the dollar value adjusted in the historical series. The second is the changes in the proportion of the secondary industry to the tertiary industry within the economy. Considering these two indicators, we established the benchmark year of economic transformation, as shown in Table 1. That is, China's economic development level, per capita income and living standard in 2010 were roughly the same to those of Japan around 1968, Korea about 1991 and Taiwan around 1987.
Table 1: Comparison of China, Japan, South Korea and Taiwan (China) in Development Phases

Source: Essence Securities
Based on above benchmarking, we will compare the main economic indicators of chosen economies.
First, the economic growth rate. We take the benchmark year as Year 1 to observe the economic growth of chosen economies in the two decades before it and the two decades after it. Considering the data variates greatly in a short cycle, we carried out moving average on the economic growth rate. The conclusion is quite clear. As shown in Figure 1, although China's economic growth has its own characteristics, the trend of downward economic growth in the last ten years was also witnessed during the transformation process of other East Asian economies. In the corresponding years, the average economic growth rate of Japan, South Korea, and Taiwan (China) is roughly the same to China.
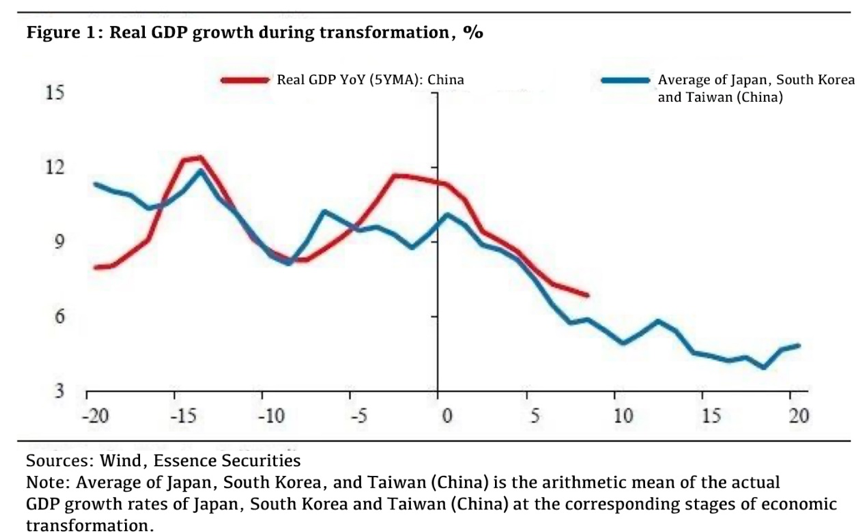
If the historical experience shown in the figure is generally credible and can provide reliable references for future economic trend predictions, we believe that China's economic slowdown so far has not been over. According to the data, the average growth rate of Japan, South Korea and Taiwan (China) after the transformation is about 4-5%.
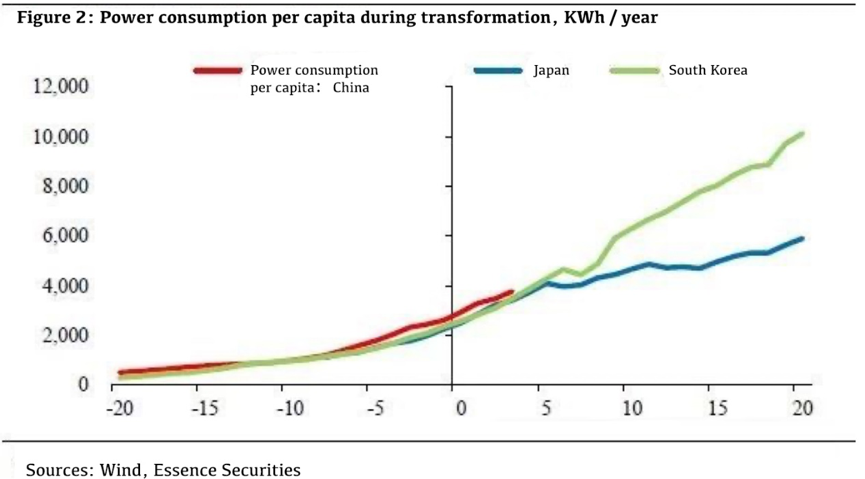
We compared the electricity consumption per capita of East Asian economies during the transformation in the same way. As shown in Figure 2, in the past two decades, the increase in power consumption per capita of China has been very close to those in East Asian economies in their benchmark stages, which also indicates to a certain extent that there are many comparable elements in the transformation process of China and other East Asian economies.
Another indicator of great significance for economic transformation is the urbanization rate. As shown in Figure 3, China's urbanization rate has always been well behind that of other East Asian economies in comparable stages on the surface.
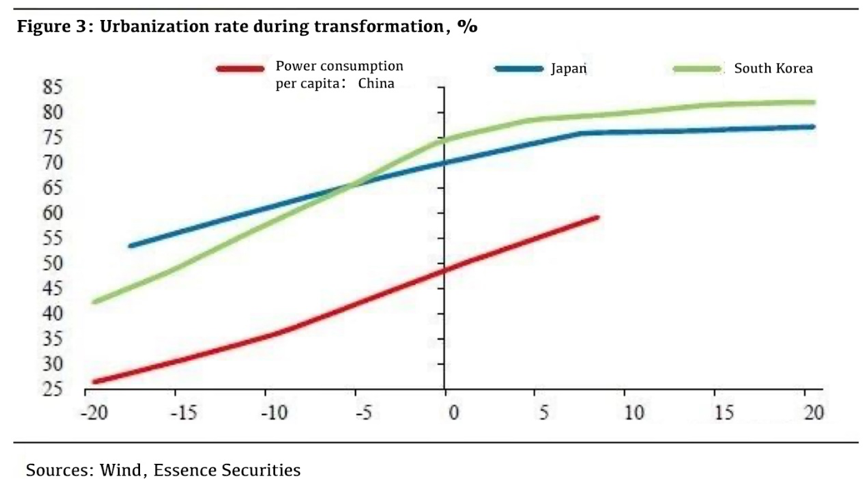
However, further study of China's transformation revealed facts that seem to be inconsistent with above urbanization data. The main cause is there are many difficulties in the definition and calculation of the urbanization rate indicator, such as China's household registration system and challenging statistical techniques. Besides, due to the impact of the One Child policy, the aging degree of China's population is significantly higher than other East Asian economies, which means it is difficult and of limited sense to growth in achieving higher urbanization level. We tried to build another indicator, namely the proportion of non-farm payroll in the total working-age population. As shown in Figure 4, this indicator reveals the profound internal transformation that China's economy has undergone. In the past decade or more broadly, the past four decades, the transformation that China has gone through is not inferior in any respect to other East Asian economies.
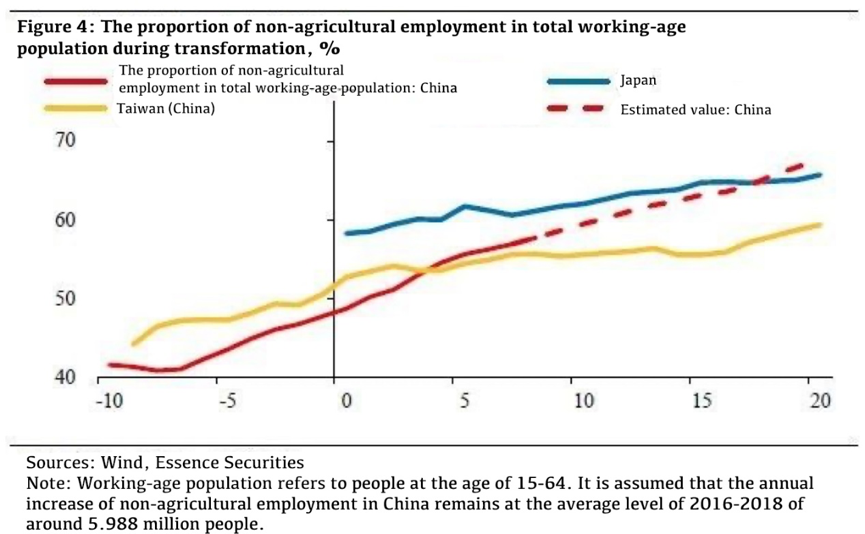
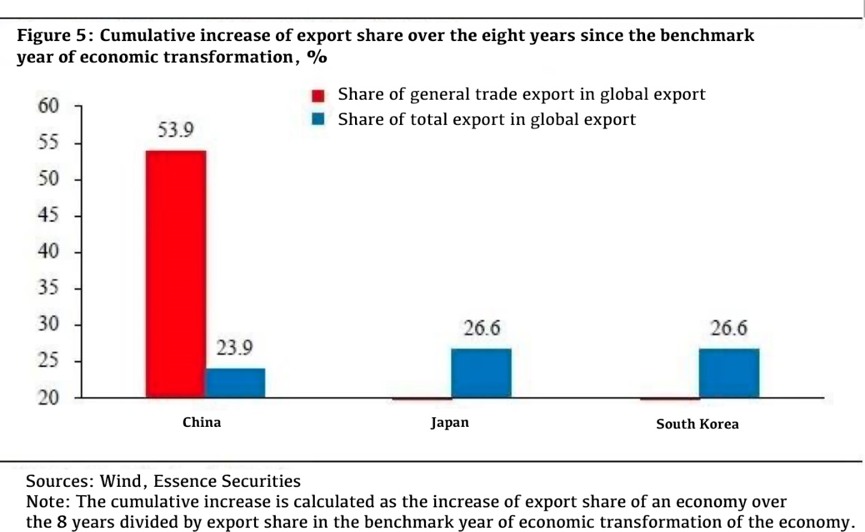
This indicator has two important implications for our projection of economic growth in 2020-2030. Firstly, if we take this indicator as a reasonable measure of China's real urbanization rate, China's rapid urbanization process is likely to have entered the late stage, and China's urbanization process will basically end not too far into the future, or at least will slow down substantially. Secondly, the basic idea of these dashed lines in figure 4 is that if the annual employment-generating capacity of the secondary and tertiary industries in China's urban economic sectors remains at the average level of the past three years, the proportion of non-agricultural employment in the total working-age population in China will gradually exceed that in Japan at the same stage of development. In conclusion, given that the working-age population has begun to decline, and that the proportion of working-age people working in urban economic sectors is already at a fairly high level, it will become increasingly difficult to maintain the current rate of increase from that level. Thirdly, let's evaluate the improvement in the competitiveness of China's tradable sector over the past decade. The past decade's economic growth and the rise of service industry are the continuation of urbanization, while China's manufacturing sector and tradable sector are also growing at a high speed, which provides a technological foundation for China's economic growth. How should we evaluate the improvement in the competitiveness of tradable sector in China over the past ten years? We can use two angles: the first is to observe the change of the competitiveness of China’s export products in international trade. A relatively easy indicator to calculate and compare is the change of global market share of China's exports. If the competitiveness of China's exports relative to the global average level is rising, then the share of China's exports in the international market will rise. Compared with other economies, China has a large number of processing trade, which has enlarged China's total export volume. Considering the influence of this factor, we calculate China's export competitiveness using two indicators, as shown in Figure 5, the red histogram represents the change of China's general trade export share in international market, and the blue one represents the change of general trade plus processing trade market share. In the eight years since the benchmark year of economic transformation, the global market share of Japan's exports increased by about 26%, which was close to that of South Korea, while the share of China's exports including processing trade increased by about 24%. The share of China's exports excluding processing trade increased by 54%. In other words, the share of China's processing trade backed by cheap labor has shrunk sharply in the past eight years, but the share of general trade export relying on technological progress and independent innovation has increased substantially. Even if processing trade is included, the increase of China's total export share is very close to that of Japan and South Korea in the same period. From this point of view, in the past eight years, the increase of China's international competitiveness during economic transformation has been at a normal level, even slightly better than that of Japan and South Korea.
The improvement of the international competitiveness of export sector can also be manifested in a substantial increase in the wage level of workers in the export sector, or in a substantial appreciation in the domestic exchange rate. Generally speaking, manufacturing goods are tradable, which means that behind the competition in manufacturing industry is the competition between the labor force engaged in manufacturing activities, which involves the level of education, creativity, and technical complexity of the labor force and their relative wage level. Therefore, we believe that another important perspective to look at the changes in the competitiveness of the tradable sector is to observe the changes in the wage level of workers in the tradable sector and the changes in exchange rates.
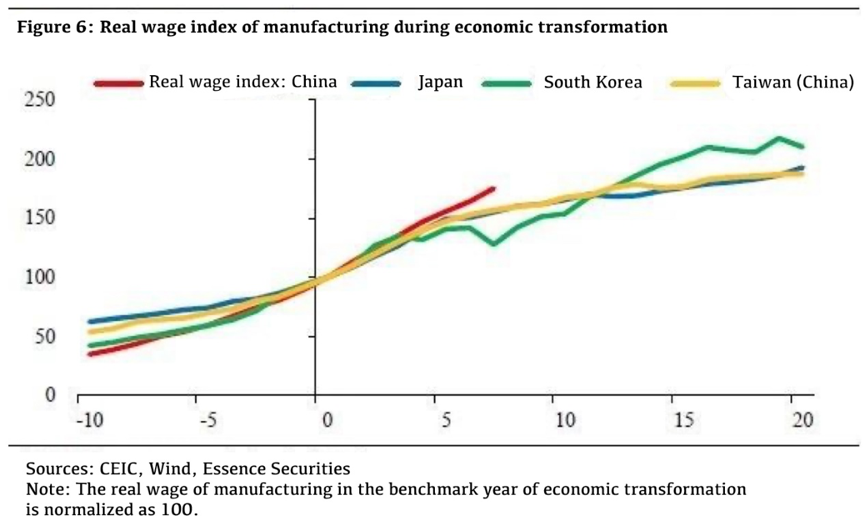
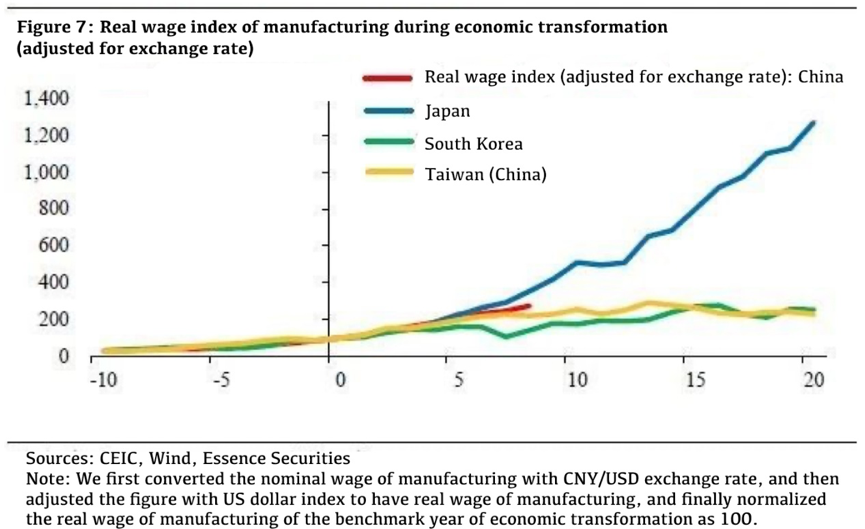
As shown in Figure 6, we first set the wage index at 100 in the first year of the transformation period to calculate the growth of real wages in local currency in the manufacturing industry during the transformation period. It can be seen that the cumulative increase of real wages of manufacturing sector in RMB terms were significantly larger than that of Japan, South Korea and Chinese Taiwan in the eight years of the transformation period. But this calculation does not take into account the impact of exchange rate appreciation, so we further converted the wage level into US dollar terms, taking into account the change in the value of the US dollar. As shown in Figure 7, this comparison still shows that in the eight years of economic transformation, the rise in dollar-denominated wage level of China's manufacturing industry was higher than that of Korea and Chinese Taiwan in the same period, but weaker than that of Japan.
If we regard the improvement of manufacturing competitiveness as the appreciation of exchange rate and the rise of real wage level in manufacturing industry, then in the past eight years, the competitiveness of China's manufacturing has been basically at a normal level in the context of the economic transformation of East Asian economies. As an alternative, we also compared car ownership per capita in East Asian economies at the same stage of development in the same approach, as shown in Figure 8. China's per capita car ownership is significantly lower than that of South Korea and Japan. But if we make a little adjustment to the comparison benchmark, we could find that the per capita car ownership become relatively close, for example if China's 2014 corresponds to Japan's 1968 and South Korea's 1991. But the growth of per capita car ownership in China was significantly slower.
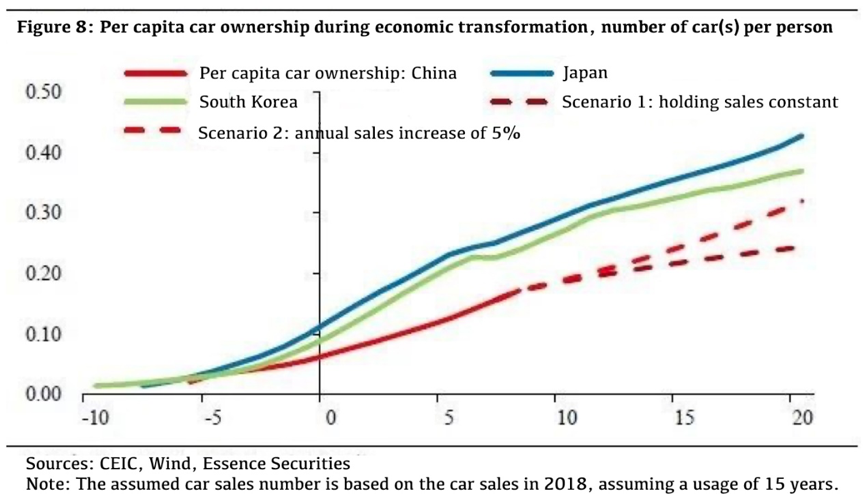
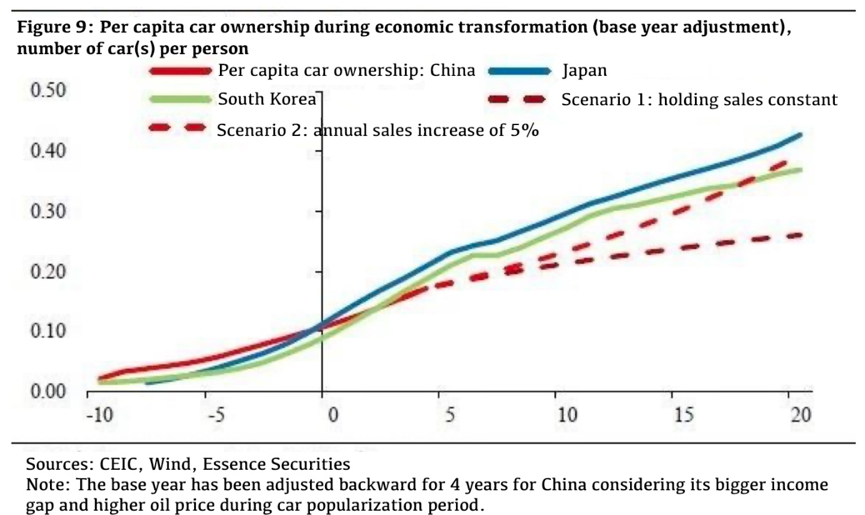
Why did we adjust the time period for comparison? One of the reasons is that when per capita income levels are similar, China's income distribution appears to be more unequal, which makes the number of people who can afford a car relatively lower. Even with such an adjustment, China's per capita car ownership is still rising more slowly. One possible reason is that the cost of using cars has risen sharply compared with the same stage of development of other countries. One is the sharp rise in oil prices, the other is global warming, environmental protection pressure, rapid increase in emission standards among other factors, pushing up the cost of having and using cars. If we assume that China's automobile sales growth rate will remain at the level of 5% in the next decade, we will see a sharp narrowing of the gap of per capita automobile ownership with these countries in the future. After adjusting the benchmark year for comparison, China's per capita car ownership could also exceed that of Japan and South Korea. Taking carbon emissions, environmental protection pressures, gasoline prices and other factors into consideration, we don't think such a situation is likely to occur at a comparable income level. If the growth rate of China's car sales in the future remains at around zero on average, with annual car sales remaining at the level of 2018, we believe this gap is likely to widen slightly. Based on these scenarios, it is unlikely that the trend growth rate of China's automobile sales will exceed 5% in the next decade, and China's automobile market has basically entered a "stock phase". Historically, automobiles and real estate have been very important forces to support China's rapid economic growth, and with the coming of the end of high-speed urbanization, the supporting role of real estate market has been greatly weakened. As the automobile industry gradually enters a "stock phase", the support from the growth of automobile consumption has also been significantly weakened. The change of demand force indicates that there are profound structural reasons for China's economic slowdown process, and it is highly likely that such a slowdown has not yet ended.
II. Three major indicators affecting economic performance in the next decade: Investment rate, leverage rate and population aging
Let's look at some other structural changes with conspicuous Chinese characteristics in the process of economic transformation.
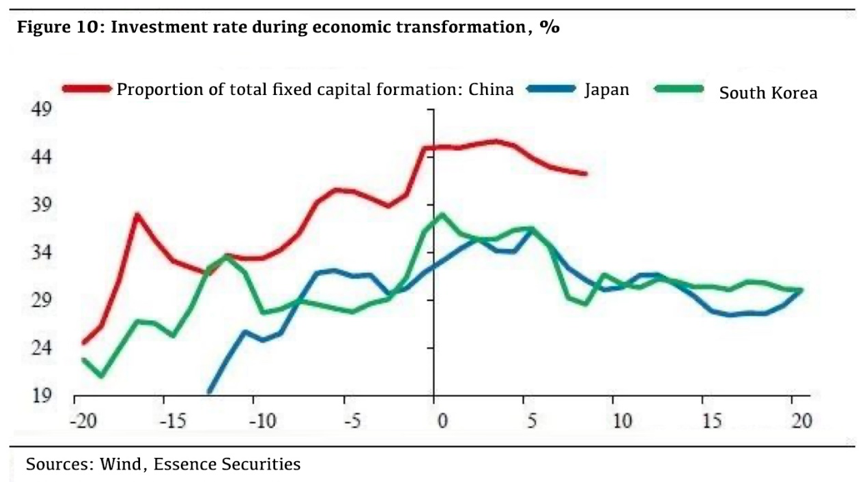
The first one is investment rate, as shown in Figure 10, after an economy crosses the turning point of transformation, investment rate begins to decline in trend, and the trend decline in investment rate is an important reason and background for economic slowdown. However, it is worth noting that China's investment rate has been significantly higher than that of other East Asian economies, and the decline of investment rate was very slow since the benchmark year. As shown in figure 11, for Japan and South Korea, after the benchmark year of economic transformation, the investment rates dropped by nearly 6 percentage points from their peak to re-stabilization, but so far the decline in China's investment rate has only been about 3 percentage points; and in comparison, Japan and South Korea saw a drop by about 2 percentage points each year on average, while China's average annual decline was only less than 1 percentage point.
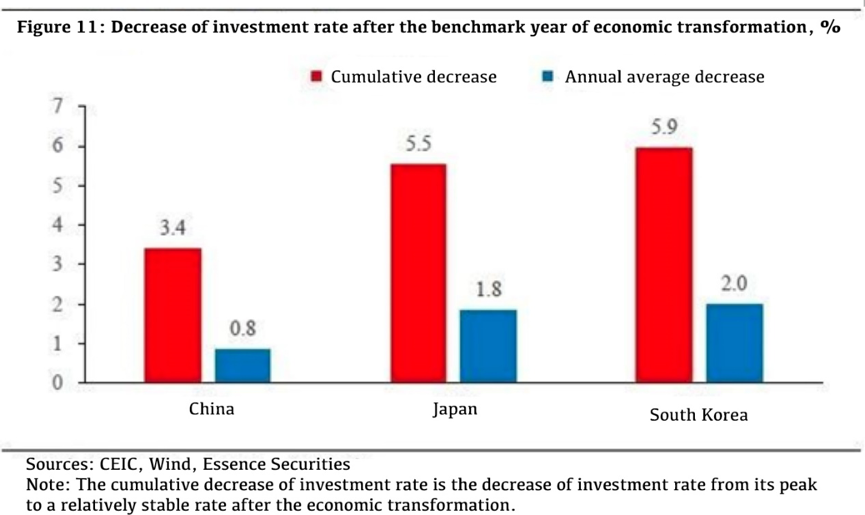
If the experience of economic transformation in other countries does make sense, it means that the decline of investment rate in China is far from over, and the decline of investment rate in the future will be accompanied by a trend slowdown of economic growth rate.
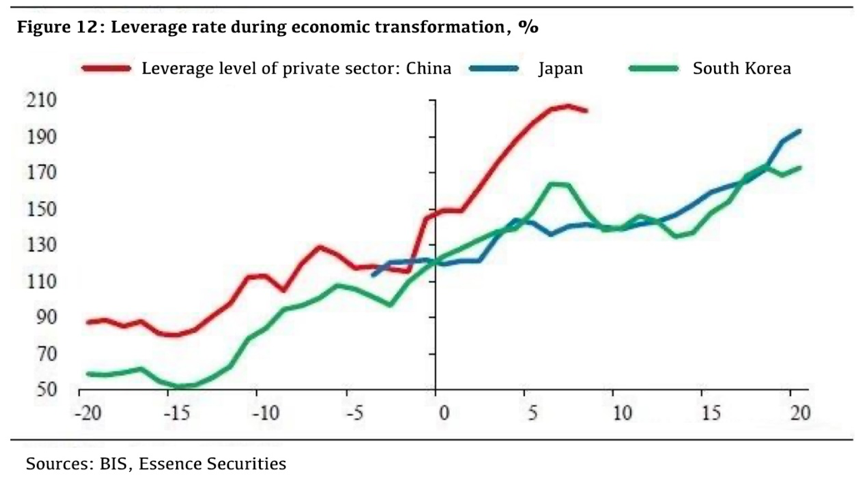
Why is not the current investment rate close to the bottom? To answer this question, we could again compare the changes in leverage rate during the economic transformation. As shown in Figure 12, with the increase of income level, leverage has increased overall, and the increase of leverage seems to have experienced acceleration before and after the economic transformation. Prior to the benchmark year of economic transformation, China's leverage rate had been higher than that of other economies, which was consistent with China's investment characteristics. However, after the benchmark year of the economic transformation, the increase of leverage in China was significantly higher than that in other economies.
From the cumulative increase of leverage in the eight years of transformation, as shown in Figure 13, the level of leverage in Japan and South Korea was 20-25 percentage points, while that in China was 55 percentage points. Why was the increase of leverage in China so large during economic transformation? This is mainly due to the frequent and large-scale use of counter-cyclical policies related to infrastructure, real estate among others to stimulate the economy, thus maintaining a relatively higher investment rate.
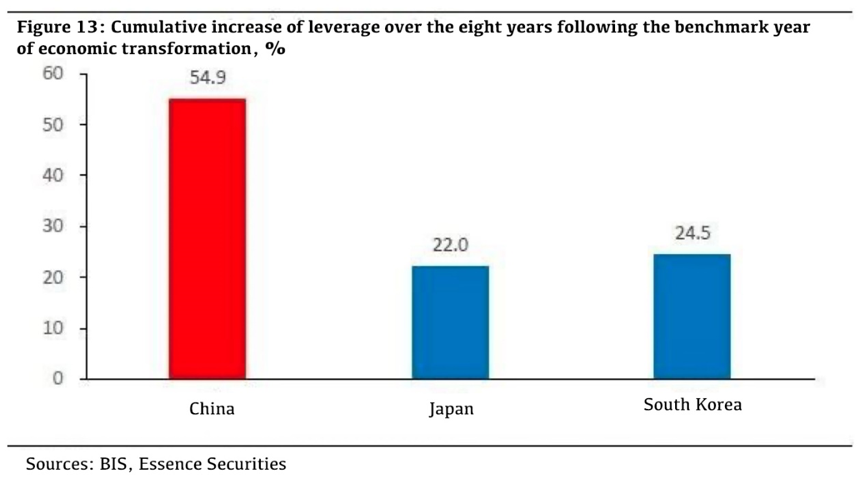
In other words, although China's economic growth rate in the process of economic transformation was slightly higher than that of other economies, it was based on a high investment rate, a slow decline of investment rate and a sharp rise of leverage rate, thus its sustainability is doubtful.
Beyond this, we can compare another unfavorable indicator for the economy in the context of economic transformation - the degree of aging, i.e., the proportion of people over 65 years old in the economy. As shown in Figure 14, China's aging level has always been higher than that of other economies in comparable periods due to the impact of family planning policy. The real problem is that China's aging population has accelerated significantly in recent years, and will accelerate further after 2027, which is quite an unfavorable prospect for China after economic transformation.
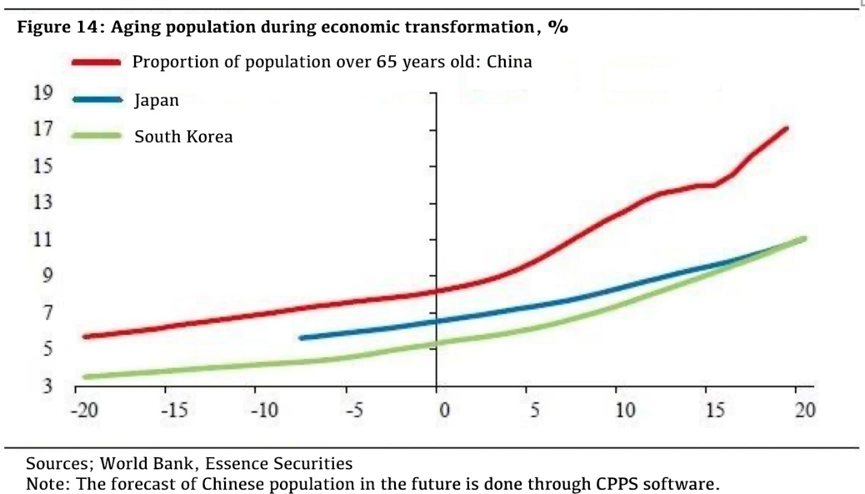
In conclusion, we compare China's economic transformation over the past eight years with that of similar periods in Japan, South Korea and Chinese Taiwan, and find that China's overall performance is close to these countries in terms of economic growth rate, urbanization, export and manufacturing competitiveness, but there are pressures associated with investment rate, leverage and population aging, which may further affect economic performance in the next decade (that is, 2020-2030).